

Abstract
Identification of maternal environmental factors influencing preterm birth risks is important to understand the reasons for the increase in prematurity since 1990. Here, we utilized a health survey, the US National Health and Nutrition Examination Survey (NHANES) to search for personal environmental factors associated with preterm birth. 201 urine and blood markers of environmental factors, such as allergens, pollutants, and nutrients were assayed in mothers (range of N: 49 to 724) who answered questions about any children born preterm (delivery <37 weeks). We screened each of the 201 factors for association with any child born preterm adjusting by age, race/ethnicity, education, and household income. We attempted to verify the top finding, urinary bisphenol A, in an independent study of pregnant women attending Lucile Packard Children’s Hospital. We conclude that the association between maternal urinary levels of bisphenol A and preterm birth should be evaluated in a larger epidemiological investigation.
Keywords: environmental exposure, environment-wide association study, preterm birth
1. Introduction
Preterm birth has complex etiology and identification of environmental factors that influence its risk is a priority. Factors postulated to influence risk for preterm birth include those associated with adverse lifestyle and behavior, such as stress, smoking, drug use, and nutrition (as summarized in references in [1, 2]). However, lifestyle and behavior represent a complex mixture of environmental exposures, such as particulates in air pollution or specific nutrients in food [3]. Pregnant women are exposed to a multitude of environmental factors [4]. Simultaneous investigation of a multitude of exposures is challenged by a lack of comprehensive data as well as analytic approaches to query data in a systematic fashion.
Recently, an analytical approach dubbed an “Environment-wide Association Study” (EWAS) has been proposed to search for multiple environmental factors connected to disease-related phenotypes, including blood pressure, type 2 diabetes, cholesterol, and mortality [5–8]. The objective of this investigation is exploratory and to apply the methodology to derive hypotheses between maternal levels of exposures of numerous factors with self-reported preterm birth. Specifically, we analyzed participants of four independent United States Nutrition and Examination Surveys (NHANES) between 1999 and 2006 whose serum, urine, or tap water had been assayed for levels of 201 environmental factors [9]. These factors included phenols, phthalates, industrial pollutants, and nutrition. We associated each of the 201 factors with history of self-reported preterm birth (delivery before 37 weeks). To lessen chances of reverse causality, we chose individuals who reported having their last birth at least 1 year prior to the survey. In doing so, the search for factors correlated with history of preterm birth is exploratory as measurement of exposures is subsequent to the delivery event.
The second objective of the study included exploration of the correlations between a top data-driven finding, bisphenol A, in an independent cohort study of 37 consenting pregnant women attending Lucile Packard Children’s Hospital at Stanford University Medical Center. In this study we observed nominally higher levels of urinary bisphenol A in mothers who went on to have a preterm birth.
2. Material and methods
2.1 Data: NHANES 1999–2000, 2001–2002, 2003–2004, 2005–2006
We used the NHANES to conduct a systematic scan of directly assayed maternal environmental factors associated with self-reported preterm birth. We downloaded all available NHANES laboratory and questionnaire data for 1999–2000, 2001–2002, 2003–2004, and 2005–2006 surveys. Each survey is an independent and non-overlapping sampling of participants representative of the United States population administered by the Centers for Disease Control and Prevention (CDC) and the National Centers for Health Statistics (NCHS) [10–13].
NCHS asked eligible participants how many times they have been pregnant (“How many times have you been pregnant”), the age of their last pregnancy (“How old were you at the time of your last birth?”) how many births resulted in “low birth weight” infants (“How many of your children weighed less than 5.5 pounds at birth?”). For individuals that answered “yes” to having a low birth weight infant, they were subsequently asked how many infants were born preterm (“How many children born preterm? A preterm delivery is one that occurs at 36 weeks or earlier in pregnancy.”). Therefore, participants with a history of preterm birth were restricted to those who had low birth weight children. No information was provided about the mode of preterm delivery, such as iatrogenic or labor induced. Further, no information was provided regarding whether preterm births were singleton or non-singleton. There were 1,446, 1,550, 1,415, and 1,361 participant mothers who at had at least 1 live birth in in the 1999–2000, 2001–2002, 2003–2004, and 2005–2006 surveys respectively, a total of 5,772 mothers in all surveys. We then restricted this sample of 5,772 participants to those who reported at least one pregnancy just one year prior to the time of survey to lessen the impact of exposures being measured too distant pregnancies from the gestational period of interest. This restriction yielded a total sample of 780 participants. Those who responded yes to having any preterm children were classified as participants with history of preterm birth (N=62) possible and those who responded to not having any preterm births were classified as a no history of preterm birth (N=718).
Laboratory data included serum, urine, or water measures of environmental factors (Figure 1B). We analyzed factors that were a direct measurement of environmental factors (e.g. amount of pesticide or heavy metal in urine or blood or amount of chemical compound in tap water sources of participants). There were 304 of these factors that were linkable to eligible participants with different sample sizes ranging from 2 to 62 participants with history of preterm and 44 to 700 without history of preterm birth. We eliminated from consideration 52 of these variables that had fewer than 10 participants with history of preterm. We further removed from consideration 51 variables because 99% of the observations were under the NCHS documented limits of detection. We also verified whether any variables that had NCHS documented limits of detection had a majority (>99%) of detected values belonging to participants who had a history of preterm birth. Supplementary Table 1 shows the number of participants with detected and non-detected factor values stratified by history of preterm. We found that none of the environmental variables were exclusively detected in participants with history of preterm birth (Table S1). No substitutions were made for variable values that were reported as less than the limit of detection. This left 201 variables (Figure 1B) in diverse categories such as infectious agents (13 bacteria and 11 viruses), 23 polychlorinated biphenyls, 6 dioxins, 7 di-alkyl pesticide metabolites, 22 pesticides, 32 nutrients, 21 heavy metals, 4 furans, 9 hydrocarbons, 3 phenols, 11 phthalates, 6 phytoestrogens, 9 polyfluorochemicals, and 20 volatile organic compounds measured in participants’ tap water or serum. Of these, 40 serum-measured variables representing lipophilic compounds, including furans, polychlorinated biphenyls, and organochlorinated pesticides were reported on both a whole weight in serum (“unadjusted”) as well as relative to total serum lipids (“lipid-adjusted”) basis. For these variables in our scan, we analyzed the whole-weight variables and compared the estimates and p-values of the whole weight variables to the lipid adjusted variables. In summary, the 201 environmental factors were measured in varying numbers of participants, ranging from N=106 to N=762. Individuals are selected randomly based on their demographic characteristics for the complex, stratified survey [14].
Figure 1. Method to screen for factors associated with preterm birth.

A.) Case and control assessment from the reproductive health questionnaire. B.) Category, number of blood/urine markers, and sample sizes for 201 exposures.
2.2 Systematic scan of environmental biomarkers of exposure associated with self-reported preterm birth
Our analysis consisted of performing 201 survey-weighted logistic regressions, where history of preterm birth was the dependent variable and modeled as a function of each environmental factor and age, race-ethnicity, education and socioeconomic status (SES), and number of births. For SES we used the tertile of poverty index (participant’s household income divided by the time-adjusted poverty threshold), as previously described [5, 6]. Race-Ethnicity was grouped as: Mexican American, Non-Hispanic Black, Non-Hispanic White, Other Hispanic, or Other. We chose these factors for adjustment as they are known to be associated with preterm birth and likely also associated with exposure [1]. We used R survey module for all survey-weighted analyses [15] with appropriate pseudo-strata, pseudo-sampling units, and weights to accommodate the complex sampling of the data. We chose weights corresponding to the smallest sub-sample for each environmental factor tested. Because of the comparison between individuals with and without history of preterm birth, exposure measurements follow the delivery events.
We transformed continuous measurements to “z-scores” (number of standard deviations from the mean) to compare effect sizes; specifically, effect sizes for these variables denote change in odds for preterm birth for a change in 1 standard deviation of exposure. For binary variables, such as presence/absence assays for infectious agents, effect sizes denote change in odds for preterm birth for those with a factor versus those without.
To account for multiple hypotheses, we calculated the false discovery rate (FDR), the estimated proportion of false discoveries made versus the number of total discoveries made for a given significance level [16]. Specifically, we used the Benjamini-Hochberg step-down procedure to compute the FDR [16]. We ranked findings from lowest to highest FDR (which corresponds to the lowest to highest p-values). We considered factors that achieved an FDR less than 40–50% to be the least susceptible to be a spurious finding and worth examining further in an independent cohort of patients attending Stanford Hospital and Clinics.
2.3 Examination of Bisphenol A in patients at Lucile Packard Children’s Hospital at Stanford
All women consented for their urine samples to be used in research and the study was approved by the Stanford University School of Medicine Internal Review Board (Protocol number 12003)., We collected maternal urine samples at different points during gestation in women at Lucile Packard Children’s Hospital at Stanford, a tertiary care birth and pediatric hospital. Individuals who had spontaneously delivered prior to 37 weeks of gestation (n=16) were classified as having preterm birth while the reference group contained participants who had births at greater than or equal to 37 weeks gestational age (n=21). Gestational age was defined as weeks from last menstrual period, and confirmed with earliest ultrasound available. If dating by first available ultrasound was more than 7 days different (for first trimester ultrasound), or more than 14 days different (for second trimester ultrasound), gestational age was based on first available ultrasound. We sampled each woman’s urine at a single point during gestation (mean gestational age for urine collection was 30.5 and 29.8 for those having preterm and not having preterm births respectively). The range of gestational age for sample collection was 23–35 weeks. Collection of urine was facilitated by a routine visit to the clinic or when a participant presented with preterm labor.
Urine samples (5–10 mL) were collected in polyethylene sterile tubes and held at 4°C for up to 48 h before centrifugation (2,000×g× 20 min at room temperature) and freezing of the supernatant at −70°C. Urine levels of bisphenol A and creatinine were quantified by commercial assay kits and pregnancy outcomes were blind to the investigators (BXL, TY). Bisphenol A and creatinine ELISA assay kits were from Abnova Inc. (Taipei, Taiwan). First, we tested whether bisphenol A concentrations were higher in individuals that had preterm birth versus those that did not (the reference group) with a one-tailed Mann-Whitney test. Second, we tested whether higher bisphenol A concentrations led to higher odds for preterm birth versus those without (the reference group) using multivariate logistic regression and adjusting for age, gestational age at collection, creatinine levels, body mass index, and race. We tested whether the adjusted coefficient for bisphenol A was greater than zero using a one-sided test.
3. Results
3.1 Demographic characteristics of NHANES participants reporting preterm birth
We assessed demographic differences between participants who reported a history of preterm birth and a pregnancy just prior to the time of survey (Table 1). As reported in other studies [17] we observed a higher proportion of Non-Hispanic Blacks reporting preterm birth versus no preterm birth, and a lower proportion of Mexican Americans reporting preterm birth Non-Hispanic White Americans. Those who did report a history of preterm birth tended to have lower education than those who did not. Socioeconomic status, however, appeared to be similar in the two groups. Participants who reported preterm births had slightly greater number of pregnancies than controls (mean number of 3.4 versus 2.7). Both groups reported a similar number of total live births (2.05 versus 1.9).
Table 1.
Demographic attributes for NHANES 1999–2000, 2001–2002, 2003–2004, and 2005–2006 surveys.
| Any previous preterm (N=62*) |
No previous preterm (N=718*) |
|
|---|---|---|
| Mean age in years (SD) | 27.8 (1.1) | 27.5 (0.4) |
| Mean number of times pregnant (SD) | 3.4 (0.3) | 2.7 (0.1) |
| SES (income/poverty index) % | ||
| tertile 1 | 51 | 52 |
| tertile 2 | 35 | 26 |
| tertile 3 | 14 | 22 |
| Race % | ||
| White | 58 | 61 |
| Mexican | 7 | 17 |
| Black | 27 | 14 |
| Other Hispanic | 4 | 5 |
| Other | 4 | 3 |
| Education % | ||
| Less than HS | 40 | 23 |
| High School (HS) | 24 | 23 |
| Greater than HS | 36 | 54 |
| Mean Body Mass Index (SD) | 26.3 (1.1) | 27.7 (0.3) |
denotes unweighted sample size.
3.2 Systematic scan of environmental exposures associated with self-reported preterm birth
We examined each of the 201 environmental variables (biomarkers or direct measures of exposure) for association with self-reported history preterm birth adjusting for age, race-ethnicity, SES, educational attainment, and survey year. An adjusted odds ratio (OR) denotes risk for self-reported previous preterm birth per 1 standard deviation (SD) of change in exposure level.
Figure 2 shows top five environmental factors ranked by p-value found in this scan and Table S2 shows results for all 201 variables as ranked by p-value/FDR. Only two factors achieved a FDR under 50%, Bisphenol A and iron. However, the top findings had relatively large effects with ORs approaching two. The finding with the lowest p-value/FDR included urinary Bisphenol A (adjusted OR per 1 SD of exposure level: 1.9, 95% CI: [1.4, 2.6], p=0.002, FDR=33%). We estimated the power for this sample size (10 participants with preterm history and 99 participants without preterm history) and effect size (OR=2.0) for two-sided test (p-value <= 0.05) to be 79% [18].
Figure 2. Top 5 biomarkers of exposure (p≤0.02) associated with self-reported preterm birth.
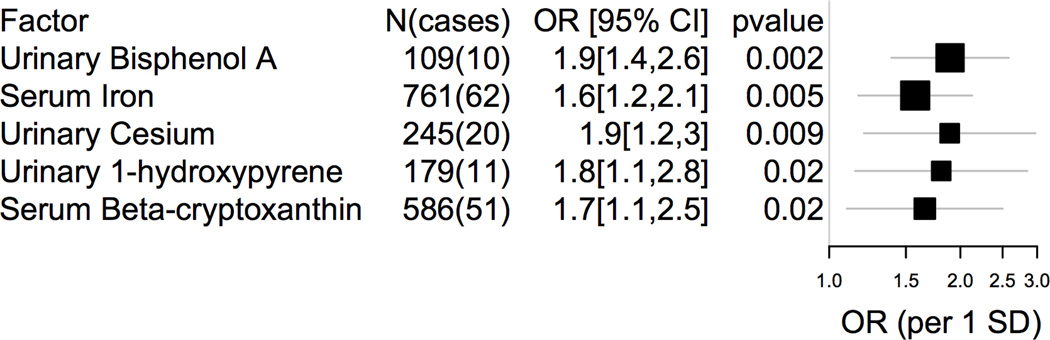
OR=Odds Ratio, CI=Confidence Interval, SD=standard deviation of exposure. Box sizes proportional to standard error.
Other top findings included urinary markers of hydrocarbon exposure, such as 1-hydroxypyrene (adjusted OR: 1.8, 95% CI: [1.2, 2.9], p=0.02) and 3-phenanthrene (adjusted OR: 2.6, 95% CI: [1.2, 5.9], p=0.03); however the FDR for these findings were greater than 50% (56%).
Surprisingly, higher levels of serum levels of iron and a carotenoid β-cryptoxanthin were associated with preterm birth. Serum iron had an adjusted OR of 1.6 (95% CI: [1.2, 2.1], p=0.005, FDR=48%). Similarly, serum β-cryptoxanthin had an adjusted OR of 1.7 (95% CI: [1.1, 2.5], p=0.02, FDR=56%). The effects for iron were equivalent after adjustment for total iron intake (derived from a food frequency questionnaire) and total supplement use (number of supplements per day), having an adjusted OR of 1.5 (95% CI: [1.1, 2.1], p=0.01). Adjusting for total β-cryptoxanthin intake and total supplement use, effects for serum β-cryptoxanthin were similar to the original estimate (adjusted OR: 1.6, 95% CI: [0.93, 2.70], p=0.11).
We assessed whether inclusion of 40 lipid-adjusted variables compared to only using their whole weight counterparts could influence the results of the scan. While the lipid-adjusted point effect sizes were different than their whole-weight counterparts (Figure S1A), they still had high p-values (Figure S1B). The p-value range for the whole weight variables was 0.11 to 0.9 versus 0.05 to 1 lipid-adjusted variables (Figure S1B). The FDR for the whole weight variables ranged from 70–100% while the FDR for the lipid-adjusted variables were 60–100%. Inclusion of lipid-adjusted variables would not have changed the reported findings.
We re-estimated the association between bisphenol A and preterm birth adjusting for creatinine to account for urine concentration [19] and body mass index (BMI). We adjusted for BMI as a potential confounder given its association with both bisphenol A [20] and preterm birth [21]. We observed that the association persisted after creatinine and BMI adjustment with an OR of 2.6 (95% CI: [1.4, 4.8], Table 2).
Table 2.
Bisphenol A under additional adjustment for creatinine. Model 1: adjustments for age, race, education, SES. Creatinine-/BMI-adjusted model: adjustments of model 1 plus creatinine and BMI as co-variates.
| OR (95% CI) | p-value | Geometric mean BPA in cases |
Geometric mean BPA in controls |
|
|---|---|---|---|---|
| Model 1 | 1.9 [1.4, 2.5] | 0.001 | 4.36 ug/L | 2.10 ug/L |
| Creatinine-/BMI-adjusted | 2.7 [1.4, 4.8] | 0.01 | 3.52 ng/g | 2.07 ng/g |
3.3 Examination of Bisphenol A in pregnant women delivering at Lucile Packard Children’s Hospital at Stanford
We sought to tentatively confirm maternal differences in bisphenol A in individuals having preterm birth versus not having a preterm birth, our top data-derived hypothesis, in samples obtained from a second independent cohort. We observed little to no differences in age (p=0.5), body mass index (p=0.2), gestational age (p=0.9) at enrollment, or ethnicity (p=0.5) between cases and controls (Table 3). The median of bisphenol A concentrations was 0.06 ug/mL (interquartile range of 0.069 ug/mL).
Table 3.
Demographic attributes for consenting pregnant women delivering at the Lucile Packard Children’s Hospital at Stanford.
| preterm (N=16) |
no preterm (N=21) |
|
|---|---|---|
| Mean age in years (SD) | 29.5 (6.1) | 32.2 (7.1) |
| Race N (%) | ||
| Black | 1 (5.6) | 0 (0) |
| Asian | 3 (18.8) | 4(19) |
| Caucasian | 2 (12.5) | 11 (52.4) |
| Hispanic | 10 (62.5) | 6 (28.6) |
| Mean gestational age at delivery week (SD) | 32.5 (2.9) | 39.7 (1.2) |
| Mean gestational age at collection week (SD) | 30.5 (2.8) | 30.3 (4.1) |
| Mean birthweight. grams (SD) | 2065.2 (683.9) | 3410.1 (499.6) |
| Mean body mass index, kg/m2 (SD) | 27.0 (6.0) | 24.2 (6.5) |
We observed that bisphenol A concentrations were nominally higher in individuals that gave preterm birth versus those that did not; however, we did not have conclusive evidence to completely validate the correlation in the Stanford-based investigation. The geometric mean of bisphenol A in individuals that gave preterm birth versus those that did not was 0.07 and 0.03 ug/mL respectively (Mann-Whitney one-sided p=0.11). The creatinine-normalized mean of bisphenol A was 325 ug/g and 257 ug/g in individuals that gave preterm birth versus those that did not (Mann-Whitney one-sided p=0.01). The OR for a 1 SD change in bisphenol A after adjustment for maternal age, race, creatinine, and gestational age of sample collection was 3.5 (one-sided 95% CI: [0.73, 17.00]). However, the one-sided p-value was 0.09.
4. Discussion
Enabled by publicly-available health surveys assaying 201 environmental factors in mothers, we identified a few exposures tentatively associated with self-reported preterm birth. We have extended the original scanning methodology [5–7] by testing our top finding in an external cohort. We emphasize the analyses presented here are exploratory and correlative as exposures are ultimately ascertained after pregnancy events; however, it is one way to create hypotheses to study factors associated with premature birth events in larger epidemiological studies.
We found urinary biomarkers of polycyclic aromatic hydrocarbons exposures [22], including 3-phenanthrene and 1-hydroxypyrene (p=0.02), associated with preterm birth. While these factors had higher FDR (>50%), they remain viable candidates for further study given associations between preterm birth and other co-existing air pollution factors, including carbon monoxide, ozone, PM10, nitrous oxide (e.g., [23–28]). In a recent study of Saudi Arabian mothers with no history of occupational or smoking exposure (N=1,497), Al Saleh and colleagues found a small and negative univariate effect of urinary 1-hydroxypyrene levels in relation to head circumference and birth weight [29]. Smoking can influence associations between 1-hydroxypyrene and preterm birth. For example, investigators have reported an association between 1-hydroxypyrene and preterm birth, but the association became null after adjustment for serum cotinine [30] or when considering smoking status of participants [31]. In an earlier investigation between environmental factors and lipid levels, we found a strong correlation between hydroxypyrene and serum cotinine [6]. On the other hand, few investigations have explored other components of aromatic hydrocarbon mixtures, such as phenanthrene. In a small study in Lucknow, India (29 preterm and 31 full-term births), Singh and colleagues found higher levels of biomarkers, including phenanthrene, of polycyclic aromatic hydrocarbons in placental tissue collected right after birth. While our data-driven method is one way to address multiple environmental factors to which individuals are exposed, future studies should aim to decipher the connection between internal biomarkers of exposure, such as markers of phenanthrene and hydroxypyrene, and external factors and behaviors, such as PM10 and cigarette smoking, to attribute sources of exposure. In fact, 1-hydroxypyrene is the main metabolite of pyrene, which is abundant in polyaromatic hydrocarbon mixtures [32].
Bisphenol A was ranked highest according to p-value and FDR. Bisphenol A is an omnipresent and prevalent compound used in industrial and commercial products, such as part of the resin in tin cans and plastic containers [33–35]. The concentrations we observed in individuals with a history of preterm birth were larger than overall means for women in the NHANES survey [36]. In a recent nested case-control study (N=60) of Mexico City mothers, Cantonwine and colleagues observed an adjusted OR of 1.9 (95% CI [0.93, 3.91]) for concentrations of urinary bisphenol A [37], but these results were not significant.
We performed an exploratory study investigating the association between bisphenol A and preterm birth in a group of consenting mothers who attended Stanford Medical Clinics. While we observed a nominal difference in bisphenol A levels (similar to Cantonwine and colleagues [37]), the adjusted association was not significant (adjusted p=0.09); however, the OR were greater than 1 in all investigations, including the initial scan (adjusted OR of 3.5 and 2.6 respectively). The lack of significance could be due to (but not limited to) the small sample size of the study, a spurious finding, and/or misclassification of the measurement. The half-life of bisphenol A in human tissue is under discussion in the literature [38] and misclassification due to a small half-life can negatively influence the association. Further, we acknowledge that the accuracy of ELISA to measure bisphenol A in human samples is also under debate [34]. Multiple techniques have been used to measure total bisphenol A in human urine. In NHANES, the CDC assayed urinary bisphenol A using solid-phase extraction coupled with isotope dilution-HPLC (high performance liquid chromatography)-mass spectrometry (MS)/MS. This assay method is considered as the “gold standard” for urine monitoring analysis because of its high level accuracy, negligible interference, and ability to identify chemical structures [36]. However, this method is limited by its high cost per sample and technical complexity with mass spectrometric analysis, making it impractical for many studies. The ELISA method is considered as less specific and can detect substances other than bisphenol A and its conjugates, including other phenols [39] and thus may overestimate the amount of chemical present. However, the ELISA method is an accessible method for exploratory analysis [34]. While error in ELISA measurement can dilute the OR estimate, error correlated with preterm birth status was unlikely.
Preterm birth is likely a multifactorial condition and, if not spurious, the role of bisphenol A in preterm birth is not clear. One path might be through changes in fetal growth. Maternal human levels of bisphenol A have been shown to lower fetal growth rates, including on weight (an overall difference of −683g for women who had > 4.2 ug/g bisphenol A) and head circumference (−3.9cm for women who had >4.2 ug/g bisphenol A) [40]. However, a previous study has shown null associations between bisphenol A and newborn body size [41]. Bisphenol A is a compound that may mimic estrogen [42] and there are numerous pathways that estrogen receptor regulates [43]. In rodent systems in both males and pregnant females, investigators have observed a range of effects for “low doses” (e.g., resulting in levels equivalent to that found in human serum) of bisphenol A, involving metabolism, immune function and inflammation (as reviewed in [44]). It is hypothesized that inflammation response may influence preterm birth as observed in animal models [45] and, in mouse systems, cytokine and antibody production can be modulated by bisphenol A [46]. Bisphenol A has been associated with chronic conditions including increased body mass index [47, 48], a risk factor for preterm birth. Specifically, Carwile and colleagues reported an OR for obesity of 1.85 (quartile 2 versus lowest quartile of bisphenol A; 95% CI: [1.2, 2.8]) [48] and Wang and colleagues reported OR of 1.5 (highest versus lowest quartile of bisphenol A; 95% CI: [1.15, 1.97]) [47]. Both toxicological and larger epidemiological studies must now decipher the role, if any, of bisphenol A in the pathways toward risk for preterm birth.
A major source of bisphenol A mainly occurs through the diet [49] including from the lining of metal food and drink cans (e.g. [50]). Thus, a mixture of other diet-related environmental factors, associated with canned food consumption may be in turn associated with preterm birth risk. However, as of this writing, there are a few studies to imply diets correlated to canned food consumption associated with preterm birth risk. Xue and colleagues found an association between higher levels of mercury consumption (> 90th percentile of hair mercury concentration) and women who delivered before 35 weeks of gestation, and further, it was posited that greatest source of mercury came from canned fish [51]. In our study, we observed total serum mercury was associated with nominally greater odds of preterm birth (OR: 1.2), but the result was insignificant (p=0.2). Other investigations have implicated both sugar and artificially sweetened soft drinks with preterm birth risk, but the container source of these drinks was not specified [52, 53]. Unfortunately, in this exploratory investigation we lacked participants with preterm history that had all environmental factors measured simultaneously; therefore we could not model their simultaneous (e.g., additive or interaction) effect on odds for preterm birth.
While our approach was novel in its search for environmental factors connected with preterm birth, we acknowledge some drawbacks. First, sample sizes for many environmental factors tested were small, especially for our top finding, and we may be underpowered to detect smaller effects (at low FDR) of many environmental factors. Second, NHANES is a cross-sectional and observational survey, and thus our results may be confounded or reverse-causal. For example, our top findings included a positive correlation between nutrients, including higher serum iron levels and the carotenoid β-cryptoxanthin, and preterm birth that persisted even after accounting for food intake and total supplement use. We hypothesize these findings to be indicative of behavior or “reverse-causality” bias. For example, iron deficiency anemia is linked to preterm birth risk [54] and the positive association may indicate supplement use behavior enriched in individuals who reported a history of preterm birth. The positive association between β-cryptoxanthin, a carotenoid nutrient and precursor to vitamin A, and preterm birth may indicate preventive behavior after the preterm birth has occurred. Nevertheless, we emphasize that these are hypotheses and we lack data, to infer the causal relationship between these factors and preterm birth.
The initial data-driven scan consisted of many different types of factors, ranging from persistent serum-assayed organic pollutants to others that had shorter half-lives such as urine-measured phenols, including bisphenol A. These differences may result in differences in classification. For example, the shorter half-life of phenols or phthalates may result in misclassification. If this error was not dependent on whether participants had a history of preterm birth, then the initial scan may have lacked power to detect these factors. Second, factors were measured on different number of individuals, also leading to a difference in power. Importantly, the exposure event detected for factors with shorter half-lives was most after the birth event. The nature of these data did not permit us to deduce whether higher exposures a year after the preterm birth event would have been similarly higher or lower before the actual preterm birth event. In future studies considering factors with short half lives such as bisphenol A and pregnancy outcomes, it will be necessary to capture exposure with repeated measurements [55].
The actual interval of time between the preterm birth event and the collected measurements was not known. While we examined participants who had just given birth one year prior the survey, we were not able to ascertain whether that particular birth was the one that was actually preterm. Further, we lacked information regarding type of preterm birth and as a result could not consider fully prior history of preterm birth in the data-driven scan.
Relatedly, self-reported history of preterm birth may also be prone to error or recall bias and can influence ORs. Several investigations have shown that mothers can recall birth events such as preterm delivery with reasonable accuracy when interviewed few years after the birth event [56, 57] with 80–90% agreement. However, Tate and colleagues have shown that while maternal recall of child birth weight was accurate overall (average difference between actual birthweight and recalled value was close to 0), recall was different depending on race/ethnicity and socioeconomic status of individuals; for example individuals who were not British white or of lower socioeconomic status were more likely to recall discrepant birth weights [58]. NHANES reflects the mixed ethnic and socioeconomic backgrounds of the United States; therefore, error or bias may be more likely for some individuals versus others.
Conclusions
Despite these drawbacks, we have taken a hypothesis-generating approach employing our systematic analysis methodology to help investigators decipher how over 200 factors of the “exposome” [59] – the totality of environmental exposures from birth onwards [60] -- may (or may not) influence adverse outcomes related to human development and reproduction, such as preterm birth [61]. We emphasize that given the correlational nature of the exploratory screen and the lack of conclusive results from small verification study, the top finding, bisphenol A, must be examined in a larger epidemiological study to ascertain risk for preterm birth.
Supplementary Material
Table S1. Number of participants with factor concentrations equal or greater than the limit of detection. Hx=History.
Table S2. Association results for 201 exposures. OR=odds ratio.
Figure S1. Effect sizes and p-values for 40 lipophilic variables. A.) Adjusted OR of whole-weight measured variables versus Adjusted OR of lipid-adjusted variables. Lipid-adjusted variables are smaller in absolute value for OR > 1 and larger in absolute value for OR < 1. B.) p-value of whole-weight measured variables versus p-value of lipid-adjusted variables. P-values remain >0.05 for both types of variables.
Acknowledgements
Support for this work came in part from the March of Dimes Stanford University Prematurity Research Center.
Abbreviations
- CDC
Centers for Disease Control and Prevention
- EWAS
Environment-wide association study
- FDR
false discovery rate
- LPCH
Lucile Packard Children’s Hospital
- NCHS
National Centers for Health Statistics
- NHANES
National Health and Nutrition Examination Survey
- SES
socioeconomic status
Footnotes
The authors report no conflict of interest.
References
- 1.Committee on Understanding Premature Birth and Assuring Healthy Outcomes. Preterm Birth: Causes, Consequences, and Prevention. Washington DC: National Academies Pres; 2007. [Google Scholar]
- 2.Murphy DJ. Epidemiology and environmental factors in preterm labour. Best Pract Res Clin Obstet Gynaecol. 2007;21:773–789. doi: 10.1016/j.bpobgyn.2007.03.001. [DOI] [PubMed] [Google Scholar]
- 3.Schwartz D, Collins F. Medicine. Environmental biology and human disease. Science. 2007;316:695–696. doi: 10.1126/science.1141331. [DOI] [PubMed] [Google Scholar]
- 4.Woodruff TJ, Zota AR, Schwartz JM. Environmental chemicals in pregnant women in the United States: NHANES 2003–2004. Environ Health Perspect. 2011;119:878–885. doi: 10.1289/ehp.1002727. [DOI] [PMC free article] [PubMed] [Google Scholar]
- 5.Patel CJ, Bhattacharya J, Butte AJ. An Environment-Wide Association Study (EWAS) on type 2 diabetes mellitus. PLoS ONE. 2010;5:e10746. doi: 10.1371/journal.pone.0010746. [DOI] [PMC free article] [PubMed] [Google Scholar]
- 6.Patel CJ, Cullen MR, Ioannidis JP, Butte AJ. Systematic evaluation of environmental factors: persistent pollutants and nutrients correlated with serum lipid levels. Int J Epidemiol. 2012;41:828–843. doi: 10.1093/ije/dys003. [DOI] [PMC free article] [PubMed] [Google Scholar]
- 7.Tzoulaki I, Patel CJ, Okamura T, Chan Q, Brown IJ, Miura K, et al. A nutrient-wide association study on blood pressure. Circulation. 2012;126:2456–2464. doi: 10.1161/CIRCULATIONAHA.112.114058. [DOI] [PMC free article] [PubMed] [Google Scholar]
- 8.Patel CJ, Rehkopf DH, Leppert JT, Bortz WM, Cullen MR, Chertow GM, et al. Systematic evaluation of environmental and behavioral factors associated with all-cause mortality in the United States National Health and Nutrition Examination Survey. Int J Epidemiol. 2013 doi: 10.1093/ije/dyt208. In press. [DOI] [PMC free article] [PubMed] [Google Scholar]
- 9.Centers for Disease Control and Prevention (CDC) National Health and Nutrition Examination Survey. Atlanta, GA: CDC; 2013. [Google Scholar]
- 10.Centers for Disease Control and Prevention (CDC), National Center for Health Statistics (NCHS) National Health and Nutrition Examination Survey Data, 1999–2000. Hyattsville, MD: U.S. Department of Health and Human Services, Centers for Disease Control and Prevention; [Google Scholar]
- 11.Centers for Disease Control and Prevention (CDC), National Center for Health Statistics (NCHS) National Health and Nutrition Examination Survey Data, 2001–2002. Hyattsville, MD: U.S. Department of Health and Human Services, Centers for Disease Control and Prevention; [Google Scholar]
- 12.Centers for Disease Control and Prevention (CDC), National Center for Health Statistics (NCHS) National Health and Nutrition Examination Survey Data, 2003–2004. Hyattsville, MD: U.S. Department of Health and Human Services, Centers for Disease Control and Prevention; [Google Scholar]
- 13.Centers for Disease Control and Prevention (CDC), National Center for Health Statistics (NCHS) National Health and Nutrition Examination Survey Data, 2005–2006. Hyattsville, MD: U.S. Department of Health and Human Services, Centers for Disease Control and Prevention; [Google Scholar]
- 14.Ezzati TM, Massey JT, Waksberg J, Chu A, Maurer KR. Sample design: Third National Health and Nutrition Examination Survey. Vital Health Stat 2. 1992:1–35. [PubMed] [Google Scholar]
- 15.Lumley T. survey: analysis of complex survey samples. 2009;3 [Google Scholar]
- 16.Benjamini Y, Hochberg Y. Controlling the false discovery rate: a practical and powerful approach to multiple testing. J R Statist Soc B. 1995 [Google Scholar]
- 17.Martin JA, Hamilton BE, Sutton PD, Ventura SJ, Mathews TJ, Kirmeyer S, et al. Births: final data for 2007. Natl Vital Stat Rep. 2010;58:1–85. [PubMed] [Google Scholar]
- 18.Hsieh FY, Bloch DA, Larsen MD. A simple method of sample size calculation for linear and logistic regression. Stat Med. 1998;17:1623–1634. doi: 10.1002/(sici)1097-0258(19980730)17:14<1623::aid-sim871>3.0.co;2-s. [DOI] [PubMed] [Google Scholar]
- 19.Barr DB, Wilder LC, Caudill SP, Gonzalez AJ, Needham LL, Pirkle JL. Urinary creatinine concentrations in the U.S. population: implications for urinary biologic monitoring measurements. Environmental health perspectives. 2005;113:192–200. doi: 10.1289/ehp.7337. [DOI] [PMC free article] [PubMed] [Google Scholar]
- 20.Lang IA, Galloway TS, Scarlett A, Henley WE, Depledge M, Wallace RB, et al. Association of urinary bisphenol A concentration with medical disorders and laboratory abnormalities in adults. J Am Med Assoc. 2008;300:1303–1310. doi: 10.1001/jama.300.11.1303. [DOI] [PubMed] [Google Scholar]
- 21.Cnattingius S, Villamor E, Johansson S, Edstedt Bonamy AK, Persson M, Wikstrom AK, et al. Maternal obesity and risk of preterm delivery. J Am Med Assoc. 2013;309:2362–2370. doi: 10.1001/jama.2013.6295. [DOI] [PubMed] [Google Scholar]
- 22.Ciarrocca M, Rosati MV, Tomei F, Capozzella A, Andreozzi G, Tomei G, et al. Is urinary 1-hydroxypyrene a valid biomarker for exposure to air pollution in outdoor workers? A meta-analysis. J Expo Sci Environ Epidemiol. 2013 doi: 10.1038/jes.2012.111. [DOI] [PubMed] [Google Scholar]
- 23.Darrow LA, Klein M, Flanders WD, Waller LA, Correa A, Marcus M, et al. Ambient air pollution and preterm birth: a time-series analysis. Epidemiology. 2009;20:689–698. doi: 10.1097/EDE.0b013e3181a7128f. [DOI] [PMC free article] [PubMed] [Google Scholar]
- 24.Malmqvist E, Rignell-Hydbom A, Tinnerberg H, Bjork J, Stroh E, Jakobsson K, et al. Maternal exposure to air pollution and birth outcomes. Environ Health Perspect. 2011;119:553–558. doi: 10.1289/ehp.1002564. [DOI] [PMC free article] [PubMed] [Google Scholar]
- 25.Leem JH, Kaplan BM, Shim YK, Pohl HR, Gotway CA, Bullard SM, et al. Exposures to air pollutants during pregnancy and preterm delivery. Environmental health perspectives. 2006;114:905–910. doi: 10.1289/ehp.8733. [DOI] [PMC free article] [PubMed] [Google Scholar]
- 26.Ritz B, Wilhelm M, Hoggatt KJ, Ghosh JK. Ambient air pollution and preterm birth in the environment and pregnancy outcomes study at the University of California, Los Angeles. Am J Epidemiol. 2007;166:1045–1052. doi: 10.1093/aje/kwm181. [DOI] [PubMed] [Google Scholar]
- 27.Huynh M, Woodruff TJ, Parker JD, Schoendorf KC. Relationships between air pollution and preterm birth in California. Paediatr Perinat Epidemiol. 2006;20:454–461. doi: 10.1111/j.1365-3016.2006.00759.x. [DOI] [PubMed] [Google Scholar]
- 28.Olsson D, Mogren I, Forsberg B. Air pollution exposure in early pregnancy and adverse pregnancy outcomes: a register-based cohort study. BMJ Open. 2013;3 doi: 10.1136/bmjopen-2012-001955. [DOI] [PMC free article] [PubMed] [Google Scholar]
- 29.Al-Saleh I, Alsabbahen A, Shinwari N, Billedo G, Mashhour A, Al-Sarraj Y, et al. Polycyclic aromatic hydrocarbons (PAHs) as determinants of various anthropometric measures of birth outcome. Sci Total Environ. 2013;444:565–578. doi: 10.1016/j.scitotenv.2012.12.021. [DOI] [PubMed] [Google Scholar]
- 30.Polanska K, Hanke W, Sobala W, Brzeznicki S, Ligocka D. Exposure to polycyclic aromatic hydrocarbons and newborn biometric indicators. Int J Occup Med Environ Health. 2010;23:339–346. doi: 10.2478/v10001-010-0028-1. [DOI] [PubMed] [Google Scholar]
- 31.Suzuki Y, Niwa M, Yoshinaga J, Mizumoto Y, Serizawa S, Shiraishi H. Prenatal exposure to phthalate esters and PAHs and birth outcomes. Environ Int. 2010;36:699–704. doi: 10.1016/j.envint.2010.05.003. [DOI] [PubMed] [Google Scholar]
- 32.Strickland P, Kang D, Sithisarankul P. Polycyclic aromatic hydrocarbon metabolites in urine as biomarkers of exposure and effect. Environ Health Perspect. 1996;104(Suppl 5):927–932. doi: 10.1289/ehp.96104s5927. [DOI] [PMC free article] [PubMed] [Google Scholar]
- 33.Center for the Evaluation of Risks of Human Reproduction. NTP-CERHR monograph on the potential human reproductive and developmental effects of bisphenol A. Research Triangle Park, NC: National Institute of Environmental Health Sciences; 2008. [Google Scholar]
- 34.Vandenberg LN, Chahoud I, Heindel JJ, Padmanabhan V, Paumgartten FJ, Schoenfelder G. Urinary, circulating, and tissue biomonitoring studies indicate widespread exposure to bisphenol A. Environ Health Perspect. 2010;118:1055–1070. doi: 10.1289/ehp.0901716. [DOI] [PMC free article] [PubMed] [Google Scholar]
- 35.Vandenberg LN, Hauser R, Marcus M, Olea N, Welshons WV. Human exposure to bisphenol A (BPA) Reprod Toxicol. 2007;24:139–177. doi: 10.1016/j.reprotox.2007.07.010. [DOI] [PubMed] [Google Scholar]
- 36.Calafat AM, Ye X, Wong LY, Reidy JA, Needham LL. Exposure of the U.S. population to bisphenol A and 4-tertiary-octylphenol: 2003–2004. Environ Health Perspect. 2008;116:39–44. doi: 10.1289/ehp.10753. [DOI] [PMC free article] [PubMed] [Google Scholar]
- 37.Cantonwine D, Meeker JD, Hu H, Sanchez BN, Lamadrid-Figueroa H, Mercado-Garcia A, et al. Bisphenol a exposure in Mexico City and risk of prematurity: a pilot nested case control study. Environ Health. 2010;9:62. doi: 10.1186/1476-069X-9-62. [DOI] [PMC free article] [PubMed] [Google Scholar]
- 38.Stahlhut RW, Welshons WV, Swan SH. Bisphenol A data in NHANES suggest longer than expected half-life, substantial nonfood exposure, or both. Environ Health Perspect. 2009;117:784–789. doi: 10.1289/ehp.0800376. [DOI] [PMC free article] [PubMed] [Google Scholar]
- 39.Ohkuma H, Abe K, Ito M, Kokado A, Kambegawa A, Maeda M. Development of a highly sensitive enzyme-linked immunosorbent assay for bisphenol A in serum. The Analyst. 2002;127:93–97. doi: 10.1039/b103515k. [DOI] [PubMed] [Google Scholar]
- 40.Snijder CA, Heederik D, Pierik FH, Hofman A, Jaddoe VW, Koch HM, et al. Fetal growth and prenatal exposure to bisphenol a: the generation R study. Environ Health Perspect. 2013;121:393–398. doi: 10.1289/ehp.1205296. [DOI] [PMC free article] [PubMed] [Google Scholar]
- 41.Wolff MS, Engel SM, Berkowitz GS, Ye X, Silva MJ, Zhu C, et al. Prenatal phenol and phthalate exposures and birth outcomes. Environ Health Perspect. 2008;116:1092–1097. doi: 10.1289/ehp.11007. [DOI] [PMC free article] [PubMed] [Google Scholar]
- 42.Maffini MV, Rubin BS, Sonnenschein C, Soto AM. Endocrine disruptors and reproductive health: the case of bisphenol-A. Mol Cell Endocrinol. 2006;254–255:179–186. doi: 10.1016/j.mce.2006.04.033. [DOI] [PubMed] [Google Scholar]
- 43.McDonnell DP, Norris JD. Connections and regulation of the human estrogen receptor. Science. 2002;296:1642–1644. doi: 10.1126/science.1071884. [DOI] [PubMed] [Google Scholar]
- 44.Richter CA, Birnbaum LS, Farabollini F, Newbold RR, Rubin BS, Talsness CE, et al. In vivo effects of bisphenol A in laboratory rodent studies. Reprod Toxicol. 2007;24:199–224. doi: 10.1016/j.reprotox.2007.06.004. [DOI] [PMC free article] [PubMed] [Google Scholar]
- 45.Elovitz MA, Mrinalini C. Animal models of preterm birth. Trends Endocrinol Metab. 2004;15:479–487. doi: 10.1016/j.tem.2004.10.009. [DOI] [PubMed] [Google Scholar]
- 46.Sawai C, Anderson K, Walser-Kuntz D. Effect of bisphenol A on murine immune function: modulation of interferon-gamma, IgG2a, and disease symptoms in NZB X NZW F1 mice. Environ Health Perspect. 2003;111:1883–1887. doi: 10.1289/ehp.6359. [DOI] [PMC free article] [PubMed] [Google Scholar]
- 47.Wang T, Li M, Chen B, Xu M, Xu Y, Huang Y, et al. Urinary bisphenol A (BPA) concentration associates with obesity and insulin resistance. J Clin Endocrinol Metab. 2012;97:E223–E227. doi: 10.1210/jc.2011-1989. [DOI] [PubMed] [Google Scholar]
- 48.Carwile JL, Michels KB. Urinary bisphenol A and obesity: NHANES 2003–2006. Environ Res. 2011;111:825–830. doi: 10.1016/j.envres.2011.05.014. [DOI] [PMC free article] [PubMed] [Google Scholar]
- 49.Wilson NK, Chuang JC, Lyu C, Menton R, Morgan MK. Aggregate exposures of nine preschool children to persistent organic pollutants at day care and at home. J Expo Anal Environ Epidemiol. 2003;13:187–202. doi: 10.1038/sj.jea.7500270. [DOI] [PubMed] [Google Scholar]
- 50.Noonan GO, Ackerman LK, Begley TH. Concentration of bisphenol A in highly consumed canned foods on the U.S. market. J Agric Food Chem. 2011;59:7178–7185. doi: 10.1021/jf201076f. [DOI] [PubMed] [Google Scholar]
- 51.Xue F, Holzman C, Rahbar MH, Trosko K, Fischer L. Maternal fish consumption, mercury levels, and risk of preterm delivery. Environ Health Perspect. 2007;115:42–47. doi: 10.1289/ehp.9329. [DOI] [PMC free article] [PubMed] [Google Scholar]
- 52.Englund-Ogge L, Brantsaeter AL, Haugen M, Sengpiel V, Khatibi A, Myhre R, et al. Association between intake of artificially sweetened and sugar-sweetened beverages and preterm delivery: a large prospective cohort study. Am J Clin Nutr. 2012;96:552–559. doi: 10.3945/ajcn.111.031567. [DOI] [PMC free article] [PubMed] [Google Scholar]
- 53.Halldorsson TI, Strom M, Petersen SB, Olsen SF. Intake of artificially sweetened soft drinks and risk of preterm delivery: a prospective cohort study in 59,334 Danish pregnant women. Am J Clin Nutr. 2010;92:626–633. doi: 10.3945/ajcn.2009.28968. [DOI] [PubMed] [Google Scholar]
- 54.Scholl TO. Iron status during pregnancy: setting the stage for mother and infant. Am J Clin Nutr. 2005;81:1218S–1222S. doi: 10.1093/ajcn/81.5.1218. [DOI] [PubMed] [Google Scholar]
- 55.Braun JM, Kalkbrenner AE, Calafat AM, Bernert JT, Ye X, Silva MJ, et al. Variability and predictors of urinary bisphenol A concentrations during pregnancy. Environ Health Perspect. 2011;119:131–137. doi: 10.1289/ehp.1002366. [DOI] [PMC free article] [PubMed] [Google Scholar]
- 56.Tomeo CA, Rich-Edwards JW, Michels KB, Berkey CS, Hunter DJ, Frazier AL, et al. Reproducibility and validity of maternal recall of pregnancy-related events. Epidemiology. 1999;10:774–777. [PubMed] [Google Scholar]
- 57.Yawn BP, Suman VJ, Jacobsen SJ. Maternal recall of distant pregnancy events. J Clin Epidemiol. 1998;51:399–405. doi: 10.1016/s0895-4356(97)00304-1. [DOI] [PubMed] [Google Scholar]
- 58.Tate AR, Dezateux C, Cole TJ, Davidson L. Factors affecting a mother's recall of her baby's birth weight. Int J Epidemiol. 2005;34:688–695. doi: 10.1093/ije/dyi029. [DOI] [PubMed] [Google Scholar]
- 59.Rappaport SM, Smith MT. Environment and Disease Risks. Science. 2010;330:460–461. doi: 10.1126/science.1192603. [DOI] [PMC free article] [PubMed] [Google Scholar]
- 60.Wild CP. Complementing the genome with an "exposome": the outstanding challenge of environmental exposure measurement in molecular epidemiology. Cancer Epidemiol Biomarkers Prev. 2005;14:1847–1850. doi: 10.1158/1055-9965.EPI-05-0456. [DOI] [PubMed] [Google Scholar]
- 61.Buck Louis GM, Sundaram R. Exposome: time for transformative research. Stat Med. 2012;31:2569–2575. doi: 10.1002/sim.5496. [DOI] [PMC free article] [PubMed] [Google Scholar]
Associated Data
This section collects any data citations, data availability statements, or supplementary materials included in this article.
Supplementary Materials
Table S1. Number of participants with factor concentrations equal or greater than the limit of detection. Hx=History.
Table S2. Association results for 201 exposures. OR=odds ratio.
Figure S1. Effect sizes and p-values for 40 lipophilic variables. A.) Adjusted OR of whole-weight measured variables versus Adjusted OR of lipid-adjusted variables. Lipid-adjusted variables are smaller in absolute value for OR > 1 and larger in absolute value for OR < 1. B.) p-value of whole-weight measured variables versus p-value of lipid-adjusted variables. P-values remain >0.05 for both types of variables.