Abstract
Imaging of the small bowel is complicated by its length and its overlapping loops. Recently, however, the development of crosssectional imaging techniques, such as computed tomography enterography (CTE) and magnetic resonance enterography (MRE) has shifted fundamental paradigms in the diagnosis and management of patients with suspected or known Crohn's disease (CD). CTE and MRE are noninvasive imaging tests that involve the use of intraluminal oral and intravenous contrast agents to evaluate the small bowel. Here, we review recent advances in each cross-sectional imaging modality, their advantages and disadvantages, and their diagnostic performances in the evaluation of small bowel lesions in CD.
Keywords: Tomography, spiral computed; Magnetic resonance imaging; Inflammatory bowel diseases; Crohn disease
INTRODUCTION
The small bowel presents a challenge for the diagnosis of diseases by both clinicians and radiologists, because of its relative inaccessibility using conventional endoscopy and because of the low diagnostic performance of conventional barium studies. Barium studies, including small bowel follow-through (SBFT) examinations and barium enteroclysis, have been used traditionally to image the small bowel for IBD. Although these fluoroscopy-based techniques are widely available and produce images with relatively high resolutions, they only assess the intraluminal mucosal pathology and are limited by lesion obscuration caused by the super-imposition of the bowel loops. However, new endoscopic developments, notably capsule endoscopy and double-balloon enteroscopy, are changing the ways in which diseases of the small bowel are diagnosed. Rapid progress has also been made in cross-sectional imaging technologies that harness the power of multi-detector row CT (MDCT) and MRI. These technologies facilitate rapid and accurate investigations of the small bowel and its adjacent tissues, and help visualize and assess the deep layers of the bowel for strictures and extraluminal complications, including fistulas and abscesses.
The advent and refinement of these cross-sectional imaging methods have led to fundamental shifts in approaches to the diagnosis and management of patients with suspected or known CD. This review introduces recent advances in each cross-sectional imaging modality, compares the advantages and disadvantages of the techniques, presents images of CD, and compares the diagnostic performances of the modalities.
CT ENTEROGRAPHY
Although CT has traditionally been used to evaluate extra-enteric complications of CD, including bowel obstructions and distensions, abscesses, and fistulas, 2 modifications of standard abdominal CT techniques appear to be especially promising in small bowel imaging. These techniques differ from standard abdominal CT because they involve the use of intraluminal bowel distension with a neutral enteric contrast medium, they use MDCT with narrow slice thicknesses and reconstruction intervals, the contrast medium is administered intravenously, and they use scan delays that optimize the enhancement of the bowel wall.
Large volumes of enteric contrast medium are required to achieve adequate luminal distension, and the contrast medium can be administered orally as during CT enterography (CTE),1,2 or it can be injected through a nasojejunal tube as during CT enteroclysis.3 Given that patients accept the peroral administration of the contrast medium more readily and that this results in acceptable levels of luminal distension,4,5 CTE is becoming the preferred diagnostic modality for disorders of the small bowel. Since Raptopoulos et al. first introduced CTE in 1997 to assess the extent and severity of CD,1 this new imaging modality has been extensively researched, and it is excellent at depicting intraluminal, intramural, and extra-enteric abnormalities of the small bowel and, subsequently, it performs well diagnostically.6,7,8,9,10,11,12,13,14
1. CT Enterography Techniques
CTE techniques involve a combination of small bowel distension with a mixture of neutral- or low-density oral contrast agents, and an abdominal CT examination during the enteric phase, following the administration of an intravenous contrast agent.
1) Small Bowel Distension
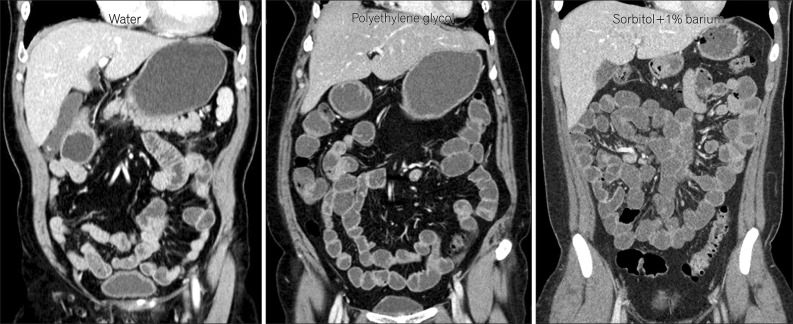
Patients are asked to drink approximately 1.35-2 L of oral contrast medium over 45-60 minutes.9,15 During the oral phase, the encouragement and supervision of patients are highly recommended because patient compliance is essential to the success of CTE. Examples of neutral oral contrast agents with CT attenuation properties that are similar to those of water include a water-methylcellulose solution, polyethylene glycol, 3% sorbitol, a low-density (0.1%) barium solution (VoLumen®, Bracco Imaging SpA, Milan, Italy), and milk (Fig. 1).10,16,17,18 Water on its own usually results in an inadequate distension due to its rapid reabsorption, although some authors advocate its use (Fig. 1).4
Fig. 1.
Coronal CT enterography images using different types of neutral enteric contrast agents. CT enterography using polyethylene glycol (middle) and sorbitol (right) distends the small bowel effectively, while CT enterography using water (left) distends the small-bowel loops suboptimally.
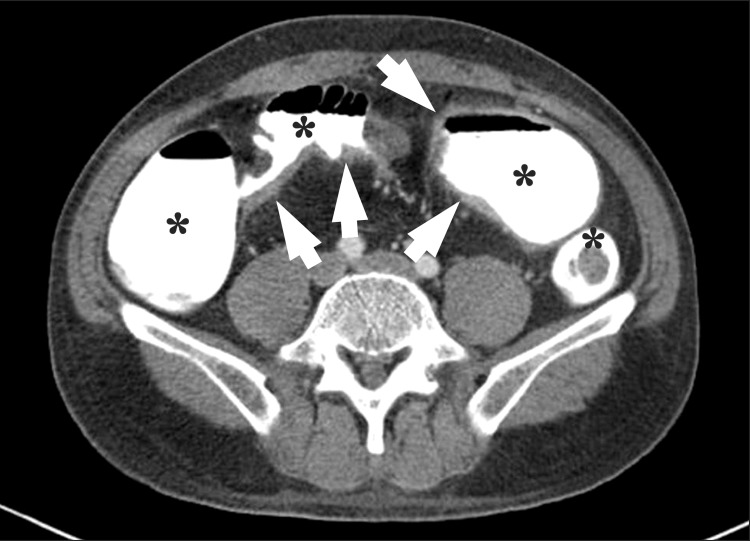
The use of a neutral enteric contrast agent rather than a positive enteric contrast agent is important to ensure that mucosal enhancement is not obscured, which is an important indicator of active CD (Fig. 2). Intravenous antiperistaltic agents, including glucagon and butylscopolamine, are not usually administered for CTE, because the acquisition of the CT images using MDCT scanners is very rapid; hence, motion artifacts attributable to bowel peristalsis are negligible.
Fig. 2.
An axial CT enterography image using diluted gastrografin as a positive enteric contrast agent. Marked bowel wall thickenings (arrows) are present at the distal ileum. However, mucosal enhancement is completely obscured by the high-attenuation intraluminal positive contrast agent (*).
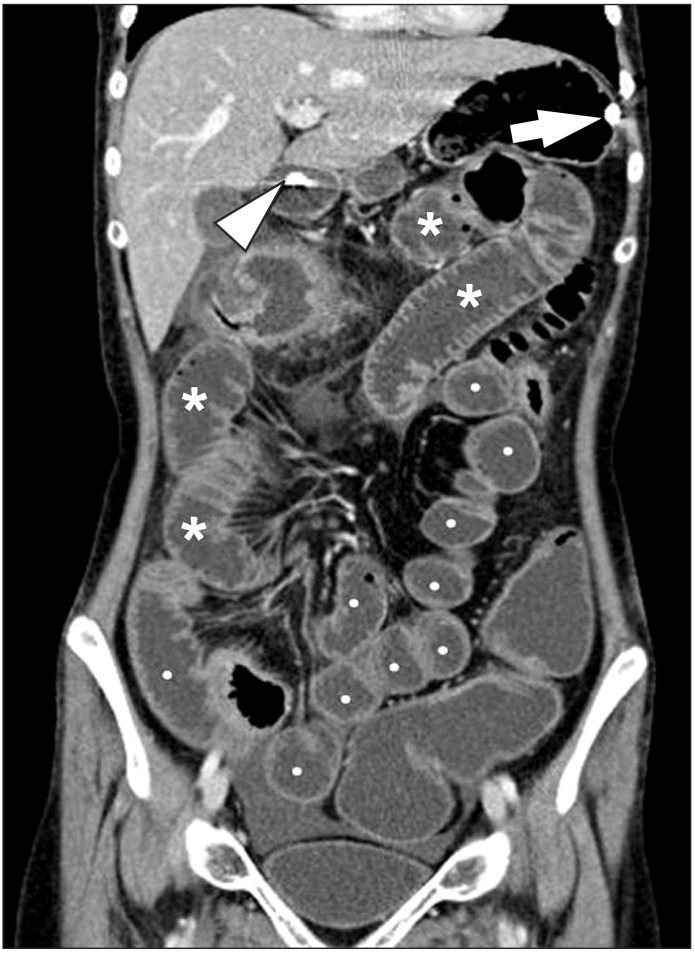
The CT enteroclysis technique is very similar to CTE, but it involves the placement of a nasojejunal balloon-tipped catheter under fluoroscopic guidance. This is followed by the delivery of a large volume of enteral contrast medium (1.5-2.0 L) through the catheter at an injection rate of 75-200 mL/min; a motorized pump is often used to ensure uniform distension (Fig. 3).3,19 Balloon inflation minimizes the reflux of the contrast medium back to the stomach.
Fig. 3.
CT enteroclysis. A coronal CT enteroclysis image with the marked and uniform distension of entire small-bowel loops, including the jejunum (*) and the ileum (•). Note the nasojejunal catheter inserted in the stomach (arrow) and the duodenum (arrowhead).
2) Intravenous Contrast Agent Administration
Low-osmolality iodinated contrast material is administered intravenously for CTE examinations, preferably using a power injector and an 18-gauge or larger peripheral catheter. At the Seoul National University Hospital in Korea, 555 mgI/kg of iodinated contrast agent, or 1.5-1.6 mL/kg of contrast medium (350-370 mgI/mL contrast agent), is administered for routine CTE examinations, with a fixed injection duration of 30 seconds.
3) CT Image Acquisition
CTE images are typically acquired from the level of the diaphragm through to the perianal region using sub-millimeter collimation to obtain an isotropic volumetric data set, thereby creating two-dimensional (2D) multiplanar reformatted (MPR) images and 3D reconstructions (Fig. 4). From the thin section data, thicker reconstructed 2.5-5 mm axial images, often with a 1.25-2.5 mm section overlap, also can be generated for the primary review. The sub-millimeter axial source images are available for problem-solving purposes and to create additional reformation or reconstruction images, as required.9 Dual-phase CTE images are usually obtained during the enteric phase, which is approximately 40 seconds after the start of the injection of the contrast medium, and during the portal venous phase, which is approximately 70-80 seconds after the start of the injection of the contrast medium,4 although some authors claim that singlephase enteric- or portal venous phase CTE yields satisfactory results in children and adults, while minimizing exposure to radiation.20
Fig. 4.

Three-dimensional reconstruction CT images of the small bowel. (A) Sagittal multiplanar reconstruction CT images demonstrate wall thickening with luminal narrowing (arrows) with fibrofatty proliferation (*) in the descending colon of a patient with CD. (B) Arterial phase, maximum intensity projection images in different patients depict the marked engorgement of the mesenteric vessels (comb sign) (*) supplying the involved bowel segment. (C) A transparent volume-rendering CT enteroclysis image using air as a negative contrast agent clearly demonstrates longitudinal ulceration and shortening (arrows) on the mesenteric border of the ileum, and pseudosacculation (arrowheads) on the anti-mesenteric border. (D) A virtual enteroscopy image from the same patient also shows longitudinal ulceration and a fold deformity (arrows) in the ileum.
Although CTE is established as a key imaging modality for the diagnosis of IBD and for monitoring treatment outcomes, concern about the radiation risk associated with CT is increasing, because many individuals with these diseases are vulnerable owing to their young ages.9 Therefore, radiologists should be familiar with the approaches that are available to help to minimize the radiation doses as much as possible. Automated dose modulation is essential. A recent study found that low-dose MDCT examinations using lower tube currents (mAs) or lower voltages (kVp), either alone or in combination, allowed for substantial reductions in radiation doses during CT examinations for CD without compromising the diagnostic information.21 Aggressive dose lowering, however, is often affected by the undesirable consequences of excessive image noise, which degrades image quality and therefore, diagnostic performance.
Among the strategies available to overcome these short-comings associated with radiation dose reductions are new CT reconstruction algorithms that are based on iterative approaches, including Adaptive Statistical Iterative Reconstruction (GE Healthcare, Waukesha, WI, USA), Iterative Reconstruction in Image Space (Siemens, Erlangen, Germany), iDose (Philips Healthcare, Cleveland, OH, USA), Adaptive Iterative Dose Reduction (Toshiba Medical Systems Corporation, Tochigi, Japan), and Model-Based Iterative Reconstruction, VEO® (GE Healthcare, Waukesha, WI, USA).
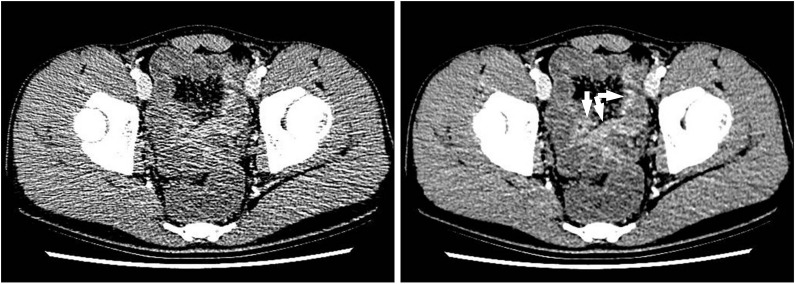
These reconstruction algorithms reduce noise by iteratively comparing the acquired filtered back projection-reconstructed images with a modeled projection.22,23 They repeat successive iterative steps that transform the measured value of each pixel to a new estimate of the pixel value and compare this with the ideal value that the noise model predicts until the final estimated and ideal pixel values converge.22,23 Several investigators have evaluated the feasibility and usefulness of such iterative reconstruction algorithms for patients with IBD who have undergone low-dose CTE examinations using low kVp or mAs.21,24,25,26 These investigators found that CTE with iterative reconstructions produces diagnostically acceptable images that are of similar quality to those produced using standard-dose CTE, while reducing the radiation dose by 35-72% (Fig. 5).21,24,25,26
Fig. 5.
Low-dose CT enterography images obtained using 100 kVp and 150 mAs in a 17-year-old boy with suspected CD. (A) An enteric phase CT image reconstructed using the conventional filtered back projection algorithm, had suboptimal image quality at the pelvic cavity because of severe noise. (B) However, the CT image reconstructed using an iterative reconstruction algorithm demonstrates a dramatic reduction in image noise, and shows multifocal enhancing wall thickening (arrows) in the distal ileum. The patient was diagnosed with CD on the basis of colonoscopic biopsy.
MAGNETIC RESONANCE ENTEROGRAPHY
Historically, MRI of the small bowel had been limited by long acquisition times and extensive motion artifacts caused by respiration and bowel peristalsis. Several recent technical advances in MRI, including the use of high-field strength MR scanners and phased array multichannel coils; the development of fast acquisition MRI pulse sequences, including parallel acquisition techniques; and the introduction of various oral contrast agents, mean that motion-free and high-resolution MR images of the small bowel can be achieved, which has made MRI of the small bowel more clinically feasible. 14,27,28,29,30 Consequently, MR enterography (MRE) has also become a first-line imaging modality of choice for evaluating children or young patients with CD, in accordance with the American College of Radiology's Appropriateness Criteria®, particularly when known CD is being evaluated or when perianal involvement of the disease is being investigated.31
1. MRI Techniques
1) Small Bowel Distension
The importance of achieving an adequate distension of the small bowel for MRI is the same as that for CTE. Like CT, the enteric contrast medium can be administered either orally (for MRE) or via a nasojejunal tube (for MR enteroclysis). Several enteric contrast agents have been used for MRI as investigators strive to achieve uniform luminal distension with minimal intestinal absorption. MRI enteric contrast agents tend to be classified according to their signal intensities on T1- and T2-weighted images, and they are categorized as positive, negative, and biphasic agents.
Positive agents, including pineapple juice and blueberry juice, demonstrate high signal intensities on both T1- and T2-weighted images. Negative agents such as oral superparamagnetic iron oxide particles demonstrate low signal intensities on both T1- and T2-weighted images. Biphasic agents, for example, water, polyethylene glycol, methylcellulose, and dilute barium with sorbitol, demonstrate low signal intensities on T1-weighted images and high signal intensities on T2-weighted images.32 Biphasic contrast agents typically include non-absorbable, high-osmolality additives such as mannitol, polyethylene glycol, and sorbitol to minimize water absorption by the bowel. The theoretical benefits of low luminal signal intensities on T2-weighted images using a negative contrast agent include the better visualization of bowel wall edema and mucosal enhancement, as well as discrimination between intraluminal and extraluminal fluids, while positive luminal signal intensities that are associated with positive or biphasic agents are often favored for detecting bowel wall thickening.
Other important factors, including patient acceptability and the costs of suitable enteric contrast agents, have led to biphasic agents becoming the predominant oral contrast agents used for small-bowel MRI examinations. The administration of the contrast agents and the preparation of patients for the oral phase of MRE are the same as for CTE.
2) MRI Acquisition
The long acquisition time associated with MRE necessitates the use of antiperistaltic medications such as intravenous butyl scopolamine (Buscopan®) or glucagon to reduce bowel peristalsis and improve image quality. At the Seoul National University Hospital, Buscopan® is administered immediately before postcontrast imaging in accordance with a weight-based algorithm.
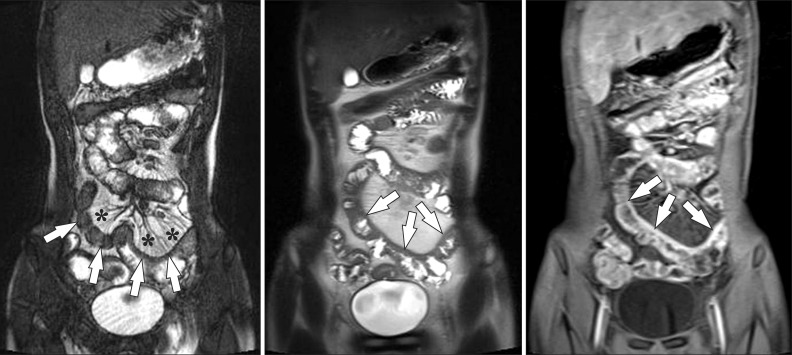
MRI of the bowel relies predominantly on three sequences.27 The first is a single-shot fast spin-echo, or SSFSE, T2 sequence with a half-Fourier acquisition single-shot turbo spin-echo, or HASTE, that generates motion-free T2-weighted images to enable the evaluation of bowel wall edema and collections of extraluminal fluid (Fig. 6). The second sequence is a balanced steady-state free precession form of imaging, which includes true fast imaging with steady-state precession, or TrueFISP, and fast imaging employing steady-state acquisition, or FIESTA, and is exquisitely sensitive at detecting mesenteric changes, including hypervascularity, that is, comb sign, fibrofatty proliferation, and fistulas (Fig. 6). The third sequence is a dynamic fast 3D spoiled gradient echo T1 fat-suppressed post-contrast sequence that evaluates the pattern of bowel wall enhancement (Fig. 6), and includes volume interpolated breath-hold examination, or VIBE, and liver acquisition with volume acceleration, or LAVA. In addition to these 3 sequences, diffusion-weighted imaging (DWI) is gaining acceptance in abdominal MRI, because it assists in the identification of bowel segments affected by IBD (Fig. 7), and in the detection of lymph nodes, intra-abdominal and perianal abscesses, and penetrating complications.33,34,35
Fig. 6.
A 15-year-old boy with CD and elevated inflammatory markers. (A-C) Magnetic resonance enterography images using (A) true fast imaging with steady-state precession (TrueFISP) (B) half-Fourier acquisition single-shot turbo spin-echo (HASTE), and (C) postcontrast T1-weighted 3-dimensional spoiled gradient recalled (SPGR) fat-saturated sequences show marked and asymmetric ileal wall thickening (arrows). Note the marked engorgement of the adjacent mesenteric vessels (comb sign) (*) on the TrueFISP sequence (A) and marked enhancement on the postcontrast T1-weighted sequence (C), indicating active inflammation.
Fig. 7.
A 15-year-old boy with CD. (A) Axial half-Fourier acquisition single-shot turbo spin-echo (HASTE) and (B) postcontrast T1-weighted magnetic resonance enterography images show marked distal ileal circumferential wall thickening with strong transmural hyperenhancement (arrowheads), consistent with active inflammation. (C) Axial diffusion-weighted image demonstrates the high signal intensity (arrowheads) associated with the involved ileum, suggesting the restricted diffusion of water within the distal ileum because of active inflammation.
ADVANTAGES AND DISADVANTAGES OF CTE AND MRE
CTE and MRE have advantages and disadvantages. Compared with MRE, the advantages of CTE include shorter examination times; less susceptibility to motion artifacts, including bowel peristalsis; superior spatial resolution; less need for sedation or general anesthesia; wide availability; greater radiologist confidence and interpretation experience; lower cost; and greater safety in patients with pacemakers or implanted devices sensitive to MRI.9
The primary disadvantage of CTE compared with MRE is its use of ionizing radiation. Many IBD patients require repetitive imaging sessions to assess disease activity and known or suspected complications. Children with IBD are likely to be more susceptible to the potentially harmful effects of ionizing radiation than adult patients with IBD, because they have more time for the manifestation of adverse effects and they have a considerably larger number of dividing cells in the body.
However, the newly developed CT iterative reconstruction algorithms are making CT examinations possible at significantly reduced radiation doses in adults and children.21,24,25,26 While it is reasonable to limit repeated CT imaging in pediatric IBD patients and to use MRE for follow-up imaging, when possible, it is conceivable that the use of CTE will increase in the near future because the estimated effective doses routinely approach <1-2 mSv, while maintaining the quality of the images.9
The greatest advantage of MRE compared with CTE is the absence of ionizing radiation, which enables dynamic postcontrast imaging, the assessment of areas of luminal narrowing over extended periods of time to confirm the presence of strictures, and repeat imaging if a series is of limited diagnostic quality. Other advantages include superior soft tissue contrast resolution, the availability of cine-imaging techniques, the availability of qualitative and quantitative techniques, such as DWI, and a lower frequency of adverse reactions to the intravenous contrast materials.9 Although MRE has several advantages over CTE, it also has its disadvantages, including an inferior spatial resolution of 4-6 mm compared with CT that has a spatial resolution of 2-3 mm, longer acquisition times of 30-60 minutes versus a single breath-hold for CT, and greater numbers of artifacts associated with peristalsis and bowel gases. In addition, access to MRI may be more difficult than access to CT in clinical practice, and the former is more expensive.9
IMAGING FINDINGS OF CD ON CTE AND MRE
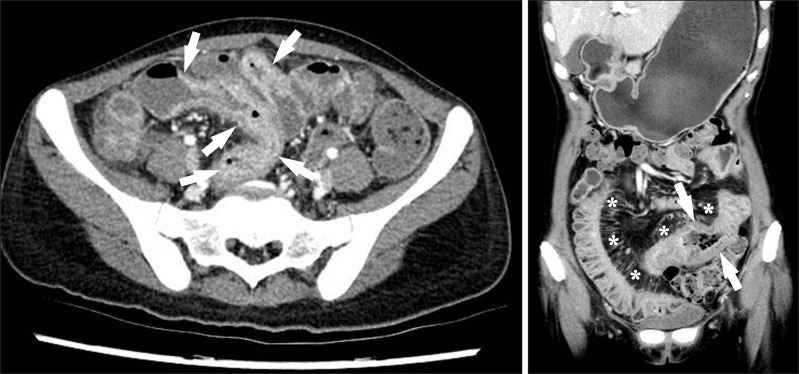
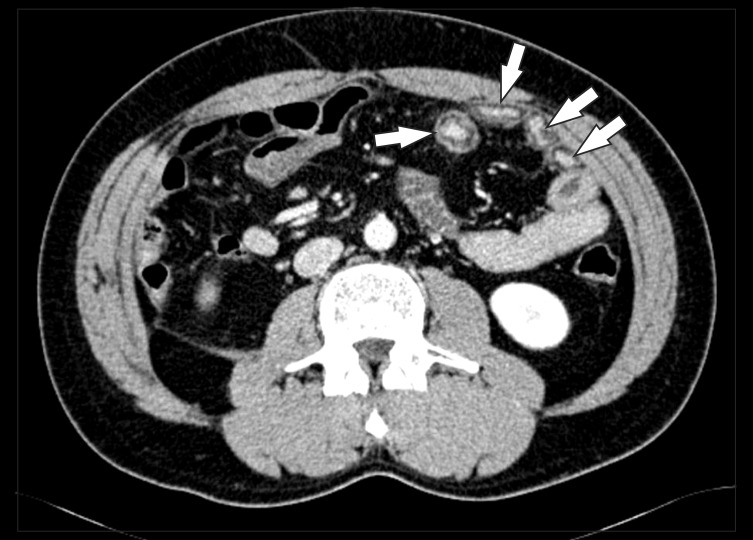
In CD, the small bowel is the most commonly involved site in the gastrointestinal tract. In approximately 80% of patients, CD involves the small bowel, with (50%) or without (30%) involvement of the colon. Bowel wall thickening, mural hyperenhancement, mural stratification, the comb sign caused by the engorged vasa recta, and perienteric fat of greater density are among the findings that characterize active CD on CT images (Fig. 8).11 Chronic changes associated with CD include fibrotic strictures and submucosal fatty depositions in the bowel wall (Fig. 9).11 Mural hyperenhancement is thought to correlate with disease activity, although it leads to more false-positive results and lower interobserver agreement compared with bowel wall thickening.12 Mural stratification, caused by intramural edema, is more indicative of active disease compared with a homogeneously enhancing wall.
Fig. 8.
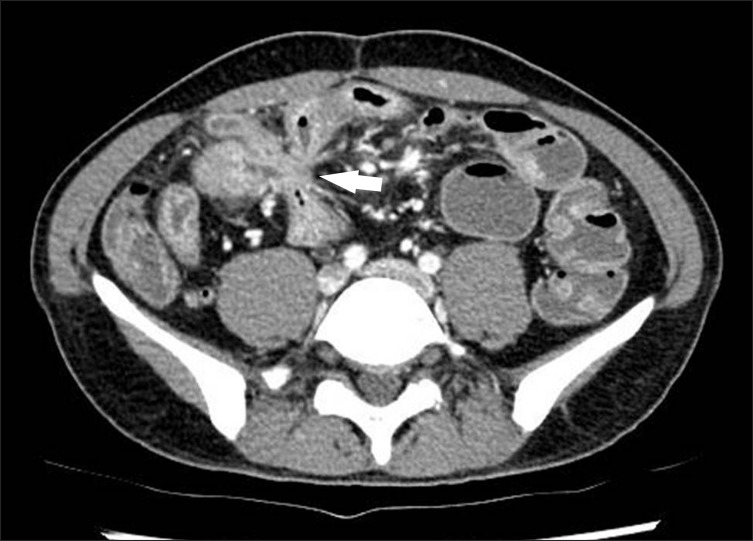
CT findings of active inflammation in CD. (A) An axial CT image shows bowel wall thickening (arrows) with bilaminar mural stratification and mucosal hyperenhancement. (B) A coronal CT image of a different patient demonstrates trilaminar mural stratification (arrows) with mucosal and serosal hyperenhancement. Note the dilated vasa recta (*) or comb sign in the mesentery, A B indicating active disease.
Fig. 9.
Chronic CD with submucosal fat deposits (arrows) in several small bowel loops.
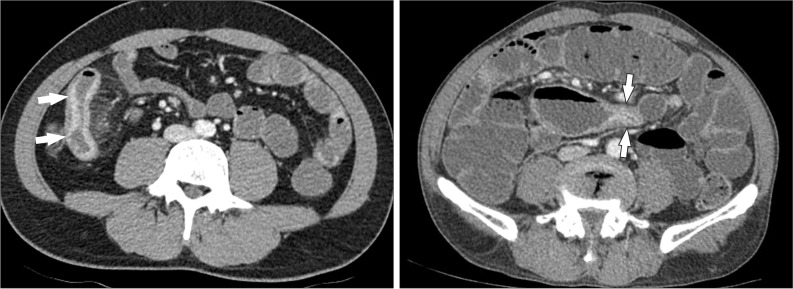
In addition, radiologists should advise clinicians about whether luminal narrowing is reversible and caused by edema or spasms characteristic of the active inflammatory phase, or fixed and caused by fibrosis that is characteristic of the chronic phase, because treatment of fibrotic strictures involves surgical excision or dilatation, whereas inflammatory spasms can be treated medically (Fig. 10).11,36 During the acute inflammatory stage, the bowel wall can demonstrate mural stratification caused by edema, while strictures caused by fibrostenosing scar tissue may show homogeneous low attenuations in the involved segment (Fig. 10).11 Bowel obstructions caused by fibrotic strictures elevate the intraluminal pressure, which can lead to fissures (fistulas or transmural inflammation) in the fibrotic and scarred walls (Fig. 11).
Fig. 10.
Reversible and irreversible strictures in CD. (A) A reversible stricture. The axial CT image demonstrates the narrowing of the bowel lumen caused by bowel wall edema with mural hyperenhancement and mural stratification (arrows), indicating that the stricture is not yet fibrotic. (B) An irreversible stricture. The axial CT image shows an abrupt luminal narrowing of the jejunum (arrows) with homogeneous and weak enhancement. The patient underwent jejunal segmental resection, and final histopathology confirmed chronic fibrotic strictures associated with CD (not shown).
Fig. 11.
A 38-year-old man with CD. The axial CT image clearly depicts an enteroenteric fistula (arrow) in the right lower quadrant area.
The term "comb sign" refers to the engorged vasa recta, and while it is not a sensitive sign, it is a sign that is specific for clinically advanced, active, and extensive CD (Fig. 8). Furthermore, its presence is associated with higher CRPlevels, more frequent hospital admissions, and more intensive medication regimens than the presence of normal vasculature in CD.11
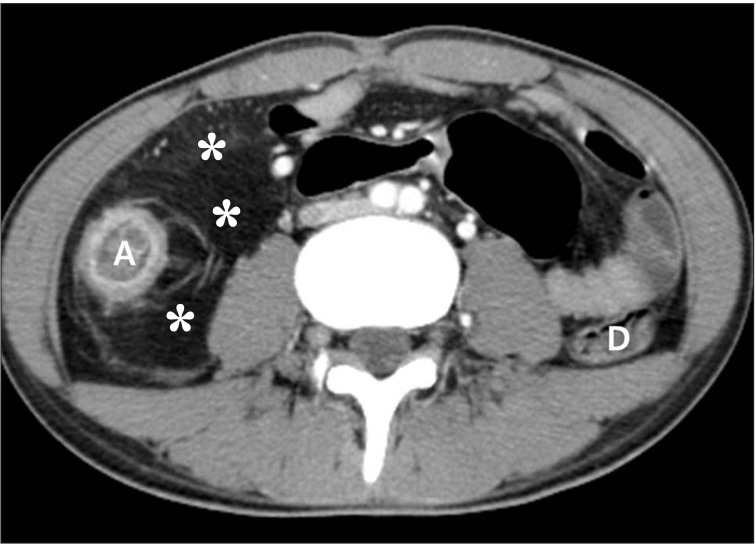
Fibrofatty proliferation refers to fatty depositions along the mesenteric borders of the bowel segments affected by CD (Fig. 12). While it is associated with transmural inflammation, it is not specifically associated with disease activity, because it can be present in both active and chronic CD (Fig. 12). Unlike fibrofatty proliferation, an increase in the fat density, that is, perienteric fat infiltration, is highly specific to disease activity. An increased fat density refers to the density of fluid in the perienteric fat resulting from the inflammatory infiltration of the perienteric adipose tissue. Therefore, the presence of an increased fat density surrounding a thickened or abnormally enhancing bowel is a reliable sign of active mucosal disease. In fact, the presence of increased fat density correlates with the histologic severity of CD and elevated serum CRP levels.11
Fig. 12.
Fibrofatty proliferation in a 26-year-old man with active CD. The axial CT image shows a marked proliferation of fat (*) at the medial aspect of the inflamed ascending colon (A). Note the paucity of fat around the normal descending colon (D).
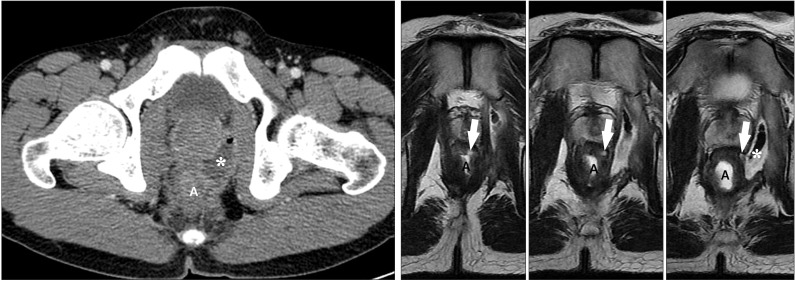
One population-based study of CD patients found that the cumulative risk for developing a fistula was 33% after 10 years and 50% after 20 years.37 The most common type of fistula in CD is a perianal fistula (Fig. 13). Unlike other types of fistula commonly seen in CD, including enteroenteric, enterocolic, or colocolic fistulas, perianal fistulas are often present in the absence of anal or rectal inflammation. In a recent study of 36 patients with surgical correlations, CTE correctly determined the presence or absence of fistulas in 94% of patients with an accuracy of 86% for the number of fistulas.13 Another study of 38 patients using CT with a positive oral contrast medium had a slightly lower accuracy rate of 77% for the detection of fistulas.38 Although CTE is typically performed with a neutral oral contrast medium, if fistulas are the primary indication, a switch to a positive oral contrast medium can be considered to opacify any fistula tracts. MRI is considered to be a better imaging modality for depicting perianal complications owing to its high soft tissue contrast (Fig. 13).
Fig. 13.
An anal fistula and perianal abscess in a 27-year-old man with CD. (A) An axial CT image shows a large perianal abscess (*) just next to the anus (a). However, the anal fistula itself is not apparent on the CT image. (B) In contrast, serial T2-weighted magnetic resonance images clearly depict an anal fistula itself (arrows), which connects the anal lumen (a) and perianal abscess (*).
The MRI characteristics of active bowel inflammation in CD include bowel wall thickening, bowel wall hyperintensity on T2-weighted images, and hyperenhancement on contrast-enhanced T1-weighted images (Fig. 6 and 7).39 A layered pattern of bowel wall enhancement consisting of brightly enhancing mucosa, caused by inflammation, and hypoenhancing submucosa, caused by edema, specifically characterizes active bowel inflammation (Fig. 7).39 Mesenteric features associated with IBD include lymphadenopathy, an engorged vasa recta or comb sign, fibrofatty infiltration, fistulas, and abscesses (Fig. 6). In addition to detecting involved bowel segments, MRI is also important for differentiating between active inflammation and chronic fibrosis within the involved segments. MRI findings associated with chronic mural fibrosis include bowel wall T2 hypointensity and an absence of bowel wall enhancement.40,41
DIAGNOSTIC PERFORMANCES OF CTE AND MRE
Several studies have demonstrated the superior performance of CTE compared with SBFT. In a study of 23 CD patients by Wold et al., the sensitivity and specificity of CTE were 78% and 83%, respectively, while the sensitivity and specificity of SBFT were 62% and 90%, respectively. Although there was no statistically significant difference, CTE was more sensitive than SBFT in the detection of abscesses and fistulas.4 Varying results have emerged from studies comparing CTE with capsule endoscopy, which may relate to the study designs. In a study by Hara et al. of 17 patients with CD, the diagnostic yield was the highest with capsule endoscopy at 71%, compared with ileoscopy at 65%, CTE at 53%, and SBFT at 24%.6 A prospective blinded comparison of the same tests in 41 patients using a clinical consensus gold standard as opposed to the diagnostic yield, found that while capsule endoscopy and CTE had similar sensitivities, at 82-83%, for detecting active CD within the small bowel, CTE had a far greater specificity at 89% compared with 53% for capsule endoscopy.42
A prospective study involving 40 patients with histologically proven IBD assigned to undergo either MRE or MR enteroclysis showed that MR enteroclysis was superior to MRE at achieving bowel distension and at detecting mucosal abnormalities in the bowel.43 However, the 2 techniques were comparable with regard to the detection of luminal narrowing, mesenteric abnormalities, and fistulas.43 Very few studies have directly compared capsule endoscopy with MRI for the evaluation of small bowel diseases. One study that compared capsule endoscopy with MR enteroclysis in 17 patients with suspected or known CD, showed that while capsule endoscopy depicted a higher number of inflammatory lesions in the jejunum and the proximal ileum compared with MR enteroclysis, the two modalities detected similar numbers of inflammatory lesions in the terminal ileum.44
Several studies have compared the use of CTE and MRE. These studies have shown that the two imaging modalities have similar sensitivities in diagnosing CD, but that CTE generates better quality images.10,14,28,29,30,45,46,47 According to Lee et al., CTE and MRE showed the same levels of accuracy in identifying active CD of the small bowel, with sensitivities of 89% and 83%, respectively, and specificities of 80% and 100%, respectively. Furthermore, the sensitivities of CTE and MRE at detecting extra-enteric complications were significantly higher at 100% compared with those of SBFT, which were 32-37%.10 Prospective comparisons of CTE and MRE by Siddiki et al. also showed similar sensitivities of 95.2% and 90.5%, respectively, in the detection of active CD within the small bowel.14 However, studies comparing CT and MRI have shown the superiority of MRI in detecting fistulas and strictures.28,45,48,49
CONCLUSIONS
CD within the small bowel can be effectively and efficiently evaluated using CTE and MRE. These imaging modalities detect the complications of CD with greater accuracy than conventional barium studies, and they are sometimes better at detecting the involvement of the small bowel. The optimal distension of the entire small bowel is obligatory, and this can be achieved if patients continually drink a neutral oral contrast agent within 45-60 minutes of the examination beginning. Given the comparable performances of CTE and MRE in the diagnosis of CD and in the evaluation of disease activity, determining which modality is best suited for imaging patients with CD depends on the clinical scenario, and this remains surrounded by controversy.47
CTE is the preferred modality for the initial diagnosis of CD, because of its superior spatial resolution and its ability to delineate areas of bowel involvement. Furthermore, contrast-enhanced CT is the mainstay imaging modality for patients with known CD and new acute manifestations of fever, leukocytosis, or peritoneal signs. This recommendation is based on the rapid CT acquisition time and its superior ability to detect intraperitoneal free air.47 However, technical improvements in MRI, including faster gradients and improvements in the receiver coils will enhance its robustness and facilitate the greater use of MRE, particularly in younger patients and those patients undergoing serial and repeated imaging studies for known CD and symptomatic, but not acute, recurrences, because it is radiation free.15 Since many CD patients are young and tend to undergo repeated CT imaging because of the chronic and remitting nature of their disease, minimizing the dose of radiation during CTE is important. Therefore, radiologists should be familiar with the approaches that reduce radiation doses, including limiting the number of CT phases, for example, by only using the enteric phase for follow-up imaging, providing adequate shielding of uninvolved organ parts, using automated dose modulation, and using low-dose CT techniques through the application of iterative reconstructions.
Finally, we should bear in mind that signs on CTE and MRE images that indicate active inflammation caused by Crohn's enteritis are bowel wall thickening, mural stratification, mucosal hyperenhancement, the presence of comb sign, and an increase in perienteric fat density.
Footnotes
Financial support: This research was supported by the Basic Science Research Program through the National Research Foundation of Korea (NRF) funded by the Ministry of Science, ICT & Future Planning (2013R1A1A3005937).
Conflict of interest: None.
References
- 1.Raptopoulos V, Schwartz RK, McNicholas MM, Movson J, Pearlman J, Joffe N. Multiplanar helical CT enterography in patients with Crohn's disease. AJR Am J Roentgenol. 1997;169:1545–1550. doi: 10.2214/ajr.169.6.9393162. [DOI] [PubMed] [Google Scholar]
- 2.Paulsen SR, Huprich JE, Fletcher JG, et al. CT enterography as a diagnostic tool in evaluating small bowel disorders: review of clinical experience with over 700 cases. Radiographics. 2006;26:641–657. doi: 10.1148/rg.263055162. [DOI] [PubMed] [Google Scholar]
- 3.Maglinte DD, Sandrasegaran K, Lappas JC. CT enteroclysis: techniques and applications. Radiol Clin North Am. 2007;45:289–301. doi: 10.1016/j.rcl.2007.03.008. [DOI] [PubMed] [Google Scholar]
- 4.Wold PB, Fletcher JG, Johnson CD, Sandborn WJ. Assessment of small bowel Crohn disease: noninvasive peroral CT enterography compared with other imaging methods and endoscopy--feasibility study. Radiology. 2003;229:275–281. doi: 10.1148/radiol.2291020877. [DOI] [PubMed] [Google Scholar]
- 5.Negaard A, Sandvik L, Berstad AE, et al. MRI of the small bowel with oral contrast or nasojejunal intubation in Crohn's disease: randomized comparison of patient acceptance. Scand J Gastroenterol. 2008;43:44–51. doi: 10.1080/00365520701494813. [DOI] [PubMed] [Google Scholar]
- 6.Hara AK, Leighton JA, Heigh RI, et al. Crohn disease of the small bowel: preliminary comparison among CT enterography, capsule endoscopy, small-bowel follow-through, and ileoscopy. Radiology. 2006;238:128–134. doi: 10.1148/radiol.2381050296. [DOI] [PubMed] [Google Scholar]
- 7.Huprich JE, Fletcher JG, Alexander JA, Fidler JL, Burton SS, Mc-Cullough CH. Obscure gastrointestinal bleeding: evaluation with 64-section multiphase CT enterography--initial experience. Radiology. 2008;246:562–571. doi: 10.1148/radiol.2462061920. [DOI] [PubMed] [Google Scholar]
- 8.Hakim FA, Alexander JA, Huprich JE, Grover M, Enders FT. CT-enterography may identify small bowel tumors not detected by capsule endoscopy: eight years experience at Mayo Clinic Rochester. Dig Dis Sci. 2011;56:2914–2919. doi: 10.1007/s10620-011-1773-0. [DOI] [PubMed] [Google Scholar]
- 9.Hammer MR, Podberesky DJ, Dillman JR. Multidetector computed tomographic and magnetic resonance enterography in children: state of the art. Radiol Clin North Am. 2013;51:615–636. doi: 10.1016/j.rcl.2013.04.001. [DOI] [PubMed] [Google Scholar]
- 10.Lee SS, Kim AY, Yang SK, et al. Crohn disease of the small bowel: comparison of CT enterography, MR enterography, and small-bowel follow-through as diagnostic techniques. Radiology. 2009;251:751–761. doi: 10.1148/radiol.2513081184. [DOI] [PubMed] [Google Scholar]
- 11.Hara AK, Swartz PG. CT enterography of Crohn's disease. Abdom Imaging. 2009;34:289–295. doi: 10.1007/s00261-008-9443-1. [DOI] [PubMed] [Google Scholar]
- 12.Bodily KD, Fletcher JG, Solem CA, et al. Crohn Disease: mural attenuation and thickness at contrast-enhanced CT Enterography--correlation with endoscopic and histologic findings of inflammation. Radiology. 2006;238:505–516. doi: 10.1148/radiol.2382041159. [DOI] [PubMed] [Google Scholar]
- 13.Vogel J, da Luz Moreira A, Baker M, et al. CT enterography for Crohn disease: accurate preoperative diagnostic imaging. Dis Colon Rectum. 2007;50:1761–1769. doi: 10.1007/s10350-007-9005-6. [DOI] [PubMed] [Google Scholar]
- 14.Siddiki HA, Fidler JL, Fletcher JG, et al. Prospective comparison of state-of-the-art MR enterography and CT enterography in small-bowel Crohn's disease. AJR Am J Roentgenol. 2009;193:113–121. doi: 10.2214/AJR.08.2027. [DOI] [PubMed] [Google Scholar]
- 15.Fletcher JG. CT enterography technique: theme and variations. Abdom Imaging. 2009;34:283–288. doi: 10.1007/s00261-008-9411-9. [DOI] [PubMed] [Google Scholar]
- 16.Minordi LM, Vecchioli A, Mirk P, Bonomo L. CT enterography with polyethylene glycol solution vs CT enteroclysis in small bowel disease. Br J Radiol. 2011;84:112–119. doi: 10.1259/bjr/71649888. [DOI] [PMC free article] [PubMed] [Google Scholar]
- 17.Berther R, Patak MA, Eckhardt B, Erturk SM, Zollikofer CL. Comparison of neutral oral contrast versus positive oral contrast medium in abdominal multidetector CT. Eur Radiol. 2008;18:1902–1909. doi: 10.1007/s00330-008-0958-1. [DOI] [PubMed] [Google Scholar]
- 18.Megibow AJ, Babb JS, Hecht EM, et al. Evaluation of bowel distention and bowel wall appearance by using neutral oral contrast agent for multi-detector row CT. Radiology. 2006;238:87–95. doi: 10.1148/radiol.2381041985. [DOI] [PubMed] [Google Scholar]
- 19.Maglinte DD, Sandrasegaran K, Lappas JC, Chiorean M. CT Enteroclysis. Radiology. 2007;245:661–671. doi: 10.1148/radiol.2453060798. [DOI] [PubMed] [Google Scholar]
- 20.Vandenbroucke F, Mortele KJ, Tatli S, et al. Noninvasive multidetector computed tomography enterography in patients with small-bowel Crohn's disease: is a 40-second delay better than 70 seconds? Acta Radiol. 2007;48:1052–1060. doi: 10.1080/02841850701589290. [DOI] [PubMed] [Google Scholar]
- 21.Kambadakone AR, Prakash P, Hahn PF, Sahani DV. Low-dose CT examinations in Crohn's disease: impact on image quality, diagnostic performance, and radiation dose. AJR Am J Roentgenol. 2010;195:78–88. doi: 10.2214/AJR.09.3420. [DOI] [PubMed] [Google Scholar]
- 22.Hara AK, Paden RG, Silva AC, Kujak JL, Lawder HJ, Pavlicek W. Iterative reconstruction technique for reducing body radiation dose at CT: feasibility study. AJR Am J Roentgenol. 2009;193:764–771. doi: 10.2214/AJR.09.2397. [DOI] [PubMed] [Google Scholar]
- 23.Ghetti C, Ortenzia O, Serreli G. CT iterative reconstruction in image space: a phantom study. Phys Med. 2012;28:161–165. doi: 10.1016/j.ejmp.2011.03.003. [DOI] [PubMed] [Google Scholar]
- 24.Lee SJ, Park SH, Kim AY, et al. A prospective comparison of standard-dose CT enterography and 50% reduced-dose CT enterography with and without noise reduction for evaluating Crohn disease. AJR Am J Roentgenol. 2011;197:50–57. doi: 10.2214/AJR.11.6582. [DOI] [PubMed] [Google Scholar]
- 25.Craig O, O'Neill S, O'Neill F, et al. Diagnostic accuracy of computed tomography using lower doses of radiation for patients with Crohn's disease. Clin Gastroenterol Hepatol. 2012;10:886–892. doi: 10.1016/j.cgh.2012.03.014. [DOI] [PubMed] [Google Scholar]
- 26.Kaza RK, Platt JF, Al-Hawary MM, Wasnik A, Liu PS, Pandya A. CT enterography at 80 kVp with adaptive statistical iterative reconstruction versus at 120 kVp with standard reconstruction: image quality, diagnostic adequacy, and dose reduction. AJR Am J Roentgenol. 2012;198:1084–1092. doi: 10.2214/AJR.11.6597. [DOI] [PubMed] [Google Scholar]
- 27.Gee MS, Harisinghani MG. MRI in patients with inflammatory bowel disease. J Magn Reson Imaging. 2011;33:527–534. doi: 10.1002/jmri.22504. [DOI] [PMC free article] [PubMed] [Google Scholar]
- 28.Ippolito D, Invernizzi F, Galimberti S, Panelli MR, Sironi S. MR enterography with polyethylene glycol as oral contrast medium in the follow-up of patients with Crohn disease: comparison with CT enterography. Abdom Imaging. 2010;35:563–570. doi: 10.1007/s00261-009-9557-0. [DOI] [PubMed] [Google Scholar]
- 29.Jensen MD, Kjeldsen J, Rafaelsen SR, Nathan T. Diagnostic accuracies of MR enterography and CT enterography in symptomatic Crohn's disease. Scand J Gastroenterol. 2011;46:1449–1457. doi: 10.3109/00365521.2011.613947. [DOI] [PubMed] [Google Scholar]
- 30.Gee MS, Nimkin K, Hsu M, et al. Prospective evaluation of MR enterography as the primary imaging modality for pediatric Crohn disease assessment. AJR Am J Roentgenol. 2011;197:224–231. doi: 10.2214/AJR.10.5970. [DOI] [PMC free article] [PubMed] [Google Scholar]
- 31.Expert Panel on Gastrointestinal Imaging. American College of Radiology ACR Appropriateness Criteria®: Crohn disease. 2011. pp. 1–17. Available from: http://www.acr.org/~/media/ACR/Documents/AppCriteria/Diagnostic/CrohnDisease.pdf.
- 32.Fidler JL, Guimaraes L, Einstein DM. MR imaging of the small bowel. Radiographics. 2009;29:1811–1825. doi: 10.1148/rg.296095507. [DOI] [PubMed] [Google Scholar]
- 33.Oto A, Zhu F, Kulkarni K, Karczmar GS, Turner JR, Rubin D. Evaluation of diffusion-weighted MR imaging for detection of bowel inflammation in patients with Crohn's disease. Acad Radiol. 2009;16:597–603. doi: 10.1016/j.acra.2008.11.009. [DOI] [PMC free article] [PubMed] [Google Scholar]
- 34.Oto A, Kayhan A, Williams JT, et al. Active Crohn's disease in the small bowel: evaluation by diffusion weighted imaging and quantitative dynamic contrast enhanced MR imaging. J Magn Reson Imaging. 2011;33:615–624. doi: 10.1002/jmri.22435. [DOI] [PubMed] [Google Scholar]
- 35.Yacoub JH, Oto A. New magnetic resonance imaging modalities for Crohn disease. Magn Reson Imaging Clin N Am. 2014;22:35–50. doi: 10.1016/j.mric.2013.07.005. [DOI] [PubMed] [Google Scholar]
- 36.Ye BD, Yang SK, Shin SJ, et al. Guidelines for the management of Crohn's disease. Intest Res. 2012;10:26–66. [Google Scholar]
- 37.Schwartz DA, Loftus EV, Jr, Tremaine WJ, et al. The natural history of fistulizing Crohn's disease in Olmsted County, Minnesota. Gastroenterology. 2002;122:875–880. doi: 10.1053/gast.2002.32362. [DOI] [PubMed] [Google Scholar]
- 38.Maconi G, Sampietro GM, Parente F, et al. Contrast radiology, computed tomography and ultrasonography in detecting internal fistulas and intra-abdominal abscesses in Crohn's disease: a prospective comparative study. Am J Gastroenterol. 2003;98:1545–1555. doi: 10.1111/j.1572-0241.2003.07521.x. [DOI] [PubMed] [Google Scholar]
- 39.Prassopoulos P, Papanikolaou N, Grammatikakis J, Rousomoustakaki M, Maris T, Gourtsoyiannis N. MR enteroclysis imaging of Crohn disease. Radiographics. 2001;21(Special Issue):S161–S172. doi: 10.1148/radiographics.21.suppl_1.g01oc02s161. [DOI] [PubMed] [Google Scholar]
- 40.Maglinte DD, Gourtsoyiannis N, Rex D, Howard TJ, Kelvin FM. Classification of small bowel Crohn's subtypes based on multimodality imaging. Radiol Clin North Am. 2003;41:285–303. doi: 10.1016/s0033-8389(02)00117-3. [DOI] [PubMed] [Google Scholar]
- 41.Koh DM, Miao Y, Chinn RJ, et al. MR imaging evaluation of the activity of Crohn's disease. AJR Am J Roentgenol. 2001;177:1325–1332. doi: 10.2214/ajr.177.6.1771325. [DOI] [PubMed] [Google Scholar]
- 42.Solem CA, Loftus EV, Jr, Fletcher JG, et al. Small-bowel imaging in Crohn's disease: a prospective, blinded, 4-way comparison trial. Gastrointest Endosc. 2008;68:255–266. doi: 10.1016/j.gie.2008.02.017. [DOI] [PubMed] [Google Scholar]
- 43.Masselli G, Casciani E, Polettini E, Gualdi G. Comparison of MR enteroclysis with MR enterography and conventional enteroclysis in patients with Crohn's disease. Eur Radiol. 2008;18:438–447. doi: 10.1007/s00330-007-0763-2. [DOI] [PubMed] [Google Scholar]
- 44.Gölder SK, Schreyer AG, Endlicher E, et al. Comparison of capsule endoscopy and magnetic resonance (MR) enteroclysis in suspected small bowel disease. Int J Colorectal Dis. 2006;21:97–104. doi: 10.1007/s00384-005-0755-0. [DOI] [PubMed] [Google Scholar]
- 45.Fiorino G, Bonifacio C, Peyrin-Biroulet L, et al. Prospective comparison of computed tomography enterography and magnetic resonance enterography for assessment of disease activity and complications in ileocolonic Crohn's disease. Inflamm Bowel Dis. 2011;17:1073–1080. doi: 10.1002/ibd.21533. [DOI] [PubMed] [Google Scholar]
- 46.Jensen MD, Ormstrup T, Vagn-Hansen C, Ostergaard L, Rafaelsen SR. Interobserver and intermodality agreement for detection of small bowel Crohn's disease with MR enterography and CT enterography. Inflamm Bowel Dis. 2011;17:1081–1088. doi: 10.1002/ibd.21534. [DOI] [PubMed] [Google Scholar]
- 47.Towbin AJ, Sullivan J, Denson LA, Wallihan DB, Podberesky DJ. CT and MR enterography in children and adolescents with inflammatory bowel disease. Radiographics. 2013;33:1843–1860. doi: 10.1148/rg.337105140. [DOI] [PubMed] [Google Scholar]
- 48.Koelbel G, Schmiedl U, Majer MC, et al. Diagnosis of fistulae and sinus tracts in patients with Crohn disease: value of MR imaging. AJR Am J Roentgenol. 1989;152:999–1003. doi: 10.2214/ajr.152.5.999. [DOI] [PubMed] [Google Scholar]
- 49.Essary B, Kim J, Anupindi S, Katz JA, Nimkin K. Pelvic MRI in children with Crohn disease and suspected perianal involvement. Pediatr Radiol. 2007;37:201–208. doi: 10.1007/s00247-006-0372-2. [DOI] [PubMed] [Google Scholar]


