

Abstract
Background
Potentially avoidable hospitalizations represent an indirect measure of access to effective primary care. However many approaches have been proposed to measure them and results may differ considerably. This work aimed at examining the agreement between the Weissman and Ansari approaches in order to measure potentially avoidable hospitalizations in France.
Methods
Based on the 2012 French national hospital discharge database (Programme de Médicalisation des Systèmes d’Information), potentially avoidable hospitalizations were measured using two approaches proposed by Weissman et al. and by Ansari et al. Age- and sex-standardised rates were calculated in each department. The two approaches were compared for diagnosis groups, type of stay, severity, age, sex, and length of stay.
Results
The number and age-standardised rate of potentially avoidable hospitalizations estimated by the Weissman et al. and Ansari et al. approaches were 742,474 (13.3 cases per 1,000 inhabitants) and 510,206 (9.0 cases per 1,000 inhabitants), respectively. There are significant differences by conditions groups, age, length of stay, severity level, and proportion of medical stays between the Weissman and Ansari methods.
Conclusions
Regarding potentially avoidable hospitalizations in France in 2012, the agreement between the Weissman and Ansari approaches is poor. The method used to measure potentially avoidable hospitalizations is critical, and might influence the assessment of accessibility and performance of primary care.
Keywords: Diagnosis-related groups, International classification of disease, Potentially avoidable hospitalizations, PMSI, France
Background
The concept of potentially avoidable hospitalizations (PAH) or ambulatory care sensitive hospitalizations (ACSH) was proposed as an indirect measure of access to effective primary care [1-5]. It has also been used as a marker of overall healthcare system performance [6,7]. This approach is appealing since a large number of states, regions or hospitals have reliable data on hospital discharges and limited data on ambulatory care [8]. Avoiding admission represents a substantial reduction in costs, enhances patients’ quality of life and is an issue of considerable interest to policy makers and the public [9]. Higher rates of PAH are associated with socioeconomic deprivation [10,11], poor accessibility to primary care [5], and deficient continuity of care [12]. PAH can be reduced by programs aimed at improving primary care delivery [13,14] or by multifaceted interventions [15]. Thus PAH rates might increase where access to GPs is lower and where primary care is suboptimal.
In France, primary care is mostly delivered by self-employed physicians in the ambulatory care sector. General Practitioners have been playing a semi gatekeeping role since the late 1990s. Although patients are financially incentivized to visit their GP before being referred to a specialist, the gate-keeping procedure is not mandatory and patients can visit any specialist. A major weakness lies in the lack of coordination and continuity of care between GPs, ambulatory care and hospital care [16]. So far, GPs’ individual performance measures do not include PAH rates.
There are significant disparities for PAH by ethnicity, insurance status, and socioeconomic status [17]. PAH are common in older people [18-20] but can occur at any age [21-24]. Chronic diseases represent an important cause of PAH [3]. Comorbidities are associated with PAH [25].
Measuring PAH is important for policymakers and researchers willing to assess the performance of the primary care sector and to monitor the impact of interventions aimed at improving access. Trends in PAH are available for many countries [26-30] including France [31,32]. The estimation of the proportion of PAH among all hospital discharges is based on the assumption that hospitalizations for some conditions are preventable. Each of the conditions is defined by a list of diagnosis codes from the International Classification of Diseases (ICD). Two of the most critical issues include the selection of categories of conditions (diseases or complications of diseases) and of the corresponding ICD codes. Therefore, different methods have been used, that vary in terms of conditions and ICD codes. In France, Gusmano et al. [31,32] used the Weissman et al. approach [4], but this method does not encompass all potentially avoidable conditions. As an example, status asthmaticus, the most severe PAH in asthma, is not coded (ICD10 code J46), whereas it is coded in other studies [23]. Moreover, COPD (J20, J41, J42, J43, J44, J47 [23]), the most common cause of death due to respiratory diseases [33,34] and a common cause of PAH [5], is not even considered by Weissman et al. [4].
The current study aimed at estimating PAH in France in 2012 using the French hospital discharge database (Programme de Médicalisation des Systèmes d’Information; PMSI). Firstly, the Weissman et al. approach [4], already tested in France, was compared with the more recent Ansari one [23] at the French national and departmental levels. ICD-10 codes were used exactly as proposed by the authors.
Methods
Study population
The data for all patients hospitalized in France in 2012 were collected from the national administrative database, the PMSI. French public and private hospitals are financed through a Diagnosis-Related Group (DRG)-based prospective payment system [35,36]. The PMSI is the national discharge database and includes all hospital discharges from all public and private hospitals in France. The quality of this database is deemed well, especially since 2007 [37]. It centralises data by a diagnosis that is encoded according to ICD-10, medical procedure, age, residence and French diagnosis-related groups of patients admitted to all hospitals (public and private). The reliability and validity of the PMSI database have already been demonstrated for various acute and chronic conditions [38-41]. Hospital discharges are classified in diagnosis groups (catégories majeures diagnostiques, CMD) and then in DRGs according to ICD-10 principal and secondary diagnosis codes, surgical and non-surgical procedures (Classification Commune des Actes Medicaux, CCAM) [42] and age. We extracted discharge data for acute hospital stays in medicine, surgery and obstetrics/gynaecology. Discharges for foreign patients were excluded.
This research was approved by the Commission Nationale Informatique et Liberte, an independent ethic committee (www.cnil.fr; approval number DE-2013-118). Access to the PMSI database is free for researchers after approval by the CNIL. Written informed consent from patients is not required by French law for such studies.
PAH definition
Since there is no consensus on the best one, two methods were independently used to identify PAH among all hospital discharges. Weissman et al. [4] (Table 1) was initially used since this is the standard approach for French studies [31,32]. In his seminal paper, Weissman used ICD-9 codes (Weissman 1992). We have used both the original method [4] and the ICD-10 conversion published by Gusmano et al. [43]. Only principal diagnosis codes were considered. However, the list of categories is not in accordance with the latest review carried out by Rosano et al. [5]. There are important missing diseases (e.g. Chronic Obstructive Pulmonary Diseases, COPD) and the codes reported may not be in full conformity with the current ICD-10 classification. We therefore used a second approach recently published by Ansari et al. used to assess and monitor access to primary care in Victoria, Australia [23] (Table 2). The strength of this method is that it encompasses a broader range of conditions, including COPD.
Table 1.
PAH selection algorithm according to Weissman et al. modified by Gusmano et al.
| Category | ICD-10 codes (Principal diagnosis only) |
|---|---|
| Bacterial pneumonia | J13, J14, J15, J16.0, J16.8, J18 |
| Congestive heart failure | I50 |
| Asthma | J45 |
| Cellulitis | J34.0, K12.2, L02, L03 |
| Complications of peptic ulcer disease | K25.0, K25.1, K25.2, K25.4, K25.5, K25.6, K26.0, K26.1, K26.2, K26.4, K26.5, K26.6, K27.0, K27.1, K27.2, K27.4, K27.5, K27.6, K28.0, K28.1, K28.2, K28.4, K28.5, K28.6 |
| Pyelonephritis | N10, N11, N12, N13.6, N15.8, N15.9, N17.2 |
| Type 2 diabetes mellitus with hyperosmolarity or coma | E10.0, E10.1, E11.0, E11.1, E13.0, E13.1, E14.0, E14.1 |
| Ruptured appendix | K35.2, K35.3 |
| Hypertension | I10, I11.0, I11.9, I12.0, I12.9, I13.0, I13.1, I13.2, I13.9, I15.0, I15.1, I15.2, I15.8, I15.9, I67.4 |
| Hypokalaemia | E87.6 |
| Immunizable conditions | A35, A36, A37, A80, B05, B26 |
| Gangrene | I73.0, L88, I70.2 |
Table 2.
PAH selection algorithm according to Ansari et al.
| Category | ICD-10 codes | Notes |
|---|---|---|
| Influenza and pneumonia | J10, J11, J13, J14, J15.3, J15.4, J15.7, J15.9, J16.8, J18.1, J18.8 | In any diagnosis field, exclude cases with secondary diagnosis of D57, and people under 2 months |
| Other vaccine preventable | A35, A36, A37, A80, B05, B06, B16.1, B16.9, B18.0, B18.1, B26, G00.0, M01.4 | In any diagnosis field |
| Asthma | J45, J46 | Principal diagnosis only |
| Congestive heart failure | I50, I11.0, J81 | Principal diagnosis only, exclude cases with procedure codes |
| Diabetes complications | E10.1, E10.2, E10.3, E10.4, E10.5, E10.6, E10.7, E10.8, E11.0, E11.1, E11.2, E11.3, E11.4, E11.5, E11.6, E11.7, E11.8, E13.0, E13.1, E13.2, E13.3, E13.4, E13.5, E13.6, E13.7, E13.8, E14.0, E14.1, E14.2, E14.3, E14.4, E14.5, E14.6, E14.7, E14.8 | In any diagnosis field |
| Chronic obstructive pulmonary disease | J20, J41, J42, J43, J44, J47 | Principal diagnosis only, J20 only with diag2 of J41 J42 J43 J47 J44 |
| Angina | I20, I24.0, I24.8, I24.9 | Principal diagnosis only, exclude cases with procedure codes |
| Iron deficiency anaemia | D50.1, D50.8, D50.9 | Principal diagnosis only |
| Hypertension | I10, I11.9 | Principal diagnosis only, exclude cases with procedure codes |
| Nutritional deficiencies | E40, E41, E42, E43, E55.0, E64.3 | Principal diagnosis only |
| Dehydration and gastroenteritis | E86, K52.2, K52.8, K52.9 | Principal diagnosis only |
| Pyelonephritis | N39.0, N10, N12, N11, N13.6 | Principal diagnosis only |
| Perforated/ bleeding ulcer | K25.0, K25.1, K25.2, K25.4, K25.5, K25.6, K26.0, K26.1, K26.2, K26.4, K26.5, K26.6, K27.0, K27.1, K27.2, K27.4, K27.5, K27.6, K28.0, K28.1, K28.2, K28.4, K28.5, K28.6 | Principal diagnosis only |
| Cellulitis | L03, L04, L08, L98.0, L88, L98.3 | Principal diagnosis only, exclude cases with procedure codes |
| Pelvic inflammatory disease | N70, N73, N74 | Principal diagnosis only |
| Ear, nose and throat infections | H66, H67, J02, J03, J06, J31.2 | Principal diagnosis only |
| Dental conditions | K02, K03, K04, K05, K06, K08, K09.8, K09.9, K12, K13 | Principal diagnosis only |
| Convulsions and epilepsy | O15, G40, G41, R56 | Principal diagnosis only |
| Gangrene | R02 | Principal diagnosis only |
For each method, any hospitalization with at least one of the ICD codes was systematically identified as potentially avoidable.
Hospitalizations were described using diagnosis-related groups of patients (CMD) from the French DRG system based on diagnosis codes (ICD-10) and surgical procedure codes (CCAM). The CMDs represent the first step of the classification algorithm. They are based on ICD-10 principal diagnosis codes [36].
Severity of disease was based on comorbidities, complications and age according to the French DRG grouping system. Four severity levels are defined from 1 (lowest severity) to 4 (highest). However, severity levels do not exist for all DRGs and we used those proposed.
Sex, age and length of stay are mandatory data for each discharge in the PMSI database.
Statistical analysis
PAH were identified according to the Weissman et al. [4], Weissman modified by Gusmano et al. [43] and Ansari et al. approaches [23]. In 2012, they were identified for the 98 French departments overall and for the most frequent diagnosis groups. The proportion of PAH was calculated by dividing the number of PAH by the total number of hospital discharges in 2012. PAH crude rates were calculated by dividing the number of PAH by the 2011 national and departmental populations. Age- and sex-standardised rates of PAH were calculated in each department, employing the direct standardization method using the 2011 French population (Institut National de la statistique et des etudes économiques - National Institute for statistics and economic studies: http://www.insee.fr/fr/bases-dedonnees/default.asp?page=recensement/resultats/2011/donnees-detaillees-recensement-2011.htm (accessed on 20th Sept 2013, INSEE)). The agreement between both approaches was assessed graphically. The two approaches were compared for diagnosis groups, type of stay, severity, sex, age and length of stay. The characteristics of hospitalisations were presented using median and range (or mean and SD) for continuous variables and frequencies and proportions for categorical variables. The methods were compared using Student or Wilcoxon rank test for continuous variables and Chi-square or Fisher test for categorical ones. Statistical bilateral significance threshold was set at 5%. Statistical analyses were performed using SAS version 9.1 (SAS Institute, Cary, North Carolina).
Results
PAH standardised rates in 2012
The total number of discharges in 2012 in France was 26,656,833. The number and proportion of PAH estimated by the Weissman et al. and Ansari et al. approaches were, respectively, 742,474 (2.8%) and 510,206 (1.9%) (Table 3 and Figure 1). Overall, 334,745 discharges were identified by both approaches. The standardised rate of PAH estimated by the Weissman and Ansari approaches were, respectively, 13.3 and 9.0 cases per 1,000 inhabitants.
Table 3.
Number of PAH in France in 2012 according to severity, type of event and diagnosis-related groups
| Ansari approach | Weissman approach | p | ||
|---|---|---|---|---|
| N (%) | N (%) | |||
| Diagnosis | 1 (nervous system) | 6,724 (1.3%) | 455 (0.1%) | <.001 |
| group | 2 (eye) | 106 (0.0%) | NA | . |
| 3 (ENT) | 956 (0.2%) | 5,262 (0.7%) | . | |
| 4 (respiratory system) | 211,490 (41.5%) | 229,314 (30.9%) | . | |
| 5 (circulatory system) | 252,883 (49.6%) | 288,396 (38.8%) | . | |
| 6 (digestive system) | 4,671 (0.9%) | 50,947 (6.9%) | . | |
| 7 (liver and pancreas) | 1,927 (0.4%) | NA | . | |
| 8 (musculoskeletal system) | 3,423 (0.7%) | NA | . | |
| 9 (skin) | 6,568 (1.3%) | 65,787 (8.9%) | . | |
| 10 (endocrine and nutritional) | 2,612 (0.5%) | 20,807 (2.8%) | . | |
| 11 (urinary system) | 3,786 (0.7%) | 79,428 (10.7%) | . | |
| 12 (genital, male) | 331 (0.1%) | 4 (0.0%) | . | |
| 13 (genital, female) | 165 (0.0%) | NA | . | |
| 14 (obstetrics) | 407 (0.1%) | NA | . | |
| 15 (childbirth) | 143 (0.0%) | 95 (0.0%) | . | |
| 16 (haematology) | 2,607 (0.5%) | NA | . | |
| 17 (haematology, others) | 1,319 (0.3%) | NA | . | |
| 18 (infectious diseases) | 2,125 (0.4%) | 301 (0.0%) | . | |
| 19 (psychiatry) | 1,147 (0.2%) | NA | . | |
| 20 (psychiatry, organic) | 329 (0.1%) | NA | . | |
| 21 (external causes) | 754 (0.2%) | NA | . | |
| 22 (burns) | 142 (0.0%) | NA | . | |
| 23 (other) | 3,092 (0.6%) | NA | ||
| 25 (HIV) | 1,040 (0.2%) | 1,521 (0.2%) | . | |
| 26 (polytrauma) | 431 (0.1%) | NA | ||
| 27 (transplantations) | 415 (0.1%) | 157 (0.0%) | ||
| 28 (very short stays) | 613 (0.1%) | 0 | ||
| Type | Surgical procedure | 16,002 (3.1%) | 98,545 (13.3%) | <.001 |
| Non-surgical procedure | 24,753 (4.9%) | 50,899 (6.9%) | . | |
| Medical stay | 466,249 (91.4%) | 592,961 (79.9%) | . | |
| Short stays | 3,202 (0.6%) | 69 (0.0%) | ||
| Severity | 1 (low) | 107,578 (21.1%) | 229,912 (31.0%) | <.001 |
| 2 | 150,140 (29.4%) | 164,501 (22.2%) | . | |
| 3 | 143,854 (28.2%) | 174,614 (23.5%) | . | |
| 4 (high) | 34,814 (6.8%) | 37,813 (5.1%) | ||
| Sex | Male | 269,771 (52.9%) | 370,053 (49.8%) | <.001 |
| Female | 240,435 (47.1%) | 372,421 (50.16%) | . | |
| Age (yrs) | (mean, SD) | 72 (20) | 61 (29) | <.001 |
| 0-17 yr | 21,142 (4.1%) | 100,629 (13.6%) | <.001 | |
| 18-64 yr | 111,164 (21.8%) | 214,170 (28.9%) | ||
| 65-74 yr | 78,589 (15.4%) | 90,402 (12.2%) | ||
| ≥75. yr | 299,311 (58.7%) | 337,273 (45.4%) | ||
| Length of stay (days) | (mean, SD) | 9.6 (11.5) | 7.3 (8.5) | <.001 |
Figure 1.
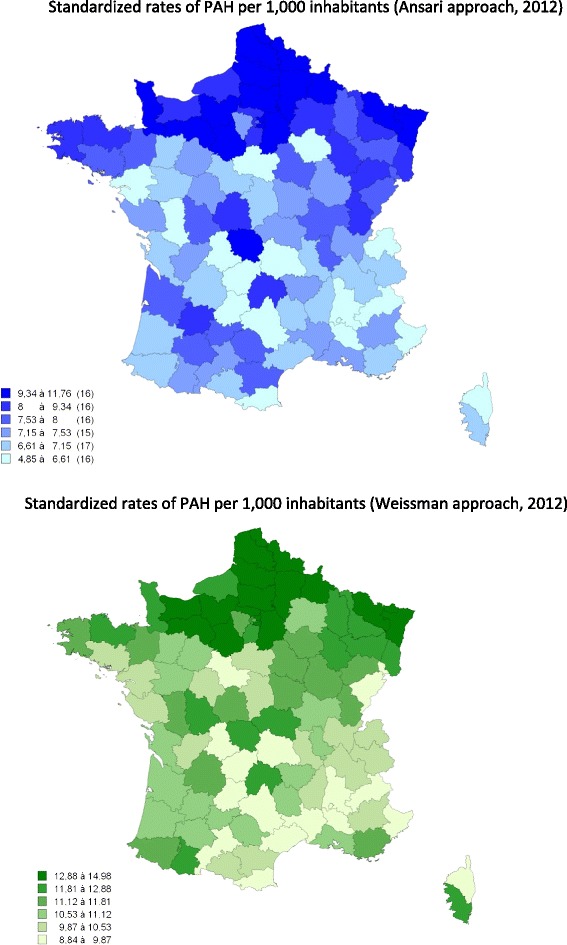
Maps of standardised rate of PAH in French departments, 2012.
The characteristics of PAH are given in Table 3. There was a significant correlation between diagnoses made by the two approaches (Figure 2), and the two most common causes of PAH (cardiovascular and respiratory systems) are in the same ranking order. However, the Weissman et al. approach identified a lower proportion of respiratory and circulatory system conditions within PAH (38.9 and 30.9% for Weissman and 49.6 and 41.5% for Ansari), and a higher proportion of skin and urinary system conditions (8.9% and 10.7% for Weissman and 1.3 and 0.7% for Ansari). Although the highest percentage of PAH was found in subjects over 75 years of age, the Weissman et al. approach identified significantly older patients. The Weissman et al. approach detects significantly shorter stays (7.3 ± 8.5 days vs. 9.6 ± 11.5 days), with a lower severity level (p < 0.001) and a lower proportion of medical stays (p < 0.01).
Figure 2.
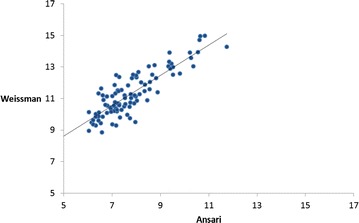
Correlation between standardised rates of PAH in France in 2012. Legend: Figure 2 shows the correlation between age and sex-standardised rates of PAH measured by the Weissman and Ansari approaches. Each dot represents a department.
At the department level, the standardized rate of PAH ranged from 4.9 to 11.8 cases per 1,000 inhabitants using the Ansari method and from 8.8 to 15.0 cases per 1,000 inhabitants using the Weissman method. Figure 1 suggests an overall North–south gradient, but there are significant differences between the two approaches.
Discussion
Overall results
The estimation of PAH according to the Weissman et al. and Ansari et al. approaches ranged from 2.8% of total discharges to 1.9%. The standardised rate of PAH estimated by the Weissman and Ansari approaches were, respectively, 13.3 and 9.0 cases per 1,000 inhabitants. These results are consistent with the recent work of Gusmano et al. that estimated standardized PAH rates between 9.1 and 11.1 per 1,000 inhabitants.
There are significant disparities by conditions groups, age, length of stay, severity level, and proportion of medical stays between the methods.
Strengths and limitations
This study is based on the nation-wide, all-payers, and public and private hospitals discharge database. Hence it can be considered as exhaustive and representative. By definition, DRGs classify cases according to principal and secondary diagnoses, patient age and sex, the presence of co-morbidities and complications as well as the procedures performed. The PMSI is based on DRGs allowing an exhaustive patient case classification system (i.e. the system of diagnosis-related groupings). The PMSI is standardized and exhaustive but there are some limitations. Inconsistency may occur due to variability in coding in different health institutions because of ignorance or misinterpretation of coding rules. Since 2009, army hospitals have been included, and the definition of primary diagnosis has changed. The primary diagnosis is “the health problem which motivated the admission of the patient, determined at the end of the stay”.
In general, hospital discharges in European countries tend to be related to the number of hospital beds in the country [44]. Trends in hospital discharges may reflect other independent causes. Healthcare demand grows as population’s age. In the present study, PAH in subjects over 65 years of age represent 67 to 72% according to the algorithm. Changes in medical technologies and medical practices are important.
The coding approaches may not be completely relevant for the French population. Weissman et al. are still considered as the gold standard, even though many NCDs (e.g. COPD) are not included. This is why we attempted to compare results with a newer coding system used in the Australian population which is close to the French population but not completely identical. Moreover, some codes are missing (e.g. J82, eosinophilic asthma). A new study is favoured using an instrument specifically targeted to the French population.
Generalizability
The discrepancies between the two coding approaches are substantial. They may be, at least partly, explained by various factors. Firstly, the two algorithms encompass different disease categories. For instance, Weissman et al. [5] take into account hypokalaemia and infectious diseases which are two very common conditions. Secondly, even when disease categories are labelled in the same way, Ansari et al. [23] exclude a significant proportion of hospitalisations as compared to Weissman et al., due to a more restricted list of ICD codes, through the exclusion of hospitalizations with surgical procedures. Hence, though both methods include hypertension, Ansari et al. coding [23] has fewer ICD-10 codes (2 vs. 15). The Ansari method [23] is consequently more restrictive than the Weissman method [5]. The restricted definition of the Ansari method makes it closer to being “ambulatory care sensitive” compared to the use of the broader definitions of Weissman. However, the study was aimed at finding differences and not at assessing the method of choice.
The results of the study using the Ansari et al. approach [23] are in line with data from many European countries, with the highest rates for cardiovascular and respiratory disorders. However, the rates vary widely depending on the classification and coding methods.
In the Ansari et al. approach, respiratory diseases include communicable and non-communicable diseases (asthma and COPD). The development of a coding exercise is required before these two diseases are studied in the French population.
Large differences exist between the 97 French Départements. These may be due to variations in epidemiological patterns, in coding practices, in medical practice and in healthcare supply.
From a policy perspective, our study shows striking differences between two published definitions of PAH. On the one hand, some scholars have advocated that each country develops its own method tailored to the purpose [45]. On the other hand, implementing different methods might prevent useful international comparisons. Nevertheless our study does not allow recommending one method over the other.
Conclusion
There are significant differences between the Weissman and Ansari methods with reference to potentially avoidable hospitalizations in France in 2012. The method used to measure potentially avoidable hospitalizations is critical, and might influence the assessment of accessibility and performance of primary care.
Acknowledgments
This work was partially funded by the Montpellier University Hospital (CHU de Montpellier). The funder had no role in study design, data analysis, manuscript preparation and decision to submit it.
Footnotes
Competing interests
Jean Bousquet has received honoraria for participation in scientific and advisory boards, giving lectures, and press engagements from Actelion, Almirall, AstraZeneca, Chiesi,GlaxoSmithKline, Meda, Merck, Merck Sharpe &Dohme, Novartis, oMPharma,Sanofi-Aventis, Schering Plough , Stallergènes, Takeda, Teva and Uriach.
JE de La Coussaye has received honoraria for lectures, consulting and/or travels: Astra-Zeneca, Daiichi-Sankyo & Eli-Lilly, Sanofi-Aventis, Novo-Nordisk and Iroko CardioThermo Fisher Scientific.
Authors’ contributions
Conceived and designed the experiments: RB, GM, PJB, and JB. Performed the experiments: GM. Analysed the data: all. Wrote the manuscript: RB, GM, JB. All authors read and approved the final manuscript.
Contributor Information
Rodolphe Bourret, Email: r-bourret@chu-montpellier.fr.
Grégoire Mercier, Email: g-mercier@chu-montpellier.fr.
Jacques Mercier, Email: jacques.mercier@univ-montp1.fr.
Olivier Jonquet, Email: o-jonquet@chu-montpellier.fr.
Jean-Emmanuel De La Coussaye, Email: jean.emmanuel.delacoussaye@chu-nimes.fr.
Philippe J Bousquet, Email: philippejean.bousquet@orange.fr.
Jean-Marie Robine, Email: robinejm@gmail.com.
Jean Bousquet, Email: jean.bousquet@inserm.fr.
References
- 1.Bornemeier WC. Avoidable hospitalization. Ill Med J. 1953;104(5):325–326. [PubMed] [Google Scholar]
- 2.Billings J, Zeitel L, Lukomnik J, Carey TS, Blank AE, Newman L. Impact of socioeconomic status on hospital use in New York City. Health Aff (Millwood) 1993;12(1):162–173. doi: 10.1377/hlthaff.12.1.162. [DOI] [PubMed] [Google Scholar]
- 3.Bindman AB, Grumbach K, Osmond D, Komaromy M, Vranizan K, Lurie N, Billings J, Stewart A. Preventable hospitalizations and access to health care. J Am Med Assoc. 1995;274(4):305–311. doi: 10.1001/jama.1995.03530040033037. [DOI] [PubMed] [Google Scholar]
- 4.Weissman JS, Gatsonis C, Epstein AM. Rates of avoidable hospitalization by insurance status in Massachusetts and Maryland. J Am Med Assoc. 1992;268(17):2388–2394. doi: 10.1001/jama.1992.03490170060026. [DOI] [PubMed] [Google Scholar]
- 5.Rosano A, Loha CA, Falvo R, van der Zee J, Ricciardi W, Guasticchi G, de Belvis AG. The relationship between avoidable hospitalization and accessibility to primary care: a systematic review. Eur J Public Health. 2013;23(3):356–360. doi: 10.1093/eurpub/cks053. [DOI] [PubMed] [Google Scholar]
- 6.Ricketts TC, Randolph R, Howard HA, Pathman D, Carey T. Hospitalization rates as indicators of access to primary care. Health Place. 2001;7(1):27–38. doi: 10.1016/S1353-8292(00)00035-6. [DOI] [PubMed] [Google Scholar]
- 7.Saxena S, George J, Barber J, Fitzpatrick J, Majeed A. Association of population and practice factors with potentially avoidable admission rates for chronic diseases in London: cross sectional analysis. J R Soc Med. 2006;99(2):81–89. doi: 10.1258/jrsm.99.2.81. [DOI] [PMC free article] [PubMed] [Google Scholar]
- 8.Clancy CM. The persistent challenge of avoidable hospitalizations. Health Serv Res. 2005;40(4):953–956. doi: 10.1111/j.1475-6773.2005.00442.x. [DOI] [PMC free article] [PubMed] [Google Scholar]
- 9.Byrd L. Reducing avoidable hospitalizations in nursing could save $1 billion annually–so why delay? Geriatr Nurs. 2009;30(5):365–369. doi: 10.1016/j.gerinurse.2009.08.007. [DOI] [PubMed] [Google Scholar]
- 10.Agabiti N, Pirani M, Schifano P, Cesaroni G, Davoli M, Bisanti L, Caranci N, Costa G, Forastiere F, Marinacci C, Russo A, Spadea T, Perucci CA, Italian Study Group on Inequalities in Health Care Income level and chronic ambulatory care sensitive conditions in adults: a multicity population-based study in Italy. BMC Public Health. 2009;9:457. doi: 10.1186/1471-2458-9-457. [DOI] [PMC free article] [PubMed] [Google Scholar]
- 11.Lofqvist T, Burstrom B, Walander A, Ljung R. Inequalities in avoidable hospitalisation by area income and the role of individual characteristics: a population-based register study in Stockholm County. Sweden BMJ Qual Saf. 2014;23(3):206–214. doi: 10.1136/bmjqs-2012-001715. [DOI] [PubMed] [Google Scholar]
- 12.Nyweide DJ, Anthony DL, Bynum JP, Strawderman RL, Weeks WB, Casalino LP, Fisher ES. Continuity of care and the risk of preventable hospitalization in older adults. JAMA Intern Med. 2013;173(20):1879–1885. doi: 10.1001/jamainternmed.2013.10059. [DOI] [PMC free article] [PubMed] [Google Scholar]
- 13.Macinko J, Dourado I, Aquino R, Bonolo Pde F, Lima-Costa MF, Medina MG, Mota E, de Oliveira VB, Turci MA. Major expansion of primary care in Brazil linked to decline in unnecessary hospitalization. Health Aff (Millwood) 2010;29(12):2149–2160. doi: 10.1377/hlthaff.2010.0251. [DOI] [PubMed] [Google Scholar]
- 14.Hochman ME, Asch S, Jibilian A, Chaudry B, Ben-Ari R, Hsieh E, Berumen M, Mokhtari S, Raad M, Hicks E, Sanford C, Aguirre N, Tseng C, Vangala S, Mangione CM, Goldstein DA. Patient-centered medical home intervention at an internal medicine resident safety-net clinic. JAMA Intern Med. 2013;173(18):1694–1701. doi: 10.1001/jamainternmed.2013.9241. [DOI] [PMC free article] [PubMed] [Google Scholar]
- 15.Boutwell AE, Johnson MB, Rutherford P, Watson SR, Vecchioni N, Auerbach BS, Griswold P, Noga P, Wagner C. An early look at a four-state initiative to reduce avoidable hospital readmissions. Health Aff (Millwood) 2011;30(7):1272–1280. doi: 10.1377/hlthaff.2011.0111. [DOI] [PubMed] [Google Scholar]
- 16.Chevreul K, Durand-Zaleski I, Bahrami SB, Hernandez-Quevedo C, Mladovsky P. France: health system review. Health Syst Transit. 2010;12(6):1–291. [PubMed] [Google Scholar]
- 17.Johnson PJ, Ghildayal N, Ward AC, Westgard BC, Boland LL, Hokanson JS. Disparities in potentially avoidable emergency department (ED) care: ED visits for ambulatory care sensitive conditions. Med Care. 2012;50(12):1020–1028. doi: 10.1097/MLR.0b013e318270bad4. [DOI] [PubMed] [Google Scholar]
- 18.Walker JD, Teare GF, Hogan DB, Lewis S, Maxwell CJ. Identifying potentially avoidable hospital admissions from canadian long-term care facilities. Med Care. 2009;47(2):250–254. doi: 10.1097/MLR.0b013e3181847588. [DOI] [PubMed] [Google Scholar]
- 19.Spector WD, Limcangco R, Williams C, Rhodes W, Hurd D. Potentially Avoidable Hospitalizations for Elderly Long-stay Residents in Nursing Homes. Med Care. 2013;51(8):673–681. doi: 10.1097/MLR.0b013e3182984bff. [DOI] [PubMed] [Google Scholar]
- 20.Walsh B, Roberts HC, Nicholls PG. Features and outcomes of unplanned hospital admissions of older people due to ill-defined (R-coded) conditions: retrospective analysis of hospital admissions data in England. BMC Geriatr. 2011;11:62. doi: 10.1186/1471-2318-11-62. [DOI] [PMC free article] [PubMed] [Google Scholar]
- 21.Friedman B, Berdahl T, Simpson LA, McCormick MC, Owens PL, Andrews R, Romano PS. Annual report on health care for children and youth in the United States: focus on trends in hospital use and quality. Acad Pediatr. 2011;11(4):263–279. doi: 10.1016/j.acap.2011.04.002. [DOI] [PubMed] [Google Scholar]
- 22.Craig E, Anderson P, Jackson G, Jackson C. Measuring potentially avoidable and ambulatory care sensitive hospitalisations in New Zealand children using a newly developed tool. N Z Med J. 2012;125(1366):38–50. [PubMed] [Google Scholar]
- 23.Ansari Z, Haider SI, Ansari H, de Gooyer T, Sindall C. Patient characteristics associated with hospitalisations for ambulatory care sensitive conditions in Victoria, Australia. BMC Health Serv Res. 2012;12:475. doi: 10.1186/1472-6963-12-475. [DOI] [PMC free article] [PubMed] [Google Scholar]
- 24.Akinbami LJ, Moorman JE, Garbe PL, Sondik EJ. Status of childhood asthma in the United States, 1980–2007. Pediatrics. 2009;123(Suppl 3):S131–S145. doi: 10.1542/peds.2008-2233C. [DOI] [PubMed] [Google Scholar]
- 25.Ahern MM, Hendryx M. Avoidable hospitalizations for diabetes: comorbidity risks. Dis Manag. 2007;10(6):347–355. doi: 10.1089/dis.2007.106709. [DOI] [PubMed] [Google Scholar]
- 26.Cheng SH, Chen CC, Hou YF. A longitudinal examination of continuity of care and avoidable hospitalization: evidence from a universal coverage health care system. Arch Intern Med. 2010;170(18):1671–1677. doi: 10.1001/archinternmed.2010.340. [DOI] [PubMed] [Google Scholar]
- 27.Sheerin I, Allen G, Henare M, Craig K. Avoidable hospitalisations: potential for primary and public health initiatives in Canterbury, New Zealand. N Z Med J. 2006;119(1236):U2029. [PubMed] [Google Scholar]
- 28.Cloutier-Fisher D, Penning MJ, Zheng C, Druyts EB. The devil is in the details: trends in avoidable hospitalization rates by geography in British Columbia, 1990–2000. BMC Health Serv Res. 2006;6:104. doi: 10.1186/1472-6963-6-104. [DOI] [PMC free article] [PubMed] [Google Scholar]
- 29.Dharmalingam A, Pool I, Baxendine S, Sceats J. Trends and patterns of avoidable hospitalisations in New Zealand:1980–1997. N Z Med J. 2004;117(1198):U976. [PubMed] [Google Scholar]
- 30.Kozak LJ, Hall MJ, Owings MF. Trends in avoidable hospitalizations, 1980–1998. Health Aff (Millwood) 2001;20(2):225–232. doi: 10.1377/hlthaff.20.2.225. [DOI] [PubMed] [Google Scholar]
- 31.Gusmano MK, Rodwin VG, Weisz D. A new way to compare health systems: avoidable hospital conditions in Manhattan and Paris. Health Aff (Millwood) 2006;25(2):510–520. doi: 10.1377/hlthaff.25.2.510. [DOI] [PubMed] [Google Scholar]
- 32.Gusmano M, Weisz D, Andrews T, Rodwin V. Réduire les hospitalisations évitables. Une politique pour rentabiliser les dépenses de soins de santé. Alliance for Health in Future. 2010. http://www.ilcfrance.org/realisations/docs/2010/Hospitalisations_evitables_fr.pdf. Accessed 20 Jan 2015.
- 33.Bousquet J, Dahl R, Khaltaev N. Global alliance against chronic respiratory diseases. Allergy. 2007;62(3):216–223. doi: 10.1111/j.1398-9995.2007.01307.x. [DOI] [PubMed] [Google Scholar]
- 34.Cruz AA. Global surveillance, prevention and control of chronic respiratory diseases: a comprehensive approach. Eds. Jean Bousquet, and N. G. Khaltaev. Geneva: World Health Organization; 2007.
- 35.Bellanger MM, Tardif L. Accounting and reimbursement schemes for inpatient care in France. Health Care Manag Sci. 2006;9(3):295–305. doi: 10.1007/s10729-006-9097-x. [DOI] [PubMed] [Google Scholar]
- 36.Or Z, Bellanger M. France: Implementing homogeneous patient groups in a mixed market. In: Busse RGA, Quentin W, Wiley M, editors. Diagnosis-Related Groups in Europe. New York: Open University press; 2011. pp. 221–241. [Google Scholar]
- 37.Goldberg M, Coeuret-Pellicer M, Ribet C, Zins M. [Epidemiological studies based on medical and administrative databases : a potential strength in France] Med Sci (Paris) 2012;28(4):430–434. doi: 10.1051/medsci/2012284022. [DOI] [PubMed] [Google Scholar]
- 38.Chantry AA, Deneux-Tharaux C, Cans C, Ego A, Quantin C, Bouvier-Colle MH. Hospital discharge data can be used for monitoring procedures and intensive care related to severe maternal morbidity. J Clin Epidemiol. 2011;64(9):1014–1022. doi: 10.1016/j.jclinepi.2010.11.015. [DOI] [PubMed] [Google Scholar]
- 39.Couris CM, Polazzi S, Olive F, Remontet L, Bossard N, Gomez F, Schott AM, Mitton N, Colonna M, Trombert B. Breast cancer incidence using administrative data: correction with sensitivity and specificity. J Clin Epidemiol. 2009;62(6):660–666. doi: 10.1016/j.jclinepi.2008.07.013. [DOI] [PubMed] [Google Scholar]
- 40.Lorgis L, Cottenet J, Molins G, Benzenine E, Zeller M, Aube H, Touzery C, Hamblin J, Gudjoncik A, Cottin Y, Quantin C. Outcomes after acute myocardial infarction in HIV-infected patients: analysis of data from a French nationwide hospital medical information database. Circulation. 2013;127(17):1767–1774. doi: 10.1161/CIRCULATIONAHA.113.001874. [DOI] [PubMed] [Google Scholar]
- 41.Ye X, Lafuma A, Torreton E, Arnaud A. Incidence and costs of bleeding-related complications in French hospitals following surgery for various diagnoses. BMC Health Serv Res. 2013;13(1):186. doi: 10.1186/1472-6963-13-186. [DOI] [PMC free article] [PubMed] [Google Scholar]
- 42.Trombert-Paviot B, Rector A, Baud R, Zanstra P, Martin C, van der Haring E, Clavel L, Rodrigues JM. The development of CCAM: the new French coding system of clinical procedures. The HIM journal. 2003;31(1):1–11. doi: 10.1177/183335830303100103. [DOI] [PubMed] [Google Scholar]
- 43.Gusmano MK, Weisz D, Rodwin VG, Lang J, Qian M, Bocquier A, Moysan V, Verger P. Disparities in access to health care in three French regions. Health Policy. 2014;114(1):31–40. doi: 10.1016/j.healthpol.2013.07.011. [DOI] [PubMed] [Google Scholar]
- 44.Health at a Glance: Europe 2012. Health at a Glance: Europe 2012, OECD Publishing 2012:http://dx.doi.org/10.1787/9789264183896-en.
- 45.Caminal J, Starfield B, Sanchez E, Casanova C, Morales M. The role of primary care in preventing ambulatory care sensitive conditions. Eur J Pub Health. 2004;14(3):246–251. doi: 10.1093/eurpub/14.3.246. [DOI] [PubMed] [Google Scholar]