Abstract
Rupture of unstable atherosclerotic plaque is the primary event leading to stroke and myocardial infarction. Plaque vulnerability may be induced by macrophage infiltration, neovessel formation and intraplaque instability. A tracer that selectively binds to macrophages and neovascular endothelium may identify rupture prone plaque. The 18F-labeled “R-G-D” containing tripeptide (Flotegatide) is a click chemistry derived radiotracer that binds to integrin αvβ3, a protein present in vulnerable plaque. We now demonstrate that Flotegatide preferentially binds to aortic plaque in an ApoE knock out mouse model of atherosclerosis. The tracer's uptake is strongly associated with presence of histologic markers for macrophage infiltration and integrin expression. There is a weaker but detectable association between Flotegatide uptake and presence of an immunohistochemical marker for neovascularization. We hypothesize that Flotegatide may be a useful tracer for visualization of inflamed plaque in clinical subjects.
Introduction
Rupture of vulnerable atherosclerotic plaque is the cardinal event preceding myocardial infarction or stroke (1-3). The progression of a benign atherosclerotic lesion to a vulnerable plaque is associated with a number of pathophysiological changes among which infiltration of macrophages, smooth muscle cell proliferation and angiogenesis appear to play an important role (2-6). Intraplaque angiogenesis has been implicated in plaque growth, hemorrhage, and rupture (4-11). Non-invasive imaging of intraplaque inflammation, smooth muscle proliferation and angiogenesis in the nascent stages of plaque growth may identify high-risk patients with rupture-prone plaques as potential candidates for interventional therapy (7,12-14).
The protein integrin αvß3 is a cell surface receptor highly expressed by neovascular endothelial cells, macrophages, and migrating smooth muscle cells. Given its unique expression profile, integrin αvß3 is a potential marker of plaque with increased levels of macrophage infiltration and neovascularization (15-17). The tri-pepide “R-G-D” has a high affinity for integrin αvß3 and subsequently is often utilized as the primary binding motif in integrin-targeting imaging agents. For example, paramagnetic nanoparticles have been elaborated with the “R-G-D” peptide motif to target integrin αvß3 in vivo. Also, “R-G-D”-based fluorochromes have been used to detect plaque neovascularization in preclinical studies utilizing MRI and fluorescence reflectance imaging (18,19) More recently, 18F-galacto RGD has been utilized for positron emission tomography (PET) imaging of tumor angiogenesis and has been shown to undergo selective extraction by plaque in an ApoE knockout mouse model of atherosclerosis (20)(21). However, the synthesis of 18F-galacto RGD is time consuming requiring several hours for its preparation, which hinders its routine clinical use. We have previously reported the use of click chemistry to label the a cyclic “R-G-D” peptide (18F-Flotegatide) with 18F-fluorine within 90 minutes (22). This triazole-containing “R-G-D”-derivative targets integrin αvß3 while additionally possessing a biodistribution profile that exhibits little liver uptake and rapid renal clearance (23) affording little background signal, especially in the thoracic cavity. Because of these promising biological and pharmacokinetic properties, we theorized that 18F-Flotegatide could sufficiently identify integrin αvß3 expression in atherosclerotic plaque. The goal of this study was to demonstrate selective plaque uptake of 18F-Flotegatide in a mouse model of atherosclerosis.
Methods
Animal Model
Mice with an ApoE targeted mutation (B6.129P2-Apoetm1Unc N11) (ApoE-KO) and its strain matched wild-type (WT) were purchased from Taconic (Hudson, NY). Female mice (4-6 weeks old) were kept on a modified (high-fat) Paigen diet (TD.96121, Taconic) for 10 weeks to induce atherosclerosis (Athero). Age matched WT mice and ApoE-KO mice on a regular diet (controls) were used for comparison. All animal experiments were conducted in compliance with the guidelines approved by the Institutional Animal Care and Use Committee of Siemens Healthcare.
Total cholesterol levels
Cholesterol levels were measured in venous blood using a commercially available Cholestech LDX kit (Cholestech Corporation, Hayward, CA) at the time of tracer injection.
Synthesis of 18F-Flotegatide
Pent-4-yn-1-yl 4-methylbenzenesulfonate (pentyne tosylate) was reacted with anhydrous 18F-fluoride in the presence of Kryptofix® 2.2.2 and K2CO3 in MeCN at 110°C with the resulting 18F-fluoropentyne distilling into a collection vial for the click reaction (24). The collection vial contained Flotegatide azide precursor, Cu(I) (generated by the in situ reduction of CuSO4 with sodium ascorbate), and tris[(1-benzyl-1H-1,2,3-triazol-4-yl)methyl]amine (TBTA) in aqueous ethanol/acetonitrile (25). TBTA was removed during the semi-preparative RP-HPLC step and was not detected in the final dose. After reacting for 10 to 30 minutes at room temperature, the crude reaction mixture was transferred to an intermediate HPLC load vial containing water for dilution prior semi-preparative HPLC purification. After purification of the crude reaction mixture by semi-preparative RP-HPLC (acetonitrile:aqueous TFA), the product was reformulated via C18 cartridge reconstitution as a solution in a maximum of 10% EtOH:water. The total process time was 90 minutes, i.e. less than one half-life. The average isolated yield of 18F-Flotegatide was 26.9% ± 10.3% with an average specific activity of 9.7 ± 5.7 Ci/μmol.
Tracer injection and aorta extraction
All animals were anesthetized with 2% Isoflurane/ 98% oxygen, and injected with ~200μCi of 18F-Flotegatide via bolus intravenous tail vein injection. Animals were allowed to regain consciousness during the one hour uptake time after which they were anesthetized with 200mg/kg of ketamine and 20 mg/kg of xylazine via intraperitoneal injection. A transcardial perfusion was performed with 100ml of saline fed by gravity. For ex-vivo micro-PET, gamma counting, autoradiography and histologic studies, the aorta was dissected free from the surrounding tissue and periaortic fat.
Tissue gamma-counting
The aorta and control muscle (quadriceps femoris) were harvested for tissue counting in 4 mice each from the Athero, control and WT groups. For biodistribution studies in Athero mice, the liver, heart, mesenteric fat and kidneys were also removed. The tissue samples were weighed, and counted in a Wallac Wizard Gamma counter (Perkin-Elmer, Waltham, MA). The background counts were subtracted from the readings. The readings were also decay corrected to the time of injection. The accumulated radioactivity in each tissue over the 60 minute period was expressed as the percent of injected dose per gram of tissue (%ID/g). The final value was expressed as the ratio of 18F-Flotegatide uptake in aorta to muscle tissue.
In-vivo CT and microPET imaging
CT angiography was performed in 3 control mice and 3 Athero mice fed a high fat diet. Approximately 0.3ml of iodinated contrast (Fenestra, Advanced Research Technologies, Saint Laurent, Canada) was injected by tail vein and CT images were acquired with An INVEON Multimodality PET/CT scanner (Siemens, Knoxville, TN). Image acquisition was performed at 80kVp and images were reconstructed from 270 projections. For in vivo microPET imaging, mice were euthanized, 1 hr after injection of radiotracer prior to PET-CT image acquisition with a INVEON Multimodality scanner (Siemens). Images were reconstructed using filtered back projections without attenuation, scatter or dead-time corrections with a pixel size of 0.77×0.77×0.79mm. PET and CT images were coregistered on the basis of anatomic landmarks using an Inveon Research Workplace software (Siemens, Knoxville, TN).
Ex-vivo micro-PET imaging
For ex-vivo micro-PET imaging, mice were euthanized and a laparotomy was performed 1hr after injection of the radiotracer. Transcardial perfusion of the aorta was performed with 100ml of normal saline. The entire aorta was explanted from 3 Athero, control and WT mice after tracer infusion and PET image acquisition was performed. An INVEON Multimodality scanner (Siemens) was used for ex vivo micro-PET imaging. The extracted aorta was scanned for 30 minutes. Images were reconstructed using filtered back projections without attenuation, scatter or dead-time corrections. The aorta was stained with oil-red-O (ORO) for visualization of plaque (as described below) and micro-PET images were visually coregistered with digital ORO stained images. Quantification of tracer uptake was performed in regions of interest (ROI) in the aorta containing plaque and the corresponding activity values were determined using the INVEON Research Workplace software (Siemens, Knoxville, TN). All values were expressed as a ratio of %ID/g of the plaque containing aortic wall to normal appearing aortic wall.
Autoradiography
For whole-tissue autoradiography, the extracted aorta from 3 athero, control and WT mice was placed on an imaging plate (FujiFilm, Tokyo, Japan) for overnight exposure at −80°C. A digital readout of the imaging plate was obtained using a FLA-7000 scanner (FujiFilm, Tokyo, Japan), and images were analyzed with MultiGauge software (FujiFilm, Tokyo, Japan). Optical density corresponding to tracer uptake was quantified in PSL/mm2. The entire aorta was excised vertically and subjected to ORO staining (see below).
For micro-autoradiography, the extracted aorta from 2 athero mice was embedded and frozen in optimal cutting temperature (OCT) compound. The frozen tissue samples were cut into 10 μm sections on a cryotome (Leica Microsystems, Bannockburn, IL). Autoradiographic images were obtained by placing tissue sections on an imaging plate (FujiFilm, Tokyo, Japan) for overnight exposure at −80°C. A digital readout was obtained using a FLA-7000 scanner (FujiFilm, Tokyo, Japan), and images were analyzed with MultiGauge software (FujiFilm, Tokyo, Japan). Adjacent sections were used for histologic studies. Digital autoradiographic images were visually co-registered with stained tissue sections and tracer uptake was quantified in regions of interest (ROI) that included the plaque and unaffected vessel wall in PSL/mm2.
Histologic Analysis
Regions of plaque-containing aorta were stained with ORO. Briefly, frozen sections were fixed in formalin and stained with 0.5% ORO in isopropanol and counterstained with hematoxylin. Macrophage density, endothelial cell density, and integrin expression were examined by immunostaining of 10 μm frozen sections (performed by Cabenda Pharmaceutical (Vancouver, Canada)). Briefly, frozen sections were fixed in neutral buffered formalin for 15 minutes. Tissue sections were stained with a rabbit-anti-CD31 antibody (a marker for neovascular endothelium, Abcam 28364, 1:100) and Alexa 488 anti-rabbit secondary antibody (Invitrogen, 1:200). Integrin ß3 was detected using a hamster-anti-mouse integrin ß3 antibody (D 55041, clone 2C9.G2, 1:200), followed by an Alexa 647 tagged anti-hamster secondary antibody (Invitrogen, 1:200). Mac3 (a marker for macrophages) was detected using a rat-anti-mouse Mac3 antibody (BD clone M3/84, 1:200) and an Alexa 546 tagged anti-rat secondary antibody (Invitrogen, 1:200). Images were acquired using a robotic fluorescence microscope (Zeiss Axioimager Z1, Oberkochemm Germany) and a cooled, monochrome CCD camera (Retiga 4000R, QImaging, Vancuver, BC, Canada). Gray scale images of entire cryosections up to 4 cm2 were captured at a resolution of 0.75μm2/pixel. The stained area in the gray scale digital image ROIs was quantified and compared to area of unstained background and expressed as % staining. 18F-Flotegatide uptake quantified in these same ROIs as PSL/mm2 was compared to % staining for CD31, Mac3 and Integrin ß3.
Statistical Analysis
Results were expressed as Mean+SD. Students t test was used for comparisons between unpaired data. ANOVA was used to compare differences across multiple experimental groups. Pearsons correlation was used to compare staining intensity for ORO, CD31, Mac3, Integrin ß3 and 18F-Flotegatide uptake.
Results
Qualitatively, in whole aortas stained with ORO, atherosclerotic lesions were seen in all ApoE-KO mice on a high-fat diet (Athero) but not in age-matched wild-type mice on regular diet (WT). ApoE-KO mice fed a normal diet (control) had more lesions than WT but far fewer lesions than Athero mice. Lesions developed mainly in the aortic root and aortic arch, but in the Athero mice, lesions were present throughout the aorta (Figure 1-Panel A). Total cholesterol levels were significantly higher in the Athero mice (490±6) compared to control mice (243±44) and WT mice (118±14 mg/dl), p<0.001. There was no significant difference in body weight between the groups after 10 weeks of either high fat diet or normal diet (Table 1).
Figure 1.

Flotegatide uptake by atheroma in an Athero mouse detected by micro-PET.
Panel A. CTA of the aorta was performed with intravenous injection of contrast agent. Areas of high CT attenuation such as contrast filled lumen, calcified plaque and bone appear dark. Calcified atheroma in the aortic arch is shown in panel A.
Panel B. 18F-Flotegatide was injected by tail vein and PET-CT was performed in-vivo after euthanasia. Arrow represents region of the aortic arch with high tracer uptake.
Panel C. CTA and micro-PET images were coregistered manually and the arrow points to the overlap between the region containing atheroma visualized by CTA and the aortic arch with 18F-Flotegatide uptake.
Table 1.
Body weight before and after induction of atherosclerosis.
| Week 0 Weight in gm | Week 10 Weight in gm | |
|---|---|---|
| ApoE mice on high-fat diet (Athero) | 28.7 ± 2.7 | 32.8 ± 4.8 |
| ApoE mice on regular diet (Ctrl) | 27.7 ± 4.4 | 31.6 ± 2.5 |
| Wild-type mice on regular diet (WT) | 29.1 ± 2.5 | 34.3 ± 8.7 |
In-vivo and whole aorta ex-vivo PET imaging
Atherosclerotic plaque was seen in the aortic arch at the isthmus of the inominate and left common carotid artery with prominent focal calcification by CT angiography in Athero mice (Figure 1, panel A). Strong uptake of the tracer, 18F-Flotegatide, was seen in the same region of the aortic arch in these mice by in-vivo PET images obtained after euthanasia (Figure , panel B). Ex-vivo PET images revealed strong tracer uptake in the aortic root, at the origin of the inominate artery and left common carotid artery in Athero mice (Figure 2, Panel B). Tracer uptake was reduced in the control mice over the same regions with a near absence of detectable tracer uptake in WT mice (Figure 2, Panel B). A similar pattern was observed in autoradiographic images obtained immediately following explantation of the aorta. Autoradiographic images of the aorta revealed high tracer uptake in Athero mice, low uptake in the controls and an absence of uptake in WT mice (Figure 2, Panel C). Qualitatively, the location of the tracer's uptake matched the location of atherosclerotic plaques as detected by ORO staining (Figure 2, Panel A). Tracer uptake was quantified by measuring the ex-vivo PET signal in selected regions of the aorta with overlapping plaque enrichment confirmed by ORO staining. 18F-Flotegatide uptake was expressed relative to uptake by neighboring vessel wall which was relatively free of ORO staining (Figure 3). Tracer uptake in Athero mice was 2.2 fold higher (4.7 ± 1.8) compared to control mice (2.1 ± 0.4) and more than 4 fold higher than WT mice (0.9 ± 0.3), p<0.01.
Figure 2.
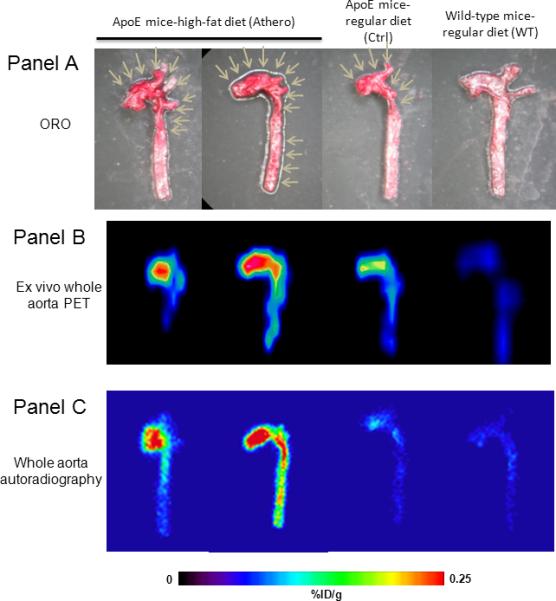
Flotegatide uptake by atherosclerotic plaque in whole aorta in Athero, Ctrl and WT mice
Panel A: The aorta was excised and the lumen was exposed. ORO staining was performed as described in the methods. ORO staining of Athero, WT and Control mice is shown. Arrows point to focal areas enriched for plaque in the aortic arch.
Panel B: Aorta explanted from Athero, WT and Control mice was subjected to ex-vivo PET as described in the methods 1 h after injection of 18F-Flotegatide. The signal intensity is a reflection of tracer uptake; areas of high uptake appear red compared to areas of low uptake which appear blue with intermediate uptake in yellow and green.
Panel C: Aorta explanted from Athero, WT and Control mice was subjected to autoradiography as described in the methods 1 h after injection of 18F-Flotegatide. Tracer uptake is represented by the signal intensity from the digital readout using a FLA-7000 scanner. Areas of high uptake appear red compared to areas of low uptake which appear blue with intermediate uptake appearing yellow and green.
Figure 3.
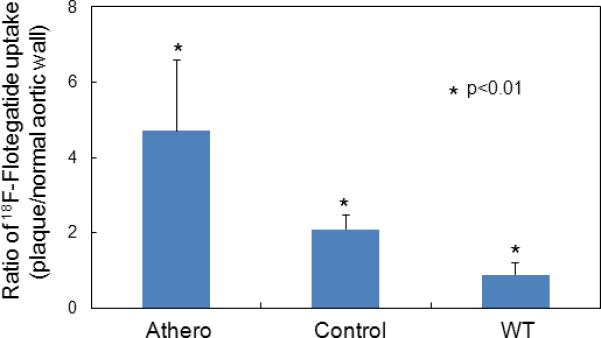
Flotegatide uptake quantified on ex-vivo PET of whole aorta. Tracer uptake (quantified from ex-vivo PET) of regions of aorta containing plaque (visualized by ORO staining) was measured as described previously and expressed as the ratio of %ID/g of regions enriched for plaque compared to relatively unaffected regions of the aorta. Tracer uptake from Athero, WT and Control mice were compared (n=4 per group). The bars represent mean values along with S.D.
Aortic uptake of [18F]-Flotegatide (gamma counting)
Uptake of 18F-Flotegatide in aorta was further confirmed by ex-vivo gamma-counting. After the aorta and muscle tissue were harvested from mice, tracer uptake in the aorta was measured, normalizing to muscle (Figure 4). A 1.5-fold increase of signal in the Athero mice aorta was observed compared to aorta from the wild-type mice on regular diet, and a 1.25-fold increase compared to the aorta of ApoE mice on regular diet (Athero: 2.8±0.4, control mice: 2.2±0.06, WT: 1.8±0.13) p <0.05. This uptake trend agreed with the uptake trend observed from the ex-vivo PET images. The biodistribution of 18F-Flotegatide showed a relatively low uptake in most tissues, with 0.5±0.07 %ID/g in the liver, 0.2±0.03 %ID/g in the heart, 0.3±0.1%ID/g in adipose tissue, 0.15±0.1%ID/g in muscle, 0.1±0.04 %ID/g in blood and a higher uptake of 1.6±0.1 %ID/g in the kidneys. To confirm that 18F-Flotegatide uptake in atheroma was indeed attributable to integrin-RGD binding and not due to non-specific binding of the tracer to atherosclerotic lesions, we co-injected 5 nmol of unlabeled Flotegatide with 18F-Flotegatide in 3 Athero mice. Aorta harvested from these mice had little uptake as determined by gamma counting (0.5±0.49 %ID/g).
Figure 4.
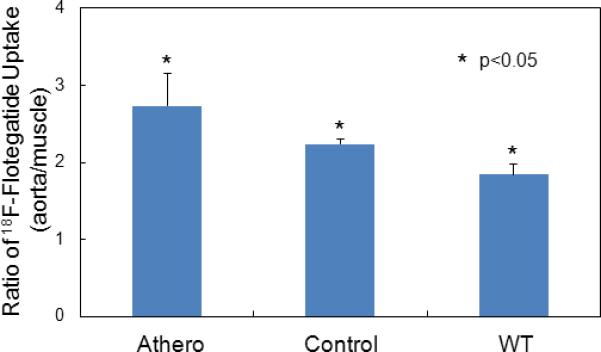
Tissue uptake of 18F-Flotegatide in Athero, control and WT mice quantified using gamma counting.
After the aorta and muscle tissue were harvested from 4 mice from each experimental group, tracer uptake in the aorta was measured and normalized to muscle. Bars represent mean and S.D of tracer uptake expressed as ratio of %ID/g of aorta to muscle from Athero, WT and Control mice.
Whole aorta autoradiography and correlation with ORO staining
In Athero mice aortic regions with elevated 18F-Flotegatide uptake overlapped with regions of plaque as detected by ORO staining pattern (Figure 5A). As shown previously (Figure 2 Panel C), tracer uptake was increased in aorta from Athero mice as compared to control mice. We compared the radioactive tracer uptake in regions of the aorta (3 Athero, control and WT mice) which showed prominent signal in the autoradiograph (expressed as ratio of autoradiographic signal intensity of plaque to background) to percent of area stained with ORO in the same location (expressed as % staining in the ROI). There was a strong correlation between the signal intensity from autoradiography and percent of area with ORO staining (Figure 5B, R2 of 0.72, p<0.01).
Figure 5A.
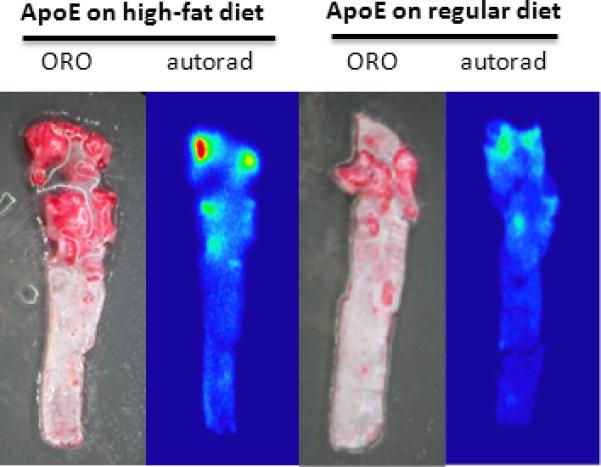
ORO staining and autoradiography of whole aorta from Athero and control mice. ORO staining and autoradiography was performed as described previously after excision of aorta from Athero and control mice. The dark red regions on the ORO staining correspond to focal atheroma. The red, yellow and green regions on the autoradiograph represent plaque with increased 18F-Flotegatide uptake.
Figure 5B.
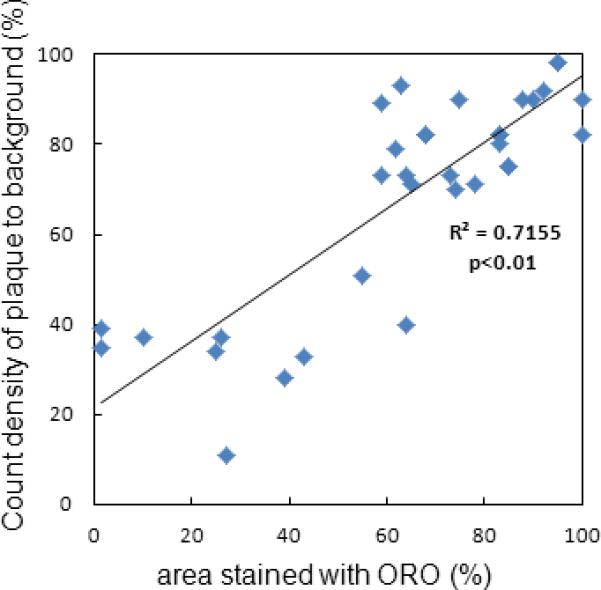
Correlation of ORO staining intensity and tracer uptake in whole aorta.
ORO staining and autoradiography was performed in Athero, control and WT mice (n=3 per group) as described previously. Signal intensity of tracer uptake was quantified as PSL/mm2 in the ROI in autoradiographic images. The ratio of signal intensity of the ROI to background was compared to % area stained with ORO (expressed as % staining). Correlation between ORO staining and tracer uptake was quantified.
Correlation of micro-autoradiography to histologic staining of markers for angiogenesis, integrin expression and inflammation
Analyses of proximal aorta cross-sections showed that 18F-Flotegatide co-localized with plaques (Figure 6A). Integrin ß3 staining showed strong signal patterns both within and on the plaque surface. Regions of the plaque with significant integrin expression quantified by integrin ß3 staining intensity exhibited increased 18F-Flotegatide uptake, expressed as target to background ratio (r2=0.83) p<0.05 (Figure 6B). Similar results were observed for Mac3, a macrophage-specific antigen (r2=0.84, p<0.01) (Figure 6B). Conversely, CD31 a surface antigen expressed on endothelial cells showed maximal staining on the luminal aspect and weak staining within plaque. There was a lower correlation between CD31 staining and 18F-Flotegatide uptake (r2=0.57 p<0.05).
Figure 6A.
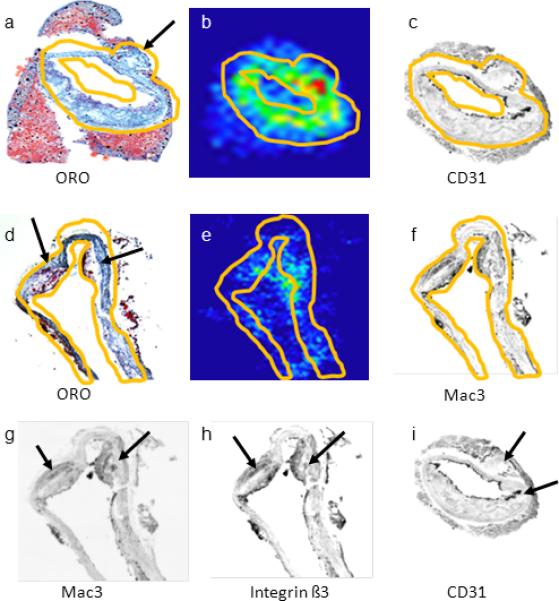
Comparison of 18F-Flotegatide uptake and histologic markers for plaque neovascularization integrin β3 expression and inflammation in tissue sections.
Five micron sections were obtained from the aorta of 2 Athero mice, explanted 60 min following 18F-Flotegatide injection. Sections were fixed and placed on glass slides for autoradiography and for staining for macrophages (Mac3), neovascular endothelial cells (CD31) and integrin β3 subunit was performed as described previously. Autoradiographic signal intensity was quantified and compared to % area stained with antibodies for Mac3, CD31 and integrinβ3. The top panels show representative consecutive sections of the aorta from an Athero mouse stained with ORO (panel a), an autoradiograph illustrating 18F-Flotegatide uptake (panel b) and a gray scale image of immunohistochemical staining with a CD31 antibody to detect neovascular endothelium (panel c). The arrows in panel a and d show the atheroma detected with ORO staining and hematoxylin counterstaining. The second set of panels show consecutive sections of the aorta from a similar Athero mouse stained with ORO (panel d), an autoradiograph of the aorta (panel e), and gray scale images of immunohistochemical staining with Mac3 for enrichment with macrophages (panel f). Regions with increased 18F-Flotegatide uptake appear red, yellow or green on the autoradiograph. The region where antibody staining and tracer uptake was quantified is demarcated by contours in yellow in images in panels a, through f. The arrows on panels g, h and i represent regions enriched for Mac3, integrin β3 and CD31expression respectively.
Figure 6B.
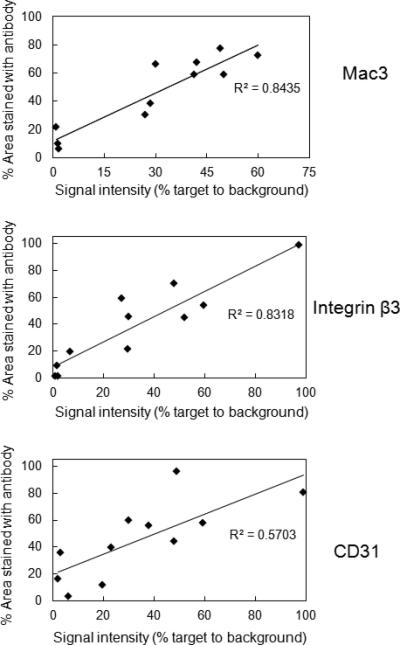
Correlation between Flotegatide uptake and immunohistochemical markers of plaque neovascularization, integrin expression and inflammation. 10 frozen sections from each of 2 Athero mice were used for autoradiography and immunohistochemical detection of CD31, Mac3 and integrin β3. Area stained with the antibody for Mac3, CD31 and integrin ß3 in ROIs in the cryosections was quantified from gray scale digital images and expressed as % staining. 18F-Flotegatide uptake of these same ROIs in autoradiographic sections was quantified in PSL/mm2 and compared to background to derive signal intensity of target to background. 18F-Flotegatide uptake expressed as signal intensity of target to background was compared to % area stained for CD31, Mac3 and integrin ß3. Data obtained from each individual ROI in cryosections from 2 Athero mice is shown.
Discussion
This is the first study demonstrating that 18F-Flotegatide, a click chemistry derived radiotracer, detects atherosclerotic plaques in a mouse model of atherosclerotic vascular disease. 18F-Galacto-RGD has been used before in a similar animal model, but the lengthy tracer preparation hinders the widespread availability of this molecule for clinical use (21). Using click chemistry as an alternative radiolabeling technique, rapid preparation of suitable quantities of 18F-Flotegatide is possible.
In this study performed in a mouse model of atherosclerosis, we observed selective uptake of 18F-Flotegatide in atheroma in the aortic arch. We propose that the relatively short labeling time in contrast to conventional labeling techniques greatly improves the possibility of using this tracer for clinical use. Our results with ORO staining of explanted aorta and with in-vivo CTA demonstrate that plaque is prevalent in Athero mice and that plaque burden is significantly increased in Athero mice compared to both control and WT mice. Our study also shows that plaque is predominantly present in the aortic arch. These observations are consistent with previous studies of atherosclerosis using this model (11, 21). Using ex-vivo PET imaging of explanted aortas and autoradiography of the whole aorta we observed that the highest uptake of 18F-Flotegatide is localized to the same regions of the aorta with increased plaque burden. Our observations are identical to reports by other investigators who examined the uptake of an integrin-targeting tracer in an ApoE-KO mouse model of atherosclerosis (21). To confirm that increased 18F-Flotegatide uptake in Athero mice is integrin αvß3 mediated binding of the tracer to the plaque, we co-injected radiolabeled tracer with unlabeled F-Flotegatide. As shown by other investigators who used 18F-Galacto-RGD for plaque imaging in an ApoE-KO mouse model, we observed that 18F-Flotegatide uptake was undetectable in the aorta by gamma counting when it was coinjected with unlabeled tracer. This blocking result supports our hypothesis that plaque uptake of the tracer reflects specific “R-G-D” tripeptide binding to cell surface integrin αvß3 protein found in atherosclerotic plaque and is not attributable to non-specific binding to plaque. Our histologic studies show that tracer uptake does not strongly correlate with histochemical staining for CD31, a marker for neovascularization.
It has been suggested that rapidly proliferating plaque requires the delivery of oxygen and nutrients, which are provided via neovessels arising from the vasa vasorum (5,6). We therefore expected to find significant staining for CD31 within the plaque. Furthermore, since cell surface integrin expression is considered a hallmark of neovascular endothelium and macrophage density, we expected to find strong staining for both CD31 and Mac3 in aortic sections with elevated uptake of 18F-Flotegatide. Our histologic studies suggest that 18F-Flotegatide uptake may be strongly associated with the enrichment of macrophages and may not necessarily reflect increased neovascularization. These findings are strikingly similar to what was described by Laitinen et al. when examining the ApoE-KO model of atherosclerosis in their studies of 18F-Galacto RGD (21). Similar results were also reported by Waldeck et al. who observed that plaques in their mouse model of carotid artery atherosclerosis exhibited strong staining for macrophages and preferentially extracted a fluorescently labeled tracer targeting integrin αvß3 (18). The integrin αvß3 is expressed on the cell surface of macrophages in early and advanced atherosclerotic plaques where it plays an important role in macrophage differentiation and is essential for the formation of foam cells (15). One would therefore expect to find a preferential uptake of Flotegatide, an integrin targeted tracer by atherosclerotic lesions enriched for macrophages. There is a significant body of evidence supporting the selective accumulation of inflammatory cells into atherosclerotic plaque in this particular model and our results are consistent with observations made in previous studies (11, 21). The relative lack of CD31 staining in the aortic plaques at 10 weeks of treatment with a high-fat diet may suggest that plaque neovascularization occurs at adifferent time point during plaque growth. Our imaging studies may have been performed at a time point where detection of neovascular endothelium proliferation in this model of atherosclerosis was not feasible. Our findings are also consistent with the observation that neovascularization may be relatively short-lived and therefore more difficult to detect in atherosclerotic mouse models as compared to rupture prone plaque in human subjects with atherosclerosis (9,26).
New Knowledge Gained
A radiolabeled integrin-targeting tracer 18F-Flotegatide, synthesized using click chemistry with a significantly shortened labeling time, selectively binds to atherosclerotic plaque in an ApoE-KO mouse model. Flotegatide uptake is strongly associated with markers for macrophage infiltration. This tracer may have potential for clinical imaging of vascular and atherosclerotic plaque inflammation.
Limitations
The major limitation of this study lies in the choice of our model for in-vivo micro-PET imaging. Due to constraints imposed by the small size of the plaque in the aortic arch in this mouse model, cardiac motion and respiratory motion, in-vivo imaging of the aorta was performed in experimental animals after euthanasia. We have heavily relied on ex-vivo imaging to demonstrate tracer uptake by the plaque. However, our studies were designed to demonstrate selective uptake of the tracer by atherosclerotic plaque and our in-vivo, ex-vivo and autoradiographic approaches clearly indicate plaque uptake. Whether this tracer can be used for in-vivo detection of atherosclerotic plaque will ultimately depend on clinical studies performed in human subjects. Furthermore, Laitinen et al. used a similar approach in their studies of 18F-Galacto-RGD uptake by atheroma in an ApoE-KO mouse model and their results mirror our findings (21). Our studies were performed after 10 weeks of high fat diet treatment with the objective of visualizing atherosclerotic plaque when it might express histologic features of vulnerability (27). It is possible a later time point might have resulted in a better correlation between neovascularization and tracer uptake; however, previous studies performed after 20 weeks of high fat diet treatment provided results similar to our observations of a strong association between macrophage infiltration and tracer uptake (21). Determinants of plaque stability in a mouse model of atherosclerosis may be significantly different than what occurs in humans. Even though our results suggest that 18F-Flotegatide uptake is strongly associated with macrophage infiltration in atherosclerotic plaque compared to the density of neovascular endothelium, it may be inappropriate to extrapolate these to the cellular events that occur in vulnerable plaque in humans. Our association studies between plaque uptake of the radiotracer, ORO staining and immunohistochemical staining for surrogate markers of inflammation and angiogenesis were all performed with visual coregistration of micro-PET images, autoradiographs, and gray scale images of immunostained sections. The significant differences in spatial resolution between micro-PET, autoradiography and microscopy of histologic staining may limit the accuracy of our comparisons..
Conclusions
We have synthesized the radiolabeled integrin-targeting tracer 18F-Flotegatide using click chemistry with a significantly shortened labeling time. This tracer selectively binds to atherosclerotic plaque in an ApoE-KO mouse model and this may reflect increased macrophage infiltration. Human studies will be necessary to test the ability of this tracer to serve as a marker for plaque vulnerability.
References
- 1.Libby P. Inflammation in atherosclerosis. Nature. 2002;420:868–74. doi: 10.1038/nature01323. [DOI] [PubMed] [Google Scholar]
- 2.Libby P, Ridker PM, Maseri A. Inflammation and atherosclerosis. Circulation. 2002;105:1135–43. doi: 10.1161/hc0902.104353. [DOI] [PubMed] [Google Scholar]
- 3.Virmani R, Kolodgie FD, Burke AP, Farb A, Schwartz SM. Lessons from sudden coronary death: a comprehensive morphological classification scheme for atherosclerotic lesions. Arteriosclerosis, thrombosis, and vascular biology. 2000;20:1262–75. doi: 10.1161/01.atv.20.5.1262. [DOI] [PubMed] [Google Scholar]
- 4.Kolodgie FD, Gold HK, Burke AP, et al. Intraplaque hemorrhage and progression of coronary atheroma. The New England journal of medicine. 2003;349:2316–25. doi: 10.1056/NEJMoa035655. [DOI] [PubMed] [Google Scholar]
- 5.Moreno PR, Purushothaman KR, Zias E, Sanz J, Fuster V. Neovascularization in human atherosclerosis. Current molecular medicine. 2006;6:457–77. doi: 10.2174/156652406778018635. [DOI] [PubMed] [Google Scholar]
- 6.Virmani R, Kolodgie FD, Burke AP, et al. Atherosclerotic plaque progression and vulnerability to rupture: angiogenesis as a source of intraplaque hemorrhage. Arteriosclerosis, thrombosis, and vascular biology. 2005;25:2054–61. doi: 10.1161/01.ATV.0000178991.71605.18. [DOI] [PubMed] [Google Scholar]
- 7.Finn AV, Nakano M, Narula J, Kolodgie FD, Virmani R. Concept of vulnerable/unstable plaque. Arteriosclerosis, thrombosis, and vascular biology. 2010;30:1282–92. doi: 10.1161/ATVBAHA.108.179739. [DOI] [PubMed] [Google Scholar]
- 8.Purushothaman KR, Sanz J, Zias E, Fuster V, Moreno PR. Atherosclerosis neovascularization and imaging. Current molecular medicine. 2006;6:549–56. doi: 10.2174/156652406778018671. [DOI] [PubMed] [Google Scholar]
- 9.Moulton KS, Vakili K, Zurakowski D, et al. Inhibition of plaque neovascularization reduces macrophage accumulation and progression of advanced atherosclerosis. Proceedings of the National Academy of Sciences of the United States of America. 2003;100:4736–41. doi: 10.1073/pnas.0730843100. [DOI] [PMC free article] [PubMed] [Google Scholar]
- 10.Badimon JJ, Fuster V, Chesebro JH, Badimon L. Coronary atherosclerosis. A multifactorial disease. Circulation. 1993;87:II3–16. [PubMed] [Google Scholar]
- 11.Virmani R, Burke AP, Kolodgie FD, Farb A. Pathology of the thin-cap fibroatheroma: a type of vulnerable plaque. Journal of interventional cardiology. 2003;16:267–72. doi: 10.1034/j.1600-0854.2003.8042.x. [DOI] [PubMed] [Google Scholar]
- 12.Saraste A, Nekolla SG, Schwaiger M. Cardiovascular molecular imaging: an overview. Cardiovascular research. 2009;83:643–52. doi: 10.1093/cvr/cvp209. [DOI] [PubMed] [Google Scholar]
- 13.Finn AV, Jain RK. Coronary plaque neovascularization and hemorrhage: a potential target for plaque stabilization? JACC Cardiovascular imaging. 2010;3:41–4. doi: 10.1016/j.jcmg.2009.11.001. [DOI] [PMC free article] [PubMed] [Google Scholar]
- 14.Underhill HR, Hatsukami TS, Fayad ZA, Fuster V, Yuan C. MRI of carotid atherosclerosis: clinical implications and future directions. Nature reviews Cardiology. 2010;7:165–73. doi: 10.1038/nrcardio.2009.246. [DOI] [PubMed] [Google Scholar]
- 15.Antonov AS, Kolodgie FD, Munn DH, Gerrity RG. Regulation of macrophage foam cell formation by alphaVbeta3 integrin: potential role in human atherosclerosis. The American journal of pathology. 2004;165:247–58. doi: 10.1016/s0002-9440(10)63293-2. [DOI] [PMC free article] [PubMed] [Google Scholar]
- 16.Brooks PC, Clark RA, Cheresh DA. Requirement of vascular integrin alpha v beta 3 for angiogenesis. Science. 1994;264:569–71. doi: 10.1126/science.7512751. [DOI] [PubMed] [Google Scholar]
- 17.Hoshiga M, Alpers CE, Smith LL, Giachelli CM, Schwartz SM. Alpha-v beta-3 integrin expression in normal and atherosclerotic artery. Circulation research. 1995;77:1129–35. doi: 10.1161/01.res.77.6.1129. [DOI] [PubMed] [Google Scholar]
- 18.Waldeck J, Hager F, Holtke C, et al. Fluorescence reflectance imaging of macrophage-rich atherosclerotic plaques using an alphavbeta3 integrin-targeted fluorochrome. Journal of nuclear medicine : official publication, Society of Nuclear Medicine. 2008;49:1845–51. doi: 10.2967/jnumed.108.052514. [DOI] [PubMed] [Google Scholar]
- 19.Winter PM, Morawski AM, Caruthers SD, et al. Molecular imaging of angiogenesis in early-stage atherosclerosis with alpha(v)beta3-integrin-targeted nanoparticles. Circulation. 2003;108:2270–4. doi: 10.1161/01.CIR.0000093185.16083.95. [DOI] [PubMed] [Google Scholar]
- 20.Haubner R, Kuhnast B, Mang C, et al. [18F]Galacto-RGD: synthesis, radiolabeling, metabolic stability, and radiation dose estimates. Bioconjugate chemistry. 2004;15:61–9. doi: 10.1021/bc034170n. [DOI] [PubMed] [Google Scholar]
- 21.Laitinen I, Saraste A, Weidl E, et al. Evaluation of alphavbeta3 integrin-targeted positron emission tomography tracer 18F-galacto-RGD for imaging of vascular inflammation in atherosclerotic mice. Circulation Cardiovascular imaging. 2009;2:331–8. doi: 10.1161/CIRCIMAGING.108.846865. [DOI] [PubMed] [Google Scholar]
- 22.Doss M, Kolb HC, Zhang JJ, et al. Biodistribution and radiation dosimetry of the integrin marker 18F-RGD-K5 determined from whole-body PET/CT in monkeys and humans. Journal of nuclear medicine : official publication, Society of Nuclear Medicine. 2012;53:787–95. doi: 10.2967/jnumed.111.088955. [DOI] [PMC free article] [PubMed] [Google Scholar]
- 23.Walsh JC, Kolb HC. Applications of click chemistry in radiopharmaceutical development. Chimia. 2010;64:29–33. doi: 10.2533/chimia.2010.29. [DOI] [PubMed] [Google Scholar]
- 24.Zhang X, Xiong Z, Wu Y, et al. Quantitative PET imaging of tumor integrin alphavbeta3 expression with 18F-FRGD2. Journal of nuclear medicine : official publication, Society of Nuclear Medicine. 2006;47:113–21. [PMC free article] [PubMed] [Google Scholar]
- 25.Chan TR, Hilgraf R, Sharpless KB, Fokin VV. Polytriazoles as copper(I)-stabilizing ligands in catalysis. Organic letters. 2004;6:2853–5. doi: 10.1021/ol0493094. [DOI] [PubMed] [Google Scholar]
- 26.Heinonen SE, Leppanen P, Kholova I, et al. Increased atherosclerotic lesion calcification in a novel mouse model combining insulin resistance, hyperglycemia, and hypercholesterolemia. Circulation research. 2007;101:1058–67. doi: 10.1161/CIRCRESAHA.107.154401. [DOI] [PubMed] [Google Scholar]
- 27.Johnson J, Carson K, Williams H, et al. Plaque rupture after short periods of fat feeding in the apolipoprotein E-knockout mouse: model characterization and effects of pravastatin treatment. Circulation. 2005;111:1422–30. doi: 10.1161/01.CIR.0000158435.98035.8D. [DOI] [PubMed] [Google Scholar]


