Abstract
We propose a robust method for automated computation of heart rate (HR) from digital color video recordings of the human face. In order to extract photoplethysmographic signals, two orthogonal vectors of RGB color space are used. We used a dual tree complex wavelet transform based denoising algorithm to reduce artifacts (e.g. artificial lighting, movement, etc.). Most of the previous work on skin color based HR estimation performed experiments with healthy volunteers and focused to solve motion artifacts. In addition to healthy volunteers we performed experiments with child patients in pediatric intensive care units. In order to investigate the possible factors that affect the non-contact HR monitoring in a clinical environment, we studied the relation between hemoglobin levels and HR estimation errors. Low hemoglobin causes underestimation of HR. Nevertheless, we conclude that our method can provide acceptable accuracy to estimate mean HR of patients in a clinical environment, where the measurements can be performed remotely. In addition to mean heart rate estimation, we performed experiments to estimate oxygen saturation. We observed strong correlations between our SpO2 estimations and the commercial oximeter readings
OCIS codes: (170.3880) Medical and biological imaging, (100.7410) Wavelets, (100.2960) Image analysis
1. Introduction
Heart rate is one of the important physiological signals of a human body used by medical professionals to judge the physiological state. For example, resting heart rate has been identified as an independent risk factor (comparable with smoking, dyslipidemia or hypertension) for cardiovascular disease [1]. HR monitoring is vital in some cases. For instance, while a rise in intracranial pressure causes a decrease in HR, hypovolemic shock causes an increase in HR.
At present, the gold standard techniques for measurement of the cardiac pulse such as the electrocardiogram (ECG) require patients to wear adhesive gel patches or chest straps that can cause skin irritation and slight pain. The other most used method of measuring cardiac pulse is Photoplethysmography (PPG). PPG is a simple and low-cost optical technique that can be used to measure several clinical parameters such as blood oxygen saturation, heart rate, blood pressure, and cardiac output [2, 3]. The principle, based on PPG consists in observing light intensity variations on the skin to detect the cardiovascular pulse rate. The PPG technology has been used in a wide range of commercially available medical devices such as contact pulse oximeters where red and/or infrared wavelengths are employed to detect the pulse wave. However contact pulse oximeters have their own difficulties such as measuring accuracy of the patients with cold hands or a circulatory disorder.
On the other hand, for instance patients in pediatric intensive care units (PICU) are more susceptible to infections. With non-contact methods, HR monitoring of the patients without causing an infection will be possible. Non-contact detection is possible via high sensitivity cameras and webcams using ambient light as a source of illumination [4]. However PPG signals are highly susceptible to motion induced artifacts, particularly when dealing with webcams and ambient light. Independent component analysis, a blind source separation method, has been proposed by Poh et al. to remove noise artifacts from face imaging PPG signal. Standards of measurement recommend the use of ECG sensors to measure HRV (Heart rate variability) [5]. However, it has been shown that pulse rate variability derived from PPG signals can be a good surrogate of HRV at rest [6]. Although there are many papers in the literature on non-contact heart rate detection, most of the previous work in literature evaluated their algorithm with healthy volunteers [7–10].
We propose a robust method for automated computation of HR from digital color video recordings of the human face. Webcam PPG signals were remotely recorded from 2 healthy volunteers (total 24 experiments at rest, during motion, under different lighting conditions) and 7 PICU patients (intubated and lying on the bed in face up position). In order to investigate the feasibility of the proposed method for clinical applications, we studied the relation between hemoglobin levels of the PICU patients and heart rate estimation errors.
To test whether other physiological parameters can be measured with a simple webcam, we investigated measuring arterial blood oxygen saturation on 6 healthy volunteers and 3 patients.
2. Materials and methods
A flow diagram illustrating the steps involved in our approach to recover the heart rate from the webcam videos is shown in Fig. 1 . The details are explained in the following sections.
Fig. 1.
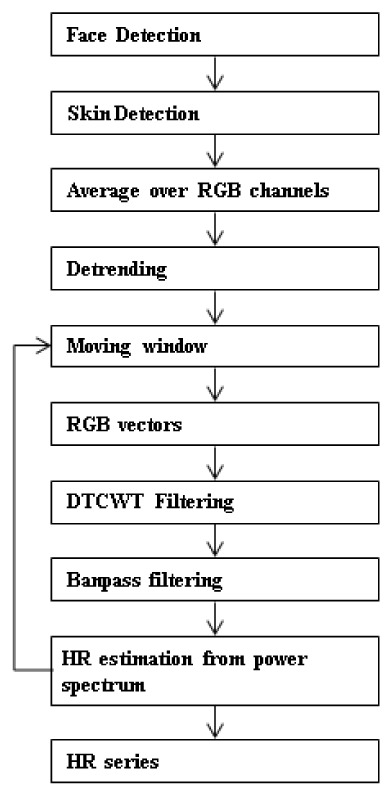
Flow diagram of the proposed method.
2.1 DT-CWT (Dual-Tree Complex Wavelet Transform)
The WT (wavelet transform) constructs a time–frequency representation of a signal. Unlike the Fourier Transform and the short time Fourier Transform, the WT can detect rapid changes in frequencies in time due to its variable window width. The wavelet transform is appropriate for analysis of non-stationary signals. These advantages have resulted in WT being increasingly used for biological signals analysis. But it has shortcomings such as shift variance and aliasing. For the DWT (discrete wavelet transform) the wavelet coefficients tend to oscillate positive and negative around singularities and a small shift of the signal will greatly contribute to those oscillations. This considerably complicates wavelet-based processing, making singularity extraction and signal modeling, in particular, very challenging. Furthermore aliasing occurs due to downsampling. Inverse DWT cancels this aliasing provided if the wavelet and scaling coefficients are not changed (e.g. noise, thresholding) [11]. These problems of Real DWT can be solved using CWT (Complex Wavelet Transform) [12]. CWT is the complex valued extension to the standard DWT.
The CWT uses analytic filters to perform the wavelet analysis. The CWT strategy, that we used in this paper, is Kingsbury’s and Selesnick’s dual tree CWT (DT-CWT). It uses two Real DWT trees to implement its real (tree a) and imaginary (tree b) parts. DT-CWT decomposes a signal in terms of a complex shifted and dilated mother wavelet ψ(x) and scaling function φ(x).
In Fig. 2 , L represents lowpass filters and H represents highpass filters [13]. Each filtering operation is followed by a downsampling by two. The table of coefficients of the analyzing filters in the first level (Table1 ) and the remaining levels (Table 2 ) are given.
Fig. 2.
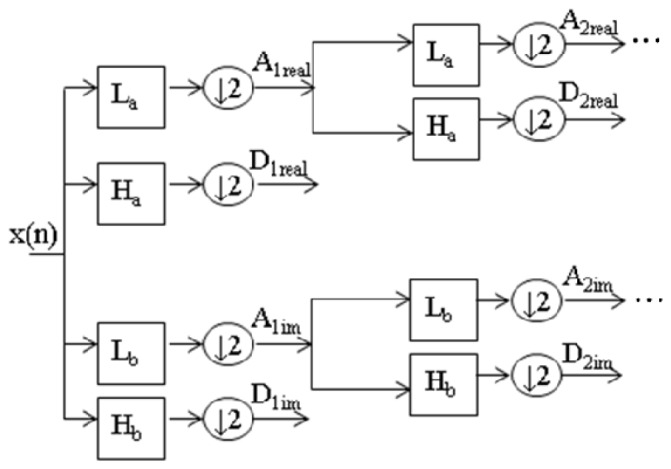
Decomposition with 1D DT-CWT to obtain approximation (A) and detail (D) coefficients at different levels. DT-CWT uses two Real DWT trees to implement its real (tree a) and imaginary (tree b) parts. L represents lowpass filters and H represents highpass filters.
Table 1. First level coefficients of the analysis filters.
| La | Ha | Lb | Hb |
|---|---|---|---|
| 0 | 0 | 0.01122679 | 0 |
| −0.08838834 | −0.01122679 | 0.01122679 | 0 |
| 0.08838834 | 0.01122679 | −0.08838834 | −0.08838834 |
| 0.69587998 | 0.08838834 | 0.08838834 | −0.08838834 |
| 0.69587998 | 0.08838834 | 0.69587998 | 0.69587998 |
| 0.08838834 | −0.69587998 | 0.69587998 | −0.69587998 |
| −0.08838834 | 0.69587998 | 0.08838834 | 0.08838834 |
| 0.01122679 | −0.08838834 | −0.08838834 | 0.08838834 |
| 0.01122679 | −0.08838834 | 0 | 0.01122679 |
| 0 | 0 | 0 | −0.01122679 |
Table 2. Remaining levels coefficients of the analysis filters.
| La | Ha | Lb | Hb |
|---|---|---|---|
| 0.03516384 | 0 | 0 | −0.03516384 |
| 0 | 0 | 0 | 0 |
| −0.08832942 | −0.11430184 | −0.11430184 | 0.08832942 |
| 0.23389032 | 0 | 0 | 0.23389032 |
| 0.76027237 | 0.58751830 | 0.58751830 | −0.76027237 |
| 0.58751830 | −0.76027237 | 0.76027237 | 0.58751830 |
| 0 | 0.23389032 | 0.23389032 | 0 |
| −0.11430184 | 0.08832942 | −0.08832942 | −0.11430184 |
| 0 | 0 | 0 | 0 |
| 0 | −0.03516384 | 0.03516384 | 0 |
2.2 Experimental procedure
We performed three sets of experiments to estimate mean heart rate (with 2 healthy and 7 PICU participants) and oxygen saturation (with 6 healthy and 3 PICU participants). At the first set, twenty-four experiments were conducted indoors to evaluate the HR assessment method on 2 healthy volunteers (Table 3 ). Either indirect sunlight or fluorescent light was used as the illumination source. For healthy volunteers, each experiment in a session lasted 60 s where participants were sitting on a chair in approximately 50 cm from the webcam. In addition, further experiments were conducted in the same manner on PICU patients of both gender and various ages. Experiments were performed at the Tepecik Training and Research Hospital, Turkey. Ethical approval was obtained prior to the study. For patients, face videos are recorded while participants are lying on the bed in face up position. Camera is placed in front of the face of the patients. Oxygen saturation experiments are performed with same conditions as the first set of experiments.
Table 3. Comparison of estimated HR with ECG (Healthy volunteers).
| Volunteer A: Age 14, Male | ||||||
| ECG mean heart beat | 73 | 76 | 78 | 71 | 73 | 71 |
| Estimated (Indirect Sunlight) | 73.8281 | 80.8594 | 80.8594 | 70.3125 | 73.8281 | 77.3438 |
|
| ||||||
| Volunteer B: Age 35, Male | ||||||
| ECG mean heart beat | 71 | 74 | 71 | 64 | 64 | 71 |
| Estimated (Fluorescent light) | 70.3125 | 73.8281 | 73.8281 | 63.2813 | 63.2813 | 70.3125 |
|
| ||||||
| ECG mean heart beat | 67 | 64 | 68 | 71 | 72 | 72 |
| Estimated (Indirect Sunlight) | 66.7969 | 63.2813 | 66.7969 | 70.3125 | 73.8281 | 70.3125 |
|
| ||||||
| ECG mean heart beat | 68 | 71 | 73 | 73 | 74 | 76 |
| Estimated (Indirect Sunlight) | 70.3125 | 70.3125 | 73.8281 | 73.8281 | 73.8281 | 77.3438 |
|
| ||||||
| RMSE | 2.0573 | Correlation | 0.9278 (p<0.001) | Accuracy | 0.9799 | |
2.3 Materials
Laptop’s (Lenovo Thinkpad T430) built-in webcam was used in these experiments. All videos were recorded in color (24-bit RGB with three channels × 8 bits/channel) at 30 frames per second (fps) with pixel resolution of 640 × 480 and saved in AVI format on the laptop. In order to validate our results, ECG measurements are used as reference heart rate values. Hemoglobin levels of the patients are measured with complete blood count. Oxygen saturation measurements (reference values) are performed with the oximeter, Masimo Rad 87.
2.4 Photoplethysmography pulse extraction
The face is automatically detected using a cascade of boosted classifier on the first frame. The method was originally proposed by Viola and Jones [14]. The algorithm returns the bounding box of the face. A skin detection (Fig. 3 ) is performed on the face to detect and gather skin pixels that contain the PPG signal [15]. The face image is converted from RGB color space to YCbCr space. The skin mask is generated from YCbCr color space by setting a threshold on the two channels as follows:
| (1) |
where Cb is the blue chroma and Cr the red chroma of the color space. A spatial averaging operation is then computed using RGB pixel intensities in the region provided by the skin detection, forming the raw signal. To remove slow non-stationary trends in the raw signals, detrending should be applied; otherwise, the spectrum of these raw data would only contain large energy at DC component [16]. The three raw traces are detrended based on a smoothness priors approach proposed in [17], with a regularization parameter λ = 10 (corresponding cutoff frequency is 0.059fs). The detrending method that we used operates like a time-varying finite-impulse response high-pass filter and the regularization parameter λ is related to cutoff frequency of the filter.
Fig. 3.
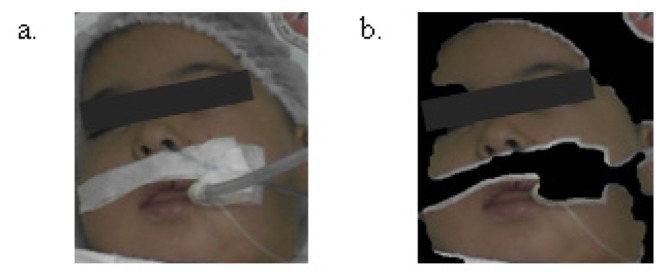
Face (a) and skin detection (b).
Subsequent processing is performed using a moving window with a specified window length (30 seconds) and window overlap (96.7% overlap). Window represents the part of the RGB traces which are considered for extracting the HR at the given instant. A Window moves along the time axis with increment of WindowOverlap (1sec. increment). In order to get better quality signal, a simple mathematical operation on RGB traces in a window is performed. Two orthogonal vectors R-G and R + G-2B are used. The algorithm from Shadinrakar et al [18] was used to stretch the RGB signal and combine the three color channels to give stronger resultant signal.
| (2) |
Combined PPG signals (HB Heart Beat) are then decomposed with three level DT-CWT to reduce artifacts. . Two approximation and six wavelet coefficients are obtained (real and imaginary components of the complex coefficients A3, D1, D2, D3). The frequency band [fm/2: fm] of each detail scale of the DT-CWT is directly related to the sampling rate of the original signal, which is given by fm = fs/2l + 1, where fs is the sampling frequency, and l is the level of decomposition. Since the frequency bands corresponding to the first and second decomposition levels are not in the expected pulse frequency range (15-7.5 Hz and 7.5-3.75 Hz), we totally removed the coefficient vectors of these levels.
Our proposed method uses the detail coefficients at the same scale for the threshold value of the coefficients. The threshold values are calculated as:
| (3) |
where Di represents values of the detail coefficients.
Soft thresholding is applied separately to the magnitudes of the complex wavelet coefficients of the level three.
| (4) |
where x represents noisy coefficients, T represents threshold value and f(x) represents thresholded coefficients. After soft thresholding, denoised signal is obtained by performing inverse DT-CWT.
Denoised signal is processed further to refine the peaks using a bandpass filter (64-point Hamming window, 0.7–4 Hz corresponds to 42-240 bpm). We calculate the Fourier transforms of the time signals to obtain the related power spectrum. We expected that the heart rate frequency corresponds to the highest power in the spectrum. Then heart rate is computed as 60.fhpeak.
Heart rate values obtained for each window are recorded in an array. The most frequent component in the array is considered as the estimate of the heart rate.
In order to show the contribution of the whole signal processing steps to make pulses more visible we plot raw and processed green channel signals (Fig. 4 ).
Fig. 4.
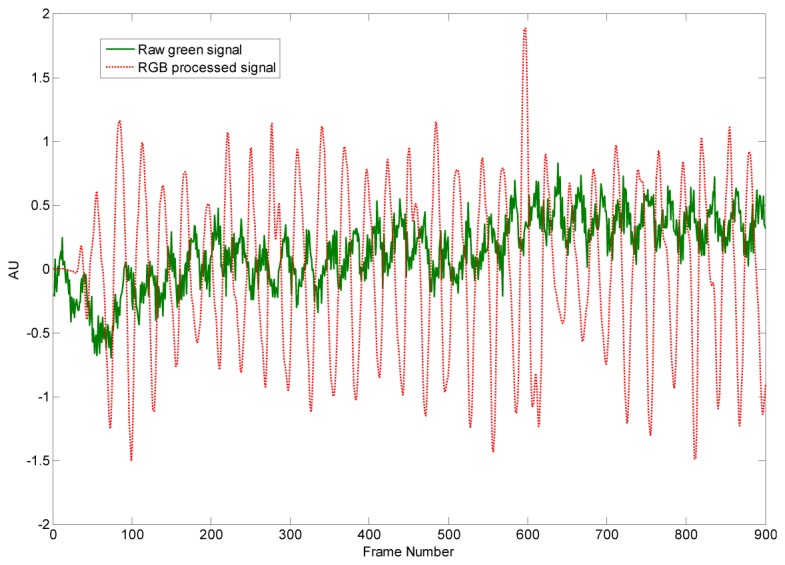
Raw green signal (top) and processed signal (bottom). In order to improve the visibility of the variations the mean value of the raw green signal is subtracted.
2.5 Oxygen saturation
With conventional pulse oximetry “ratio of ratios” method is used for the calculation of oxygen saturation. Two wavelengths are usually chosen (red and near infrared).
| (5) |
where A and B are empirically determined coefficients, Iac and Idc are respectively the amplitudes of the pulsatile (ac) and dc components [19].
In order to estimate oxygen saturation we used red and blue channels where the blue channel is representative of the infrared wavelength used in traditional pulse oximeter. A spatial averaging operation is computed using RB pixel intensities that exist on the face detection. Subsequent processing is performed using a moving window with a specified window length (10 seconds) and window overlap (96.7% overlap). We used mean and standard deviation of the red and blue channels as DC and AC components [20]. We estimated the A and B coefficients by finding the best-fit linear equation between the oximeter readings and the ratios of the red and blue channels.
3. Results
We analyze 24 video recordings (each of them are one minute long) of 2 participants at rest to achieve the mean heart rate. Experiments performed at different lighting conditions (Table 3). The ECG based HR measurement was also taken for each instance, at the same time each video was taken. Experiments show the proposed algorithm works well both under indirect sunlight and fluorescent light.
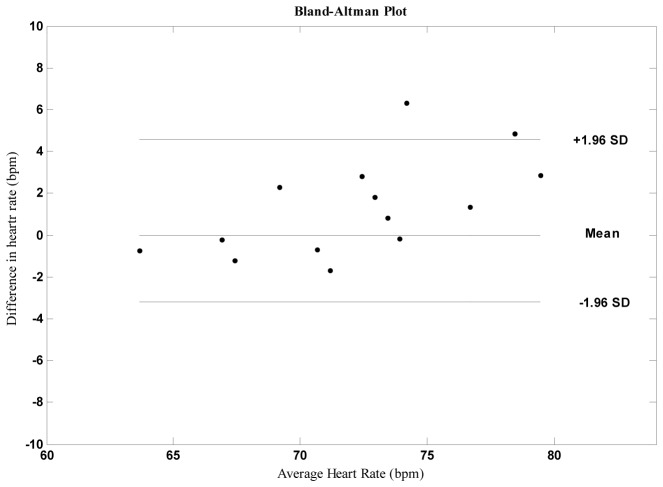
Pearson’s correlation coefficients (Table 3) and Bland–Altman plots (Fig. 5 ) were used to quantify the level of agreement between measurements by the remote (proposed) and contact ECG techniques. In addition average accuracy between the estimate (Est) and the reference (Ref) measurement and RMSE (Root Mean Square Error) were calculated as:
Fig. 5.
The lines represent the mean and 95% limits of agreement.
Mean HR were strongly correlated across statistical parameters, exhibiting r = >0.92. The differences between estimates from contact and remote measurements were plotted against the averages of both systems for HR. Bland-Altman analysis revealed close agreement between the measurements.
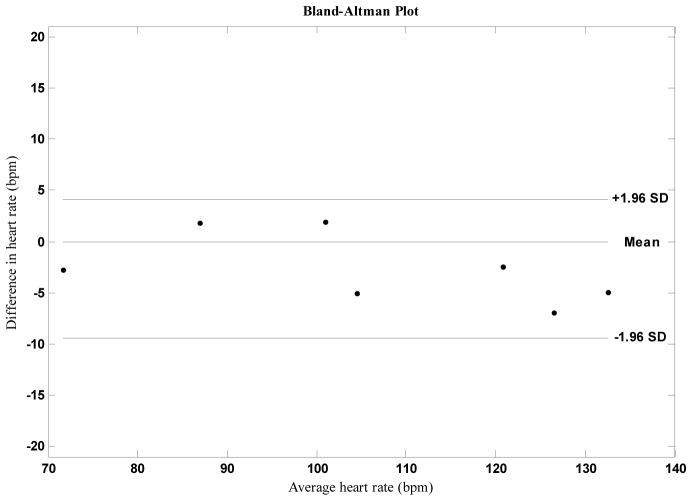
In order to evaluate the performance of the proposed method on PICU patients we performed seven experiments with similar conditions (Fig. 6 and Table 4 ). During the experiments patients were lying on the bed. We also measured the hemoglobin levels of the patients. We observed higher average error rate than the first set of experiments. For normal hemoglobin levels error rates are similar compared with the experiments that we performed with healthy volunteers. For low hemoglobin levels (anemic patients) error increases. We calculated the linear correlation between heart rate error and hemoglobin level and found it to be >0.8, indicating a strong correlation. Since melanin in the epidermis and hemoglobin in the dermis play dominant roles in light absorption, they are responsible for variations in skin color. Heart rate estimation is affected by hemoglobin level. However it is also possible that is affected by higher error rates.
Fig. 6.
Bland Altman plot for experiments with intensive care unit patients.
Table 4. Comparison of estimated HR with ECG (PICU patients).
| Age | Gender | Disease | Hemoglobin (g/100 ml) | ECG | Estimated HR |
|---|---|---|---|---|---|
| 13 years | Female | Diabetic ketoacidosis | 10,9 | 100 | 101.9531 |
| 14 years | Male | Bronchopneumonia | 10,1 | 86 | 87.8906 |
| 1 years | Female | Acute disseminated encephalomyelitis (ADEM) | 11.5 | 122 | 119.5313 |
| 8 years | Male | Arteriovenous malformation (AVM in brain) | 11,9 | 73 | 70.3125 |
| 6 months | Male | Cardiopathy | 8.7 | 135 | 130.0781 |
| 3 years | Male | Epilepsy + Sepsis | 9.4 | 107 | 101.9531 |
| 2 months | Male | Meningococcemia | 8.6 | 130 | 123.0469 |
|
|
|
|
|
|
|
| RMSE | 4.1187 | Correlation | 0.9915 (p<0.001) | Accuracy | 0.9663 |
Small movements of the volunteers and presence of aliased components from artificial light are possible corruption sources. However we observed that the anemia is also a very important factor that affects the non-contact HR estimation.
Comparison of the results with and without DTCWT filtering revealed the contribution of the filtering step, which is not given here for brevity. Based on the results (Table 4), we conclude that our method can provide acceptable accuracy to estimate mean HR of patients in a clinical environment, where the measurements can be performed remotely (average error<3.5%). But more experiments and further improvements are needed especially for low hemoglobin levels. This prospective study continues with more participants.
We calculated oxygen saturation (SpO2) according to Eq. (5) and obtained reference values with commercial Masimo sensor. The A and B coefficients in Eq. (5) are estimated (with 95% confidence bounds) by finding the best-fit linear equation between the oximeter readings and the ratios of the red and blue channels (Fig. 7 ). The best fit linear equation is SpO2 = 101.6-5.834*R.
Fig. 7.
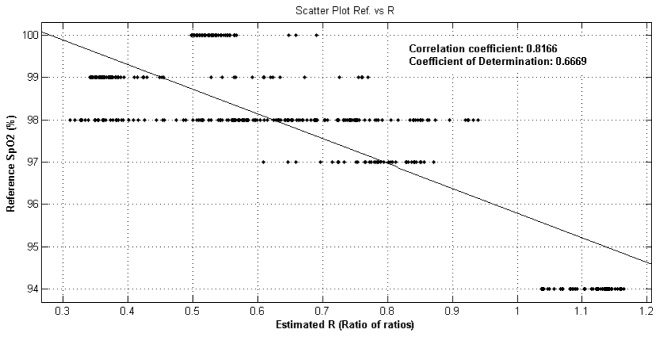
Reference oxygen saturation vs estimated ratios.
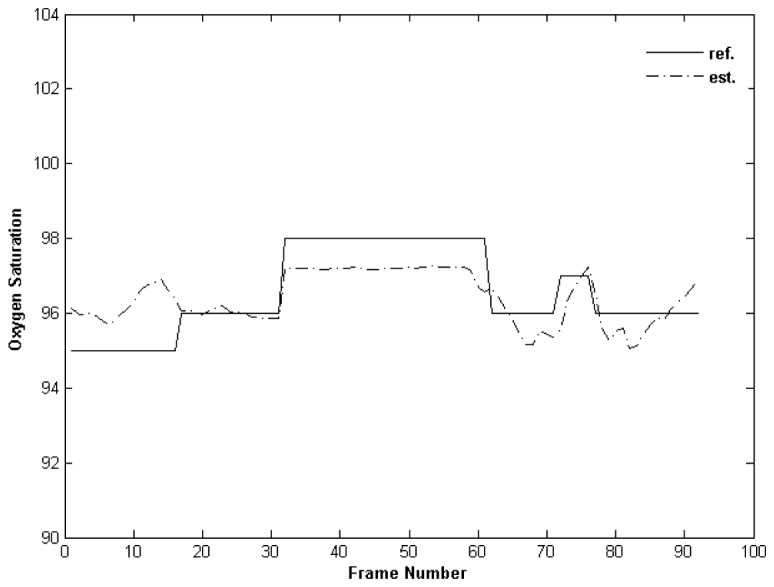
We observed strong correlations between our SpO2 estimations and the Masimo oximeter readings (|r| > 0.81). Since the oximeter readings did not change much during our experiments, we plotted the results of the 6 experiments together and showed that the estimation is able to track the changes in oxygen saturation (Fig. 8 ).
Fig. 8.
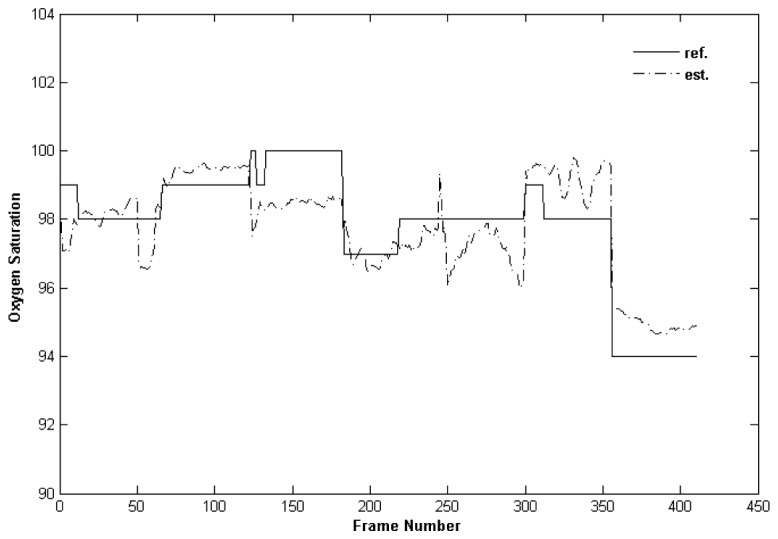
Oxygen saturation experiments with healthy volunteers.
In addition to healthy volunteers we performed 3 experiments with PICU patients (Fig. 9 ). We calculated SpO2 according to linear equation obtained from the previous experiments. We observed a correlation of 0.71 between estimated SpO2 and the oximeter readings.
Fig. 9.
Oxygen saturation experiments with PICU patients.
4. Conclusion
This study presents image and signal processing techniques to remotely assess the mean HR. On the basis of the results from the present study, we have demonstrated the feasibility of using a simple webcam to measure mean heart rate.
DTCWT is one of the most efficient methods for extracting required information from the corrupted data. Experimental results revealed that DTCWT processing of the corrupted data reduced the estimation error.
The presented algorithm seems to be quite effective and easy to use in the daily monitoring of home care patients. In addition, based on the results of the experiments performed in the intensive care units, it can be concluded that our method could provide acceptable accuracy to estimate mean HR of patients in a clinical environment. Thus proposed method would eliminate the need of using single use probes and monitorisation equipment while measuring vital signals.
Experiments performed with anemic patients resulted in higher error rates than others. Hemoglobin plays a dominant role in light absorption and is the main contributor of heart beat induced skin color variations. A lower hemoglobin level results in lower skin color oscillations a more noise in the signal trace. Therefore underestimation of heart rate of child patients (anemic patients) may be due to low hemoglobin levels . Further improvements are needed to reduce the estimation error for low hemoglobin levels.
Also we need to find participants whose saturation readings change substantially during an experiment to able to evaluate the real performance of the method for estimating the oxygen saturation.
Acknowledgments
This study was supported by Scientific Research Projects Coordination Unit of Muğla Sıtkı Koçman University, project number 13/108. The author wishes to thank Dr. Alkan Bal for his comments and help in conducting the PICU experiments.
References and links
- 1.Cook S., Togni M., Schaub M. C., Wenaweser P., Hess O. M., “High heart rate: a cardiovascular risk factor?” Eur. Heart J. 27(20), 2387–2393 (2006). 10.1093/eurheartj/ehl259 [DOI] [PubMed] [Google Scholar]
- 2.Kamal A. A. R., Harness J. B., Irving G., Mearns A. J., “Skin photoplethysmography - a review,” Comput. Methods Programs Biomed. 28(4), 257–269 (1989). 10.1016/0169-2607(89)90159-4 [DOI] [PubMed] [Google Scholar]
- 3.Allen J., “Photoplethysmography and its application in clinical physiological measurement,” Physiol. Meas. 28(3), R1–R39 (2007). 10.1088/0967-3334/28/3/R01 [DOI] [PubMed] [Google Scholar]
- 4.Poh M. Z., McDuff D. J., Picard R. W., “Advancements in Noncontact, Multiparameter Physiological Measurements Using a Webcam,” IEEE Trans. Biomed. Eng. 58(1), 7–11 (2011). 10.1109/TBME.2010.2086456 [DOI] [PubMed] [Google Scholar]
- 5.Camm A. J., Malik M., Bigger J. T., Breithardt G., Cerutti S., Cohen R. J., Coumel P., Fallen E. L., Kennedy H. L., Kleiger R. E., Lombardi F., Malliani A., Moss A. J., Rottman J. N., Schmidt G., Schwartz P. J., Singer D. H., Task Force of the European Society of Cardiology and the North American Society of Pacing and Electrophysiology , “Heart rate variability. Standards of measurement, physiological interpretation, and clinical use,” Eur. Heart J. 17(3), 354–381 (1996). 10.1093/oxfordjournals.eurheartj.a014868 [DOI] [PubMed] [Google Scholar]
- 6.Gil E., Orini M., Bailón R., Vergara J. M., Mainardi L., Laguna P., “Photoplethysmography pulse rate variability as a surrogate measurement of heart rate variability during non-stationary conditions,” Physiol. Meas. 31(9), 1271–1290 (2010). 10.1088/0967-3334/31/9/015 [DOI] [PubMed] [Google Scholar]
- 7.Bousefsaf F., Maaoui C., Pruski A., “Continuous wavelet filtering on webcam photoplethysmographic signals to remotely assess the instantaneous heart rate,” Biomed. Signal Process. Control 8(6), 568–574 (2013). 10.1016/j.bspc.2013.05.010 [DOI] [Google Scholar]
- 8.Sun Y., Hu S., Azorin-Peris V., Kalawsky R., Greenwald S., “Noncontact imaging photoplethysmography to effectively access pulse rate variability,” J. Biomed. Opt. 18(6), 061205 (2013). 10.1117/1.JBO.18.6.061205 [DOI] [PubMed] [Google Scholar]
- 9.M. Lewandowska, J. Ruminski, T. Kocejko, and J. Nowak, “Measuring pulse rate with a webcam; a non-contact method for evaluating cardiac activity,” in Computer Science and Information Systems (FedCSIS), 2011 Federated Conference on(2011), pp. 405–410. [Google Scholar]
- 10.Sun Y., Hu S., Azorin-Peris V., Greenwald S., Chambers J., Zhu Y., “Motion-compensated noncontact imaging photoplethysmography to monitor cardiorespiratory status during exercise,” J. Biomed. Opt. 16, 077010 (2011). [DOI] [PubMed] [Google Scholar]
- 11.Selesnick I. W., Baraniuk R. G., Kingsbury N. C., “The dual-tree complex wavelet transform,” IEEE Sig. Processing Mag. 22(6), 123–151 (2005). 10.1109/MSP.2005.1550194 [DOI] [Google Scholar]
- 12.Kingsbury N., “The dual-tree complex wavelet transform: a new technique for shift invariance and directional filters,” (1998).
- 13.V. Musoko, “Biomedical Signal and Image Processing,” PhD Dissertation, Computing and Control Engineering (Institute of Chemical Technology, Prague, 2005). [Google Scholar]
- 14.Paul V., Rapid Object Detection using a Boosted Cascade of Simple Features, Michael J., ed. (2001), pp. 511–511. [Google Scholar]
- 15.Mahmoud T. M., “A New Fast Skin Color Detection Technique,” Proceedings of World Academy of Science: Engineering & Technology 43, 501–505 (2008). [Google Scholar]
- 16.Akdemir Akar S., Kara S., Latifoğlu F., Bilgiç V., “Spectral analysis of photoplethysmographic signals: The importance of preprocessing,” Biomed. Signal Process. Control 8(1), 16–22 (2013). 10.1016/j.bspc.2012.04.002 [DOI] [Google Scholar]
- 17.Tarvainen M. P., Ranta-aho P. O., Karjalainen P. A., “An advanced detrending method with application to HRV analysis,” IEEE T Biomed. Eng. (N.Y.) 49, 172–175 (2002). [DOI] [PubMed] [Google Scholar]
- 18.Sahindrakar P., Haan G. de, Kirenko I., “Improving Motion Robustness of Contact-less Monitoring of Heart Rate Using Video Analysis,” in Technische Universiteit Eindhoven, Department of Mathematics and Computer Science (2011). [Google Scholar]
- 19.Tarassenko L., Villarroel M., Guazzi A., Jorge J., Clifton D. A., Pugh C., “Non-contact video-based vital sign monitoring using ambient light and auto-regressive models,” Physiol. Meas. 35(5), 807–831 (2014). 10.1088/0967-3334/35/5/807 [DOI] [PubMed] [Google Scholar]
- 20.Scully C. G., Lee J., Meyer J., Gorbach A. M., Granquist-Fraser D., Mendelson Y., Chon K. H., “Physiological Parameter Monitoring from Optical Recordings With a Mobile Phone,” IEEE Trans. Biomed. Eng. 59(2), 303–306 (2012). 10.1109/TBME.2011.2163157 [DOI] [PMC free article] [PubMed] [Google Scholar]


