Abstract
Abstract: Measurement of bioluminescent or fluorescent optical reporters with an implanted fiber-optic probe is a promising approach to allow real-time monitoring of molecular and cellular processes in conscious behaving animals. Technically, this approach relies on sensitive light detection due to the relatively limited light signal and inherent light attenuation in scattering tissue. In this paper, we show that specific geometries of lensed fiber probes improve photon collection in turbid tissue such as brain. By employing Monte Carlo simulation and experimental measurement, we demonstrate that hemispherical- and axicon-shaped lensed fibers increase collection efficiency by up to 2-fold when compared with conventional bare fiber. Additionally we provide theoretical evidence that axicon lenses with specific angles improve photon collection over a wider axial range while conserving lateral collection when compared to hemispherical lensed fiber. These findings could guide the development of a minimally-invasive highly sensitive fiber optic-based light signal monitoring technique and may have broad implications such as fiber-based detection used in diffuse optical spectroscopy.
OCIS codes: (000.4430) Numerical approximation and analysis, (060.2300) Fiber measurements, (170.3660) Light propagation in tissues, (170.5280) Photon migration, (170.7050) Turbid media
1. Introduction
Fiber-optic probes are widely used as light delivery or collection tools for biological tissues and other turbid media [1, 2]. Single optical fiber-based probes allow a simple way for minimally invasive measurement of light signal arising from deep or hardly accessible anatomical regions. Hence the measurement of bioluminescent or fluorescent optical reporters with an implanted thin fiber-optic probe is a promising approach to allow real-time monitoring of molecular and cellular processes in awake behaving animals [3]. Next generation approaches must have the sensitivity to detect signals from a few hundred cells within deep tissue locations and the capacity to concurrently monitor signals from freely moving animals. However, key limitations remain to be overcome: extremely low bioluminescence or fluorescence signal and inherent light attenuation in scattering tissue. Thus, improved approaches should enable very sensitive light detection under limited signal-to-noise conditions. In addition, it is important to collect as many photons as possible directly near the target cell location, and minimize the wasting of valuable photons.
So far only limited research has been conducted on single fiber optic probe configurations for enhanced light collection without considering the scattering effect of media (in non-scattering media) [4]. Several groups have optimized fiber-optic probes in contact or distant collection configurations with semi-infinite scattering medium to enhance photon collection [1, 5–10]. However, these approaches are unsuitable for implantable use because their approaches were restricted to intact diffuse reflectance [1, 5, 6] or depth-resolved fluorescence collection on the epithelial tissue [7, 8] or rely on bulky fiber-optic bundle design [9, 10].
In this paper, we propose a novel lensed fiber probe configuration and characterization to enable very sensitive photon collection through a coupled optical fiber light guide. Specifically, we demonstrate that a thin implantable lensed fiber interface allows improved photon collection in turbid tissue up to 2-fold more than that of conventional bare fiber probes both theoretically and experimentally. The spatial dependence of photon signal collection was quantified by Monte Carlo (MC) simulation to determine relevant probe-to-source distance and optimal probe tip geometry. The collection efficiency of conventional fiber and specific designs of lensed fibers (hemispherical and axicon) were simulated, and the results were corroborated by experimental data from tissue phantoms.
2. Methods
2.1 Theory of photon collection for the flat-polished bare fiber
First, we examined the theory of photon collection for flat-polished bare fiber under a non-scattering scenario based on the derivation by Engelbrecht et al. [11], and extended the formulation to scattering and lensed-fiber conditions. The light source was assumed to be a simple point-like source on-axis (r = 0) with isotropic emission in water solution (n = 1.33) for ease of analysis.
For any fiber-based photon collection system, two criteria govern the overall collection efficiency: first, the spatial distribution of photons entering the core aperture (Core-limit) at the fiber end; and second, the angular direction of the photons that enter and are guided through the fiber (NA-limit). As depicted in Fig. 1 , the first factor is closely related to the solid angle covered by the core aperture with respect to the position of the optical source (Ωcore) that is given by S1/z2, where S1 is the area of the fiber core aperture and z is the axial distance of the source from the fiber end. If the source is positioned on the fiber axis, it is simply written as
| (1) |
with θcore = tan−1(rcore/z) where rcore is fiber core radius. The fraction of photons entering the core aperture is achieved by normalizing it to the full solid angle 4π, that is Ωcore/4π.
Fig. 1.
Schematic diagram of the photon collection geometry and analytically obtained axial collection efficiency profiles. (A) Schematics of the axial photon collection geometry and parameters under non-scattering condition. (B) Diagram of general possible photon collection paths under scattering conditions. (C) Axial collection efficiency η (blue line; maximum at ΩNA/4π ratio) and fraction of photons entering the core aperture (red dashed line; Ωcore/ΩNA ratio) under non-scattering conditions. (D) Zoomed plot for the axial collection efficiency η under non-scattering conditions.
The second factor relies on the acceptance solid angle (ΩNA) which is related to the NA of the fiber. When the sample is a turbid tissue, approximately half of the number of photons (upper hemisphere) reaches the fiber end face when the optical source in contact with the fiber tip (z = 0) while the other half of the photons undergo scattering events (See Fig. 1(B)). Thus the core aperture solid angle Ωcore reaches its maximum of 2π when the fiber is placed in contact with the source (θcore = π/2), and it drops by z−2 as the probe-source distance increases while the core aperture area S1 is fixed.
However, the effective acceptance solid angle Ωeff covered by the fiber entrance is limited by the fiber acceptance angle θNA = sin−1(NA/n). The maximal collection efficiency of the flat-polished bare fiber ηmax is thus obtained by normalizing the acceptance solid angle ΩNA by the full solid angle 4π, i.e. ΩNA/4π. Unfortunately, ηmax is expected to be 2.2% for the high-NA multi-mode fiber (0. 39 NA) used in our experiment, where ΩNA = 2π(1-cosθNA) = 0.27.
If the source is located close to the fiber (i.e. z < zNA) then the photon collection is limited by ΩNA, and it drops like Ωcore as the distance z increases (i.e. z > zNA). Thus, the overall collection efficiency is determined by the smaller of the two solid angles (Ωcore and ΩNA), and the general expression of the collection efficiency for the bare fiber is finally given by [11]
| (2) |
In Fig. 1(C), we have represented the fraction of photons entering the fiber core aperture (Ωcore-to-4π ratio; red dotted line with right axis) and the depth-dependent collection efficiency η (blue line) as a function of distance z. The collection efficiency η stays constant until the z reaches to the depth of NA-limit (zNA) over which the efficiency is truncated from the Ωcore-to-4π ratio to the maximal collection efficiency ηmax. NA-limit depth is simply calculated from the trigonometric-ratio of rcore/tan(θNA) = 326 μm. For clarity, a magnified view of the collection efficiency η depicted by the blue line in Fig. 1(C) is shown in Fig. 1(D).
2.2 Theory of photon collection for lensed fibers in scattering samples
We next examined the collection of photons for lensed fibers embedded in scattering tissue. For implantable fiber-based photon detection, the probes must be stereotaxically inserted as close to the deeply-seated photon emission site. If the fiber end is precisely positioned on the emission site without any margin of error, then the photon propagation regime can be viewed as ballistic (non-scattering). However, in reality, exact positioning of the fiber end at the source site with minimal fiber-source distance is not technically feasible due to the opacity and solidity of biological tissue. As a consequence, most photon collection would occur through intermediate scattering regime (0 < z < MFPt = (1/μs)/(1-g) = 673 μm; MFPt is transport mean free path) where collection efficiency η is influenced by geometric and scattering loss. Unfortunately, no reasonable analytical estimation of the collection efficiency in scattering media exists in this intermediate regime. Therefore, we used the MC method as a viable solution to predict the fraction of photons collected under scattering conditions.
Moreover, the ultimate aim of this work is to define optimal fiber distal shapes that maximize photon detection by designing the micro lensed-fibers. Although altered distal shapes may not be sufficient enough to enhance the signal collection of photons travelling in random directions, weakly scattered photons somewhat preserve their initial launching direction within the middle scattering regime (i.e. z < MFPt) due to the dominance of the forward scattering in the biological tissue. Hence there exists an opportunity to make use of the focusing ability of the distal lens.
Given the inevitable offset in probe positioning, we simultaneously considered two factors to improve probe design: (1) achieving maximum signal gain through the focusing power of a micro lens, and (2) maintaining the increased gain factors in both the axial and lateral directions for entire range.
A single focal lens is designed to have the shortest focal length with hemispherical curvature (100 μm radius). With several lens materials, the focal length f is calculated as 831, 578 and 289 μm for the refractive index n of 1.49, 1.56 and 1.79, respectively using the lens maker’s formula. Clearly, there could be various aspheric distal lens shapes that achieve further signal improvements. However, more importantly, the enhanced signal gain has to be preserved over a wide range near the target due to the difficulty in accurately locating the probe position. In this situation, it would be beneficial to vary the focal power of the lens along with depth since the tissue turbidity continuously alters the angular distribution of the photons. Therefore, we also introduced a generalized multifocal lens, a so-called axicon, that takes a radially symmetric conical shape to increase depth of field (DOF) [12]. The axicon lens continuously modulates the optical power with the lateral polar coordinate, and therefore provides an axially elongated focal field. In order to quantify the effects of the improved DOF on the photon collection, we conducted numerical simulations and experiments comparing different lens shapes to the conventional flat fiber.
2.3 Optical design for collection efficiency measurement
We studied photon collection efficiencies of optical fibers with various shapes and optical properties at the distal tip. The model system must have unambiguous reliable reproducibility for an emission source within a turbid sample.
Reproducible modeling of artificial photon emission within the scattering tissue is done by assuming the emission source has a two-dimensional disk-like shape with uniform fluence rates across the corresponding numerical aperture (NA). Numerical simulation was performed based on this model, and the overall optical setup schematic is depicted in Fig. 2 .
Fig. 2.

Schematic diagram of the fiber optic-based photon collection measurement system. (A) Experimental layout of the overall measurement system. (B) Schematic drawing of the photon collection path through the scattering samples.
Ideal point-like and sphere-shaped volumetric sources with isotropic photon emissions were further studied and presented in Appendix 1-2 and 4 (See Figs. 10–12, and 14). The effect of changes in scattering coefficient and fiber diameter are also provided in Appendix 5 and 6.
We used a precision pinhole of 50 μm in diameter (P50S, Thorlabs) to make the disk-like optical source mimicking the photons emerging from emission source in the specimen. The light from a Green LED (530 nm; M530L3, Thorlabs) is relayed through an objective lens (LUMPlanFl 40XW, NA 0.8, Olympus) to generatee a disk-like source on the pinhole aperture. The light passing through the pinhole is diverged within a specific angle according to the effective focal power of the objective, and the corresponding maximum divergence angle is measured to be 25.85 degree (θobj ; NA 0.58) in water solution (refractive index n = 1.33). The emerged light from the pinhole is transported through scattering (tissue-like phantom and mouse cortex slice) or non-scattering (distilled water) samples, and is eventually captured by the fiber for collection.
The depth-dependent collection efficiency is measured with a commercially available power meter (PM100D, Thorlabs) coupled to the optical fibers while varying the probe-source distance z by 50 μm steps using a precision micromanipulator (MN-153, Narishige, Tokyo, Japan). Optical fiber probes (200/230 μm core/cladding diameter, 0.39 NA) having conical, hemi-spherical and flat polished tips with different lens material (silica and polymer) were custom-ordered from WT&T Canada based on the results of our simulation, and used for the measurements (Fig. 3 ). The physical properties of each fiber are given in Table 1 .
Fig. 3.

Custom-made flat polished and micro-lensed fibers. (A) Flat polished bare fiber. (B) Axicon lensed fiber with silica tip. (C) Hemispherical lensed fiber with silica tip. (D) Hemispherical lensed fiber with polymer tip.
Table 1. Physical properties of the micro-lensed fibers used for the experiments.
| Lens type | Lens shape | Lens material (n at 530 nm) | Core material | Core/Cladding diameter |
|---|---|---|---|---|
| Flat polished | - | - | Silica | 200/230 μm |
| Axicon | 5 ± 0.3° base angle | Silica (1.49) | Silica | 200/230 μm |
| Hemispherical 1 | ~100 μm radius | Silica (1.49) | Silica | 200/230 μm |
| Hemispherical 2 | ~100 μm radius | Polymer (1.56) | Silica | 200/230 μm |
2.4 Tissue phantom preparation
The scattering phantom is prepared from 0.5 μm diameter polystyrene microspheres (Polybead, Polysciences, Inc) diluted in a pure water solution according to the Mie theory [13]. This concentration yielded a scattering coefficient μs of 9.9 mm−1 and anisotropy g of 0.85, which was carefully chosen to have similar optical properties to mammalian brain tissue (gray matter) at the source wavelength reported in literature [14]. Prior to experiments, the solution was mixed on a vortex mixer (SLV-6, SeouLin Bioscience, Korea) to avoid aggregation and inhomogeneity. The mixed scattering solution was immediately deposited on a 5 mm thick pinhole-container with the pinhole on the bottom for the measurements of light collection efficiency. A thin transparent tape was attached on the upper side of the pinhole aperture to prevent leakage of the solution through the pinhole.
2.5 Mouse brain slice preparation
All animal experiments were performed with protocols approved by the Institutional Animal Care and Use Committee (IACUC) of the Gwangju Institute of Science and Technology. An 18-week-old female C57BL/6 mouse (DBL, Eumseong, Korea) brain was harvested following whole-body perfusion with PBS (phosphate buffer saline). Cortical tissue slices ~2 mm thick were obtained using a brain matrix (ROBOZ Surgical Instrument Co). The cortex slice was placed in the pinhole container to conduct the collection efficiency measurements (Fig. 9(A)).
2.6 Monte Carlo simulation methods
In order to understand the collection efficiency of the bare and hemispherical and axicon lensed fibers (See Fig. 4(C) ), an in-house-developed Monte Carlo (MC) code was employed. The simulation consists of a light source and focusing objective that illuminate the pinhole aperture (See Fig. 2 and Fig. 4(A)). We assume that the aperture is uniformly illuminated, and the divergence of light from the pinhole, specified by the effective numerical aperture of the objective, exhibits even intensity distribution between 0 and the maximum divergence angle (θobj). The emitted photons then undergo random scattering throughout the tissue up until hitting the distal surface of the collecting fibers.
Fig. 4.
Schematic representation of the Monte Carlo simulation method to calculate photon collection with lensed fiber geometry. (A) Geometry of the collection path and useful parameters. (B) Flow chart of the simulation program for the lensed fibers. (C) Various distal shapes of the lensed fibers used in the simulation.
A random length of travel for each scattering event Ls is sampled from the usual relation to have an average value of 101 μm (scattering mean-free path MFPs = 1/μs = 101 μm; μs = 9.9 mm−1) [15]. The cosine of the deflection angle is generated from the Henyey-Greenstein phase function with anisotropy factors g of 0.85 [16]. Unlike conventional approaches [15], the turbid tissue is further assumed as non-absorbing medium (μa = 0; μa is tissue absorption coefficient) and the photon is traced individually in a quantum fashion instead of a weighted photon packet. Photons that reach the distal lens of the fibers are refracted according to the vectorial Snell’s law [17], and then transmitted toward the fiber end face without any scattering event (this step is omitted for the bare fiber due to the absence of geometrical lens structures). The incident direction of photons on the fiber end face is analyzed to determine whether they enter within the acceptance angle of the collecting fiber (θNA). Photons, which successfully strike the fiber core aperture (“Core-limit criterion”) and pass the NA-related acceptance angle criterion (“NA-limit criterion”) are counted in a quanta manner to yield the collection efficiency at the relevant depth z (and further normalized to the total launched number of 105 photons).
Maximum number of scattering events for each photon was restricted to 50 events, after which the corresponding photon was regarded as lost for collection. This is also reasonable assumption since the scattering coefficient of the physiologically relevant biological tissue is over two orders of magnitude higher than the absorption coefficient.
The challenging problem in characterizing the performance of the lensed fibers in turbid tissue is handling the geometric structure of the lens. To meet our goal, we adopted the ray/surface (sphere and cone) intersection algorithms for our photon transport model [17]. This is in contrast to currently available MC variants supporting the complex surface [18–21], since they mostly rely on meshing the surface with two-dimensional geometric primitives (triangle and polygon). Such direct utilization of the three-dimensional geometric primitives reduces the meshing error from approximations of the cone and sphere with the flat pieces, and avoids computational inefficiency from using the dense mesh.
In order to find the exact position of photons on the distal lens, the ray/surface intersection test is performed after each scattering event. In detail, ray/sphere and ray/cone intersection tests are selectively executed for the hemispherical and the axicon lensed fiber, respectively. We also performed the simulation for negative hemispherical and axicon lensed fibers (See Fig. 4(C); Unless specified as “negative” explicitly, the described axicon and hemispherical lensed fibers are positive ones throughout the description). The overall flowchart of our simulation model for the lensed fibers is depicted in Fig. 4(B).
For the bare fiber simulation, the photon is scattered as usual without the ray/surface (sphere and cone) intersection test due to the absence of the lens surfaces. Instead, ray/plane intersection test is performed to find the position of the photon on the fiber aperture when the photon passes through the plane containing the fiber end face (boundary plane, See Fig. 4(A)). Fiber coupling, transmission losses and losses from the detector are ignored for all modeling processes.
3. Results and discussion
3.1 Characterization of bare fiber collection efficiency
Before testing for enhanced photon collection of the lensed fibers, we first performed numerical simulations for the standard bare fiber as a reference under scattering and non-scattering conditions. The simulations were performed according to the experimental conditions discussed in Section 2, and thus the disk-like optical source (50 μm diameter, 0.58 NA) was simulated instead of the ideal point like source. The corresponding axial distribution of the collection efficiency is further supported by the experimental measurements (correlation coefficient calculated as 0.977 and 0.998 for non-scattering and scattering phantom, respectively).
Although it was not a concern with the ideal point-like source, the overall attenuation curves for the non-scattering sample represented in Fig. 5 is quite similar to those of the analytical prediction on Fig. 1(D), except for a noticeable increase in the overall collected fraction of photons (Compare the left axes of Figs. 1(D) and 5(A)). The difference is due to the restriction of the angular spectrum of the emission source to Ωobj. Therefore, the theoretical maximum collection ηmaxobj is calculated by normalizing the acceptance solid angle ΩNA to the experimental solid angle Ωobj (ΩNA/Ωobj; 42.8%), which is approximately 20 times higher than the previous calculation (ηmax = 2.2%).
Fig. 5.

Axial profiles of the collection efficiency η (on-axis) for non-scattering and scattering samples. (A) Collection efficiency of the bare fiber for the non-scattering sample (blue line) and for the tissue-like scattering sample (red line). Solid lines (blue and red) represent simulated collection efficiencies. Black round and square marks represents measured collection efficiencies. Profiles for the fraction of photons entering the core aperture are plotted with gray color (left-axis). (B) Semi-logarithmic representation of the efficiency and the fraction of photons entering the core aperture for the bare fiber. Note the change of the exponential decaying slope below and above zNA for scattering collection case. Analytical non-scattering collection normalized to experimental solid angle Ωobj is given for easy comparison (Green dashed line).
Contrary to the non-scattering case, we noticed a significant decrease in the collection efficiency as soon as the fiber distal end is pulled away from the source in the scattering sample. Also, it is noteworthy that a steeper exponential attenuation slope is observed roughly over zNA due to the combined effects of scattering and NA-limit geometric losses (Fig. 5(B) red line
As can be seen in Fig. 5, both the scattering and geometric (NA-limit) losses were taken into account in the overall collection profiles. Higher scattering coefficient (or tissues with significant absorption) would universally decrease the collection efficiency. Detailed analysis of the effect of tissue optical coefficient for different fiber geometries are given in Appendix 6.
3.2 Characterization of collection efficiency for the different types of fibers
To demonstrate the collection gains for the lensed fibers, collection efficiency for the lensed fibers with various distal shapes (positive/negative hemispherical/axicon lens; See Fig. 4(C)) and physical properties (lens materials and base angle of axicons) are evaluated. Several remarkable characteristics regarding the collection efficiency of the lensed-fibers can be deduced from the simulation results depicted in Fig. 6 .
Fig. 6.
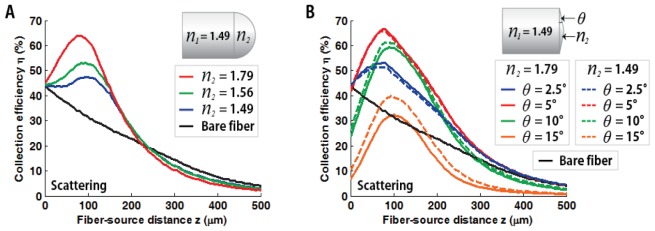
Simulated axial profiles of the collection efficiency for hemispherical and axicon-lensed fibers in a scattering sample. (A) The collection efficiency profiles for hemispherical-lensed fibers as a function of different refractive indexes (n = 1.49-1.79). (B) The collection efficiency profiles for axicon-lensed fibers depending on the different base angle (2.5-15 degree) and lens materials (solid lines: n = 1.79, dashed lines: n = 1.49). The bare-fiber collection profile is also represented in the two figures with a black line as a reference.
While the refractive index n increases from 1.49 to 1.79, the peak collection efficiency of the hemispherical lensed fiber increases in accordance with the decrease of the focal length f (831 to 289 μm; See Fig. 6(A)). This emphasizes the paramount advantage of using a micro-lens with a shorter focal length (f < zNA) to maximize photon collection.
In the case of the axicon-lensed fiber, however, the collection efficiency observed was less sensitive to the lens material (n) because of the multi-focal characteristic and the relatively short distance travelled by the photons through the lens (See Fig. 6(B)). Instead, the collection efficiency of the axicon-lensed fiber appears to be strongly dependent on the base angle θ. When θ increases from 2.5 to 5 degrees, the collection maxima increased in accordance with the reduction of the DOF (the reduced DOF of the axicon can be regarded as the increased focal power of hemispherical lens). As similar to the increasing focal power of the hemispherical lens on the fiber tip, small increment of the axicon base angle θ (< 5 degrees) dramatically reduces angular spectrum of photons to match with the effective acceptance angle of the fiber. However, further increases in the cone angle (> 5 degrees) show decreases in collection efficiency. This is due to the fact that the angular acceptance (ΩNA) of the fiber limits the collection for excessively refracted photons. Furthermore we observed a significant reduction in the collection efficiency of all the negative lenses used (hemispherical and axicon; data not presented). This can be explained by the increase in the angular spectrum of the refracted photons at the fiber distal end, which results in an excess of the maximum acceptance solid angle ΩNA for a greater number of photons.
Interestingly, the observed collection maxima do not occur at the focal length of the lenses, but instead occur at approximately 1 MFPs for all cases irrespective of lens types, i.e. hemispherical or axicon (Figs. 6(A) and 6(B)). This implies that the main parameter determining the location of the collection maxima is not the focal length f. To clarify the ambiguous mechanism of the collection peak formation, additional simulation is performed with an ideal point-like source for the scattering and non-scattering medium, and the details of the analysis is reported in Appendix 1. Briefly, for the hemispherical lens, the collection maxima formed at around 1 MFPs; resulting from the combined effects of the single focal nature of the hemispherical lensed-fiber and hemispherical geometric structure of the distal tip which eventually diminishes the total number of photons entering the lens surface. On the other hand, with axicon-lensed fibers, the formation of the collection peak is influenced by the size of the emission source due to the inherent multi-focal nature of the axicon lens. Thus, if the source is an ideal point-like source (e.g., emitted from a small focal volume like a two-photon excitation), the collection peak will be located at zero-depth (z = 0). However, if the source has some dimension, off-axis displacement of the marginally distributed photons significantly reduces near-surface photon collection. Therefore, the collection peak is formed at between 0 and zNA, which is around 1 MFPs in our configuration (50 μm disk-like source).
3.3 Spatial dependence of collection efficiency for different types of fibers
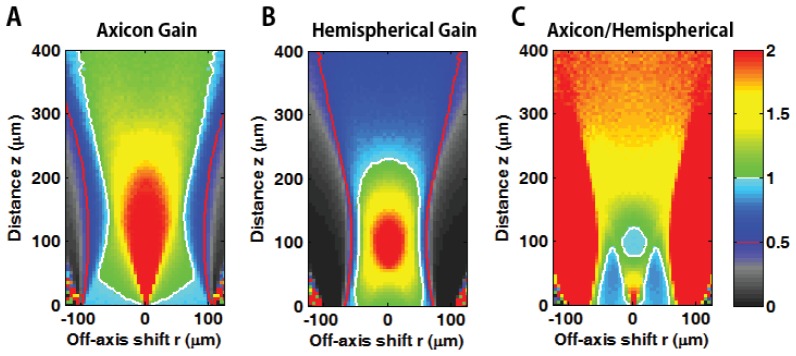
The spatially distributed collection efficiency and expected gain for the individual fibers are simulated in Fig. 7 and Fig. 8 , respectively. The collection efficiency of the lensed and bare fibers strongly depends on both the fiber-source distance z and lateral shift r from the optical axis (Fig. 7). Both the axicon and hemispherical lensed fibers provide enhanced photon detection with a rapid off-axis gradient in collection efficiency.
Fig. 7.
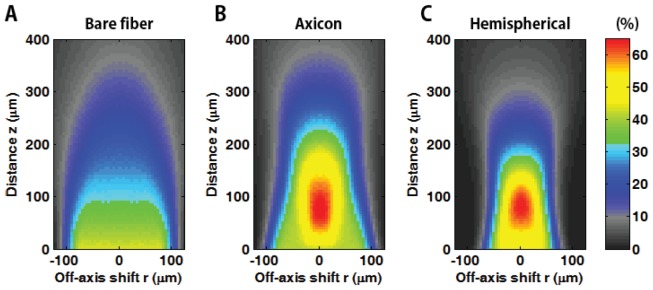
Two-dimensional spatial distribution of the collection efficiency for different shapes of distal lenses in scattering medium: (A) bare, (B) axicon, and (C) hemispherical lensed fibers. The radial coordinate r gives the lateral dependency of the collection efficiency and axial z coordinate provides depth-dependent collection efficiency.
Fig. 8.
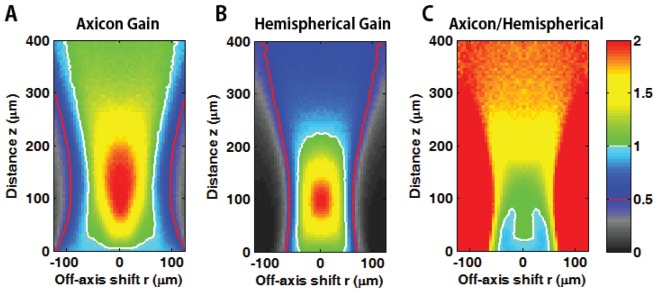
Relative signal gain among the different fiber geometries. Spatial distribution of the collection gain for (A) axicon-lensed and (B) hemispherical fibers as compared to the bare fiber. White contours represents the collection gain of 1; improved photon collection over the bare fiber shown by the warmer color region. (C) Relative signal gain between axicon and hemispherical fibers. The figure clearly demonstrates that the axicon lensed fiber provides enhanced photon collection over a much wider range than the hemispherical counterpart, except very near the region of the fiber tip.
We further characterized the spatial distribution of the axicon-to-hemispherical gain factor, which is defined by ratio of the axicon gain to the hemispherical gain. Figures 8(A) and 8(B) represent relative signal gains for the axicon and hemispherical fibers, respectively. Note that the white and red contour indicate the gain of unity and 0.5, respectively in Fig. 8, and details of the lateral collection profiles at different distances are reported in the Appendix 3.
The simulation results demonstrate that both the axicon and hemispherical lensed fibers provide up to a 2-fold signal enhancement at approximately 100 μm in depth and the signal gain is gradually decreases. We also found that the relative gain of the axicon is roughly 1.5 to 2 fold of the hemispherical counterpart for larger distances (over ~1.5 MFPs) and comparable for shorter distances (See Fig. 8(C)). Notably, the overall performance of the axicon lensed fiber was observed much better over the wider range except for very small region near-fiber off-axis with collection efficiency of 90% compared with the hemispherical lensed-fiber (See white contour and colorbar of Fig. 8(C)). The collection efficiency of axicon lensed fiber with unity gain with respect to bare fiber is roughly over the lateral shift of ~70 μm at ~2 MFPs (See the white contour in Fig. 8(A)), whereas the hemispherical lensed fiber case provides a smaller extra collection area (See spatial expansion of the contours in Figs. 8(A) over 8(B)). This represents a great benefit of the axicon lensed fiber since the opaqueness and solidity of biological tissue may pose a significant limitation on precise probe positioning especially in in-vivo applications.
3.4 Experimental collection efficiency for scattering samples – tissue phantom and brain slice
The enhanced collection performance of the lensed fibers was further experimentally examined using the scattering tissue phantoms and the acute cortical slices of the mouse brain described in Section 2.1-3. Figure 9 shows the measured axial collection efficiency and fitted spline data for the different fiber tips. The simulated data illustrated in Fig. 6 are plotted again with dotted lines for easy comparison with the measurement data in continuous lines. For each probe geometry, three independent measurements are performed with freshly prepared scattering samples and brain slices. Note that the measurements conducted with the acute brain slice were performed from a distance of 50 μm due to the difficulty of exact probe positioning.
Fig. 9.
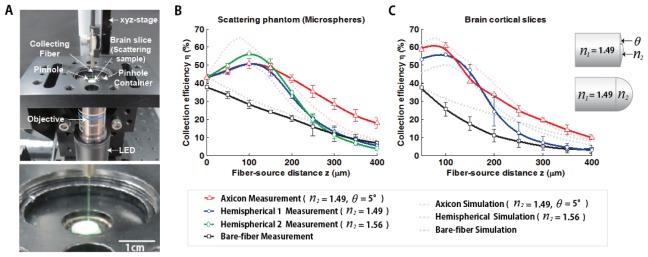
Experimental signal gain of the lensed fibers. (A) Experimental setup. (B) Measured on-axis collection profiles with a scattering phantom. (C) Measured on-axis collection profiles for brain cortical slices. Simulated data are also presented with dotted line (light color) to aid the comparison.
The overall behavior of the experimental collection curves shows similar trends with the simulated profiles, further demonstrating a large signal improvement around 1~2 MFPs in all the lensed fiber cases. Notably, in both the scattering phantoms and the brain slices experiments, the use of the axicon-lensed fiber leads to continuous signal gain over larger distances z (> 3 MFPs), which is somewhat different from the simulated results (Figs. 9(B) and 9(C)). Such discrepancies may be caused by manufacturing limitation of the low angle micro-lensed axicon fibers (i.e. non-sharp axicon apex is non ideal) [22]. Nevertheless, this is a quite favorable feature in terms of probe positioning error in vivo.
On the other hand, we observed that the measured collection profiles from the brain slice were generally lower than the simulated and the phantom experimental results for larger distance regimes. There may be multiple reasons for this deviation: (1) inaccurate and non-uniform optical properties of the prepared brain tissue, (2) insertion of the fiber against the brain tissue causes fiber bending, which could lead to a small change in the relative optical axis of the fibers, and (3) tissue deformation caused by the fiber insertion leads to additional alterations in photon trajectory at the tissue-to-fiber interfaces [11, 23].
Overall the experimental results agree well with the simulation results. These data clearly demonstrate that lensed fibers enhance photon collection. In particular, an axicon-shaped distal tip provides wider collection improvements over larger distances than a conventional bare fiber tip.
4. Conclusion
We demonstrate that hemispherical- and axicon-lensed fibers provide enhanced photon collection with theoretical (Monte Carlo simulation) and experimental (tissue phantom and brain slice) approaches. The introduction of axicon and hemispherical lenses at the fiber tip result in reduced angular divergence of the scattered photons thereby leading to the improved photon collection efficiency. Up to 2-fold signal gain is achieved mainly around 1 MFPs for both lensed fibers.
In particular, an axicon-shaped fiber tip with a specific angle (< 5 degrees) maintains enhanced photon collection over approximately 300 μm in depth while conserving its lateral collection efficiency when compared to a conventional bare fiber. Furthermore, the enhanced collection of the axicon lensed fibers is maintained over wider distances than the hemispherical lens, and thus the axicon-lensed probes tolerate larger spatial margins of error in fiber positioning. Therefore, in practice, it is advisable to use axicon-lensed fibers over hemispherical counterparts. Also, our simulation data for theoretical estimation of photon collection through the lensed fibers in highly scattering medium, agrees well with the measured data.
The presented simple concept may be applicable to any photon collection system dealing with scattering medium. For example, the introduction of lensed fibers to the SUFICS (supplementary fiber-optic light collection system) channel of two-photon microscopes may offer further enhanced photon collection if the position of the fiber-ring is optimized [11]. Note that this modification of the flat fiber ring array in the SUFICS collection system does not equate to an enabling of fluorescence imaging in deeper tissues since the merit of the lensed fiber is significantly reduced as the fiber-to-source distance increases. However, the lensed fibers can provide further near-fiber signal gain over the SUFICS method. Therefore, this feature will be helpful to overcome relatively low signal-to-noise of two-photon calcium or voltage-sensitive-dye signals from neuronal populations [24], or diffuse optical spectroscopy area. In addition, there exists a potential for the lensed fiber geometry in more efficient light delivery into scattering media that might have implications in the field of optogenetics.
Acknowledgments
This work was supported partially by the New Growth Engine Industry Project of the Ministry of Knowledge and Economy (No. 10047579), the Bio & Medical Technology Development Program and Basic Science Research Program through the National Research Foundation (NRF) funded by the Ministry of Science, ICT & Future Planning (No. 2011-0019633, 2012R1A1A1012853), the “GIST-Caltech Research Collaboration” Project through a grant provided by GIST in 2014, the bio imaging research center, and by the Institute of Medical System Engineering (iMSE) in the GIST, Korea.
Appendix 1: Theory of collection peak formation
As can be observed from Fig. 10(A)
Fig. 10.
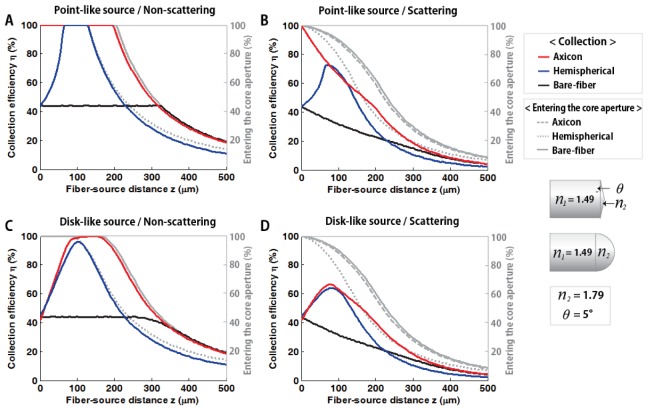
Axial collection efficiency profiles with the point-like and disk-like optical sources. Simulation conditions are as follows: (A) Point-like source and non-scattering medium. (B) Point-like source and scattering medium. (C) Disk-like source and non-scattering medium. (D) Disk-like source and scattering medium. The gray lines represent total number of photons striking the fiber end face.
, in the non-scattering case with the point-like emission, the collection efficiency of an axicon-lensed fiber (red solid line) is comparable to the bare fiber profile with respect to the total fraction of photons entering the core aperture (gray solid line). This implies that the amount of photons entering the core aperture of the axicon-lensed fiber is almost similar to the bare fiber case due to the similar geometry between the small angle axicon-lensed fiber (base angle of 5±0.3°) and the bare fiber. Introducing the axicon lens on the fiber tip efficiently reduces the angular divergence of the photons on the lens surface to mostly less than the NA-limit acceptance angle (θNA). As a result, most of the photons striking the fiber end can be collected, which is typically wasted in the standard bare fiber case.
Also note that the near fiber collection is maintained to its maximum even for the swallowing depth (z < ~1 MFPs). This can be explained by the multi-focal nature of the axicon lens, which maintains constant focusability over a wide DOF range from zero depth. These superior characteristics of the axicon-lensed fiber is also effective with scattering media, and thereby Fig. 10(B) can be simply obtained by adding contributions from the scattering loss to Fig. 10(A).
Unfortunately, the improved photon collection for the swallowing depth of the axicon lens is dramatically reduced if the light source has some dimension due to the inherent off-axis shift of the marginally distributed photons on the disk-like source (See Figs. 10(C)-10(D)). As a result, the NA-limit related collection falls-off at around 3 MFPs and off-axis signal loss compositely affects the collection peak formation in the axicon-lensed case.
On the other hand for the hemispherical case, the epi-fiber collection (z = 0) is the same amount as the bare fiber collection and it is enhanced gradually to its maximum at around 100 μm as the fiber-source distance z is increased. This can be explained by the fact that the single focal lens produces a local maximum of the optical power only at the focal length f, and gradually loses the focusability as it moves away from the focus. It is also noteworthy that the total fraction of photons entering the fiber core aperture starts to fall-off rapidly after about 130μm. This is due to the significant geometrical differences between the hemispherical-lensed fiber (thick lens with radius ~100μm) and the bare fiber. Less numbers of photons finally reach the lens surface after undergoing scattering events, and this particularly applies to photons on the off-axis. This explains why the hemispherical lenses provide enhanced photon collection only up to ~2 MFPs even with the use of lenses having longer focal length. As a result, together with the single focal nature of the hemispherical lens, the location of the collection peak is fixed around at around 100μm regardless of the lens material.
Appendix 2: Spatial dependence of collection efficiency for an ideal point-like source
We presented further simulation of three types of fiber as a function of z and r for a point-like source, and plotted two-dimensional spatial distribution of the collection efficiency and relative gains. This extended simulation results confirm general tendency that both the lensed fibers show improved photon collection efficiency over bare fiber. Results do display a stronger and wider signal gain of the axicon lensed fiber over that of hemispherical lensed fiber except for two small regions. However, for the axicon lensed-fiber collection, the regime showing near-fiber gain less than hemispherical one maintains over ~85% of the hemispherical gain, and even over ~95% of the bare fiber collection. Therefore, the relative signal loss can be regarded as insignificant (Fig. 11
Fig. 11.
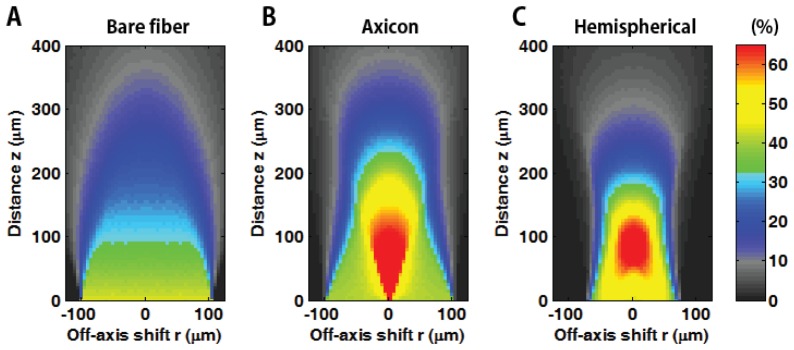
Two-dimensional spatial distribution of the collection efficiency with an ideal point-like source for (A) bare fiber, (B) axicon, and (C) hemispherical lensed fibers in scattering medium: The radial coordinate r gives the lateral dependency of the collection efficiency and axial z coordinate provides depth-dependent collection efficiency.
).
We also observed that the on-axis relative signal gain of the axicon lensed fiber around at 100 μm depth is slightly lower than that of hemispherical lensed fiber (notable with the isolated low gain region on-axis). This small gain drop is insignificant since the relative gain is still greater than ~98% compared with the hemispherical gain. Except for these two regions, the overall off-axis collection efficiency of the axicon lensed-fiber is better than the hemispherical one (Fig. 12
Fig. 12.
Relative signal gain among the different fiber geometries for a point-like source. Spatial distribution of the collection gain for (A) axicon-lensed and (B) hemispherical fibers as compared to the bare fiber. (C) Relative signal gain between axicon and hemispherical fibers.
).
Appendix 3: Lateral collection efficiency profiles at different depth
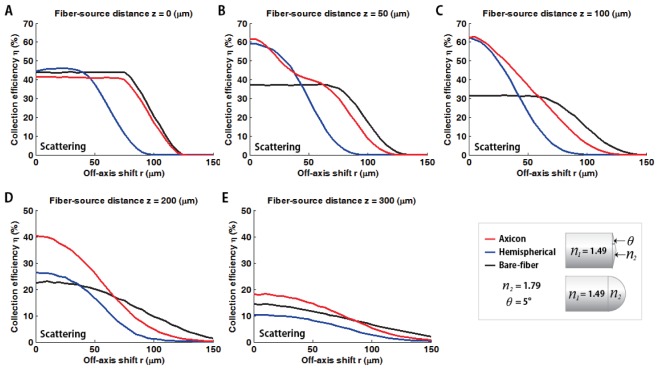
Lateral dependence of the collection efficiency is presented in Fig. 13 for five different axial distances (0 - 300μm). The lateral profiles clearly show that the axicon is superior over the other two fiber types (bare and hemispherical). As a result, the axicon-lensed fiber behaves like a bare fiber at zero depth, and the curves gradually become analogous to the hemispherical one while the overall collection is enhanced due to the on-axis signal improvements as the distance z increases (Fig. 13
Fig. 13.
Lateral dependence of the collection efficiency at five different distances (0 - 300 μm with 50 μm incremental steps) for the three type of fibers in scattering sample.
).
Appendix 4: Collection efficiency simulation with volumetric source
As we mentioned previously, the above numerical demonstration is performed under the assumptions of the limited angular spectrum from the disk-like source. However, in real-world configurations, the optical source having omni-directional emission character must be three-dimensionally confined to a small volume rather than the area or point. We therefore further removed the directional confinement and expended the dimension of the emission source by modeling the sphere-shaped volumetric source with the dimension of 50 μm (See Fig. 14
Fig. 14.

Axial collection efficiency profiles and expected signal gain with the volumetric sphere-like source (radius r = 50 μm) in scattering medium. (A) Axial collection efficiency profiles for the volumetric source with the different distal lens shapes. (B) Expected axial signal gain of the axicon- (red line) and hemispherical-(blue line) lensed fibers as compared to the bare fiber, and relative axial collection gain of the axicon-lensed fiber as compared to the hemispherical-lensed fiber (green line; axicon-to-hemispherical gain).
). In this particular case, positioning the fiber end closer to the center of the source less than 25 μm evidently damaged the volumetric source. Thus, the depth dependent collection efficiency is only plotted from distance z of 25μm.
Here, we observed that the overall collection ratio is significantly reduced owing to the consideration of isotropic emission. (Compare to the none-scattering collection efficiency normalized to the full solid angle 4π; Fig. 4(D)). Similar to the previously considered disk-like emission source, we observed that both the axicon- and hemispherical-lensed fibers can provide large signal enhancements maximally up to 2~2.5 fold for the volumetric source.
Also, similar to the disk-like and the point-like source, we found that the improved signal gain of the axicon remained relatively stable over larger depths, while the hemispherical lensed fiber showed a steeper decline of the gain curve due to the inherent single focal nature. This result indirectly indicates that the lensed fibers can enhance the photon collection even for the three-dimensionally confined and irregularly shaped biological emission source under highly scattering conditions. Indeed, the axicon-lensed fiber especially pushes the relative signal gain roughly up to the NA-limit depth zNA (~300 μm) providing a large margin of error for probe positioning.
Appendix 5: Effects of fiber diameter in collection efficiency
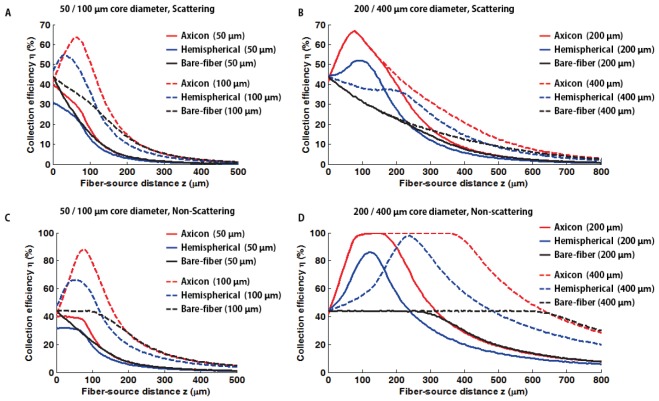
We presented the collection efficiency profiles for different fiber diameters in Fig. 15
Fig. 15.
Axial collection efficiency profiles for different fiber core diameters under scattering (A, B) and non-scattering (C, D) conditions. Associated fiber diameters and types are presented on the top and right side of each figures.
(50, 100, 200, and 400 μm). This extended simulation results confirm general tendency that both the lensed fibers show improved photon collection efficiency over bare fiber regardless of fiber diameter. Even though subtle performance drop of the axicon lensed fiber at the region very close to the fiber end face is observed for small diameter fibers (core diameter < 100 μm), the near-fiber signal drop is minor as compared to the significant signal gain of the axicon lensed-fiber in most of the region (e.g. fiber-source distance z > 50 μm).
The additional simulation results under non-scattering condition highlight that the near-fiber collection of the axicon lensed fiber is steeply and linearly increased to its maximum (collects all photon reaching on the fiber end), and establishes flat maximum gain regime until it starts to drop quickly due to the NA-limit related collection falls-off. The collection falls-off of the axicon lensed-fiber roughly starts when the fiber-to-source distance z becomes comparable to its fiber core diameter, and eventually meet the attenuation curves of the bare fiber at NA-limit depth zNA. Also, we observed that on-axis maximum collection site of the hemispherical lensed-fiber is roughly located in the middle of the flat maximum gain region of the axicon lensed fiber.
Appendix 6: Effects of varying tissue optical properties in collection efficiency
Changes of the collection efficiency for biologically relevant range of scattering coefficients are characterized (< 15 mm−1). As shown in Fig. 16
Fig. 16.
Scattering coefficient dependence of the collection efficiency for different fiber core diameters: (A) 50 μm, (B) 100 μm, (C) 200 μm, and (D) 400 μm fiber.
, the general trend (the merit of lensed fiber over bare fiber) remains the same while the scattering coefficients vary. Regarding to effect of tissue absorption, it cannot change general trends since the effects of absorption is also universal to all fiber geometries like the scattering case. Most importantly, the absorption length (1/μa; showing several millimeter order) in biological tissue is over two orders of magnitude longer than typical scattering length (1/μs). Since the range of interest is confined to near-fiber signal collection within several hundreds micron of source-to-fiber distances, the effects of absorption would be negligible.
References and links
- 1.Bargo P. R., Prahl S. A., Jacques S. L., “Collection efficiency of a single optical fiber in turbid media,” Appl. Opt. 42(16), 3187–3197 (2003). 10.1364/AO.42.003187 [DOI] [PubMed] [Google Scholar]
- 2.Oh G., Chung E., Yun S. H., “Optical fibers for high-resolution in vivo microendoscopic fluorescence imaging,” Opt. Fiber Technol. 19(6), 760–771 (2013). 10.1016/j.yofte.2013.07.008 [DOI] [Google Scholar]
- 3.Cui G., Jun S. B., Jin X., Pham M. D., Vogel S. S., Lovinger D. M., Costa R. M., “Concurrent activation of striatal direct and indirect pathways during action initiation,” Nature 494(7436), 238–242 (2013). 10.1038/nature11846 [DOI] [PMC free article] [PubMed] [Google Scholar]
- 4.Kato S., Chonan S., Aoki T., “High-numerical-aperture microlensed tip on an air-clad optical fiber,” Opt. Lett. 39(4), 773–776 (2014). 10.1364/OL.39.000773 [DOI] [PubMed] [Google Scholar]
- 5.Papaioannou T., Preyer N. W., Fang Q., Brightwell A., Carnohan M., Cottone G., Ross R., Jones L. R., Marcu L., “Effects of fiber-optic probe design and probe-to-target distance on diffuse reflectance measurements of turbid media: an experimental and computational study at 337 nm,” Appl. Opt. 43(14), 2846–2860 (2004). 10.1364/AO.43.002846 [DOI] [PMC free article] [PubMed] [Google Scholar]
- 6.Wang B., Fan S., Li L., Wang C., “Study of probe-sample distance for biomedical spectra measurement,” Biomed. Eng. Online 10(1), 95 (2011). 10.1186/1475-925X-10-95 [DOI] [PMC free article] [PubMed] [Google Scholar]
- 7.Jaillon F., Zheng W., Huang Z., “Beveled fiber-optic probe couples a ball lens for improving depth-resolved fluorescence measurements of layered tissue: Monte Carlo simulations,” Phys. Med. Biol. 53(4), 937–951 (2008). 10.1088/0031-9155/53/4/008 [DOI] [PubMed] [Google Scholar]
- 8.Schwarz R. A., Arifler D., Chang S. K., Pavlova I., Hussain I. A., Mack V., Knight B., Richards-Kortum R., Gillenwater A. M., “Ball lens coupled fiber-optic probe for depth-resolved spectroscopy of epithelial tissue,” Opt. Lett. 30(10), 1159–1161 (2005). 10.1364/OL.30.001159 [DOI] [PMC free article] [PubMed] [Google Scholar]
- 9.Pogue B. W., Burke G., “Fiber-optic bundle design for quantitative fluorescence measurement from tissue,” Appl. Opt. 37(31), 7429–7436 (1998). 10.1364/AO.37.007429 [DOI] [PubMed] [Google Scholar]
- 10.Pfefer T. J., Schomacker K. T., Ediger M. N., Nishioka N. S., “Multiple-fiber probe design for fluorescence spectroscopy in tissue,” Appl. Opt. 41(22), 4712–4721 (2002). 10.1364/AO.41.004712 [DOI] [PubMed] [Google Scholar]
- 11.Engelbrecht C. J., Göbel W., Helmchen F., “Enhanced fluorescence signal in nonlinear microscopy through supplementary fiber-optic light collection,” Opt. Express 17(8), 6421–6435 (2009). 10.1364/OE.17.006421 [DOI] [PubMed] [Google Scholar]
- 12.McLeod J. H., “The axicon: a new type of optical element,” J. Opt. Soc. Am. 44(8), 592 (1954). 10.1364/JOSA.44.000592 [DOI] [Google Scholar]
- 13.Mätzler C., “MATLAB functions for Mie scattering and absorption, version 2,” IAP Res. Rep 8, (2002). [Google Scholar]
- 14.Yaroslavsky A. N., Schulze P. C., Yaroslavsky I. V., Schober R., Ulrich F., Schwarzmaier H. J., “Optical properties of selected native and coagulated human brain tissues in vitro in the visible and near infrared spectral range,” Phys. Med. Biol. 47(12), 2059–2073 (2002). 10.1088/0031-9155/47/12/305 [DOI] [PubMed] [Google Scholar]
- 15.Wang L., Jacques S. L., Zheng L., “MCML–Monte Carlo modeling of light transport in multi-layered tissues,” Comput. Meth. Prog. Bio. 47(2), 131–146 (1995). 10.1016/0169-2607(95)01640-F [DOI] [PubMed] [Google Scholar]
- 16.Henyey L. G., Greenstein J. L., “Diffuse radiation in the galaxy,” Astrophys. J. 93, 70–83 (1941). 10.1086/144246 [DOI] [Google Scholar]
- 17.Foley J. D., Computer Graphics: Principles and Practice (Addison-Wesley Professional, 1996). [Google Scholar]
- 18.Ren N., Liang J., Qu X., Li J., Lu B., Tian J., “GPU-based Monte Carlo simulation for light propagation in complex heterogeneous tissues,” Opt. Express 18(7), 6811–6823 (2010). 10.1364/OE.18.006811 [DOI] [PubMed] [Google Scholar]
- 19.Fang Q., “Mesh-based Monte Carlo method using fast ray-tracing in Plücker coordinates,” Biomed. Opt. Express 1(1), 165–175 (2010). [DOI] [PMC free article] [PubMed] [Google Scholar]
- 20.Shen H., Wang G., “A tetrahedron-based inhomogeneous Monte Carlo optical simulator,” Phys. Med. Biol. 55(4), 947–962 (2010). 10.1088/0031-9155/55/4/003 [DOI] [PMC free article] [PubMed] [Google Scholar]
- 21.Margallo-Balbás E., French P. J., “Shape based Monte Carlo code for light transport in complex heterogeneous tissues,” Opt. Express 15(21), 14086–14098 (2007). 10.1364/OE.15.014086 [DOI] [PubMed] [Google Scholar]
- 22.Brzobohatý O., Cizmár T., Zemánek P., “High quality quasi-Bessel beam generated by round-tip axicon,” Opt. Express 16(17), 12688–12700 (2008). 10.1364/OE.16.012688 [DOI] [PubMed] [Google Scholar]
- 23.Beaurepaire E., Mertz J., “Epifluorescence collection in two-photon microscopy,” Appl. Opt. 41(25), 5376–5382 (2002). 10.1364/AO.41.005376 [DOI] [PubMed] [Google Scholar]
- 24.Grienberger C., Konnerth A., “Imaging calcium in neurons,” Neuron 73(5), 862–885 (2012). 10.1016/j.neuron.2012.02.011 [DOI] [PubMed] [Google Scholar]


