

Abstract
RNA editing increases transcriptome diversity through post-transcriptional modifications of RNA. Adenosine deaminases that act on RNA (ADARs) catalyze the adenosine-to-inosine (A-to-I) conversion, the most common type of RNA editing in higher eukaryotes. Caenorhabditis elegans has two ADARs, ADR-1 and ADR-2, but their functions remain unclear. Here, we profiled the RNA editomes of C. elegans at different developmental stages of wild-type and ADAR mutants. We developed a new computational pipeline with a “bisulfite-seq-mapping-like” step and achieved a threefold increase in identification sensitivity. A total of 99.5% of the 47,660 A-to-I editing sites were found in clusters. Of the 3080 editing clusters, 65.7% overlapped with DNA transposons in noncoding regions and 73.7% could form hairpin structures. The numbers of editing sites and clusters were highest at the L1 and embryonic stages. The editing frequency of a cluster positively correlated with the number of editing sites within it. Intriguingly, for 80% of the clusters with 10 or more editing sites, almost all expressed transcripts were edited. Deletion of adr-1 reduced the editing frequency but not the number of editing clusters, whereas deletion of adr-2 nearly abolished RNA editing, indicating a modulating role of ADR-1 and an essential role of ADR-2 in A-to-I editing. Quantitative proteomics analysis showed that adr-2 mutant worms altered the abundance of proteins involved in aging and lifespan regulation. Consistent with this finding, we observed that worms lacking RNA editing were short-lived. Taken together, our results reveal a sophisticated landscape of RNA editing and distinct modes of action of different ADARs.
RNA editing increases transcriptome diversity through post-transcriptional insertion, deletion, or modification of certain bases on RNA molecules (Licatalosi and Darnell 2010). RNA editing has been found to play important roles, such as altering specific codons of neurotransmitters or ion channels (Higuchi et al. 1993; Burns et al. 1997), creating new splicing sites (Rueter et al. 1999), modifying miRNA seed sequences or their targeting sites (Kawahara et al. 2007a,b), and protecting pre-mRNA by competing with the RNAi pathway (Wu et al. 2011; Warf et al. 2012).
RNA editing is a widespread phenomenon in all metazoans (Danecek et al. 2012). The vast majority of known RNA editing comprises adenosine (A) to inosine (I) deamination, which is catalyzed by a family of adenosine deaminases that act on RNA (ADARs) (Keegan et al. 2001). ADARs are essential in mammals, but their individual effects in A-to-I editing remain unclear. ADAR1+/− mutant mice died before embryonic day 14 with defects in the hematopoietic system (Wang et al. 2000). ADAR2−/− mice became progressively prone to seizures after P12 and died young (Higuchi et al. 2000). In invertebrates, Drosophila melanogaster has a single ADAR2-like gene called Dmel\Adar (also known as dADAR), the deletion of which causes locomotor incoordination and temperature-sensitive paralysis (Palladino et al. 2000). Caenorhabditis elegans has two ADAR genes, adr-1 and adr-2, but their individual roles in A-to-I editing remain unclear. Worms lacking either or both genes are viable and exhibit only minor chemotaxis defects (Tonkin et al. 2002), which makes C. elegans an excellent model to study the effects of ADARs.
Next-generation sequencing and bioinformatic technologies have recently been used to identify millions of RNA editing events at the genome scale in humans (Peng et al. 2012; Ramaswami et al. 2012, 2013; Bazak et al. 2014), mice (Danecek et al. 2012; Gu et al. 2012), and fruit flies (Graveley et al. 2011). However, the RNA editome in C. elegans remains largely unknown. Thus far, only 10 genes in C. elegans had been found to be edited in noncoding regions (Morse and Bass 1999; Morse et al. 2002). It is also unclear whether RNA editing is regulated across different developmental stages. In this study, we profiled the RNA editomes of different developmental stages of the Bristol N2 wild type and three ADAR mutants using strand-specific RNA sequencing (RNA-seq) and whole-genome DNA resequencing. We also developed a new computational pipeline using a bisulfite-seq-mapping-like approach that achieved higher sensitivity and specificity. This addressed the computational challenges in identifying editing sites, including mapping reads, anchoring junction sites, and differentiating sequencing errors from true editing events (Bass et al. 2012; Piskol et al. 2013).
Results
A new RNA editing identification pipeline using a bisulfite-seq-mapping-like approach to increase sensitivity
Our identification pipeline is summarized in Figure 1A and detailed in Methods. Critical improvements over existing methods that significantly increased sensitivity are highlighted below.
Figure 1.

The computational pipeline for identifying RNA editing sites in C. elegans using whole-genome DNA-seq and strand-specific RNA-seq data. (A) Overview of the computational pipeline. This pipeline consists of three mapping steps. In particular, the ultra-edited reads are mapped using a bisulfite-seq-mapping-like approach. Multiple filters are applied to control false positives caused by library construction, sequencing, and misalignment. (B) The performance of the bisulfite-seq-mapping-like approach. The red curve shows the number of reads containing the indicated numbers of edited bases, and the blue curve shows their contribution to the total number of edited bases. (C) The performance of each filter in reducing the false positives.
As annotated junction sites were far from complete, we extracted novel junction sites and junction connections from the RNA-seq data using TopHat (Trapnell et al. 2009) and Cufflinks (Trapnell et al. 2010). Our result showed that 4% of the reads were mapped to novel junctions, which would have been unmappable or misaligned if only annotated junctions were used.
A-to-I editing sites were often clustered together, and ultra-edited reads with > 10% mismatches were common. Inspired by the idea of bisulfite sequencing mapping in DNA methylation studies, we transferred all the adenosines (As) in both reference and read sequences to guanosines (Gs) to eliminate A/G differences during mapping. We found that 34.6% of the edited reads contained five to 20 edited bases, contributing to 62.7% of the total edited bases (Fig. 1B). These sites would have been missed using previous pipelines such as BWA (Li and Durbin 2009).
To obtain accurate calling results, we also sequenced the matched genomic DNA of the wild-type and ADAR mutant strains. Sites with a minor allele frequency higher than 10% were considered genomic SNPs and removed. The incorporation of genomic DNA sequencing (DNA-seq) data helped to remove 131 (93.5%) more non-A-to-G sites and 9 (0.1%) more A-to-G sites.
We then classified the remaining candidate sites as “clustered” and “scattered” according to their relative distance. In contrast to previous methods which classified sites as Alu and non-Alu (Ramaswami et al. 2012), our method did not rely on any prior knowledge of the location preference of RNA editing or the annotation of transposons. We applied relatively more stringent criteria for scattered sites, including the average base quality and homopolymers (more details in Methods). The filtering performance of each step using data from wild-type embryos is illustrated in Figure 1C. Adapter residuals contributed to most of the false positives. Depth cut-off greatly reduced the clustered A-to-G sites and scattered non-A-to-G sites.
We compared the performance of our pipeline with the previously published results of Peng et al. and Ramaswami et al. (2012) using RNA-seq data published by Peng et al. (2012). Our pipeline resulted in a twofold increase in the number and 2% increase in the percentage of A-to-G editing sites identified from the strand-specific RNA-seq (Supplemental Table 1). Although a lower percentage of A-to-G was identified from the strand-nonspecific RNA-seq, our pipeline still identified ∼50,000 more A-to-G sites. Recent studies have suggested that noncanonical variants (non-A-to-G and non-C-to-U) were false positives (Ramaswami et al. 2012; Piskol et al. 2013). However, we found that nearly all the non-A-to-G sites identified from strand-nonspecific RNA-seq were T-to-C sites, most of which should be A-to-G sites due to incorrect strand annotations; this led to the lower percentage of A-to-G sites identified from the strand-nonspecific RNA-seq.
Genome-wide RNA editing profiles of wild-type and ADAR mutant strains
To profile RNA editing in C. elegans at the whole-genome scale, we performed strand-specific sequencing of poly(A)+ RNAs from the wild-type embryos and L1, L2/3, and L4 larvae, in addition to adult worms aged 1 and 8 d. To study the roles of ADR-1 and ADR-2 on A-to-I editing, we also sequenced poly(A)+ RNA from the adr-1(gv6) mutant, the adr-2(gv42) mutant, and the adr-1(gv6); adr-2(gv42) double mutant at the embryo, L1, L4, and adult day 1 stages (Supplemental Table 2). Over 50M 90-nt × 2 or 100-nt × 2 reads per sample were uniquely mapped to the C. elegans genome. Because an accurate DNA genotype was necessary for reliable RNA editing calling, we also sequenced the whole-genome DNA of all four strains in great depth (Supplemental Table 3): ∼80× for the adr-2 strain and ∼250× for the others.
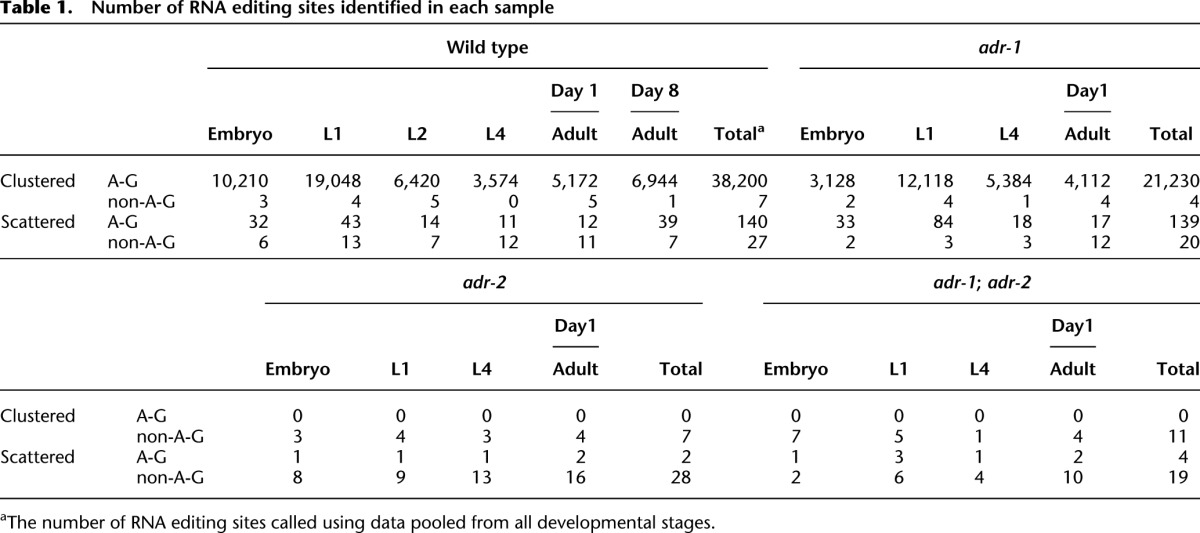
We applied our RNA editing identification pipeline to the RNA-seq and DNA-seq data. In total, we identified more than 38,000 RNA editing sites using pooled data from all wild-type samples and 3000–19,000 sites from different developmental stages (Table 1; Supplemental Table 4). A-to-G (I) editing was the most dominant type of RNA editing, which was consistent with large-scale RNA editome profiling of humans (Ramaswami et al. 2012), mice (Danecek et al. 2012), and fruit flies (St Laurent et al. 2013). More than 99.5% of the identified RNA editing sites were located on chromosomes as clusters, and they were divided into ∼2551 clusters spaced at least 1 kb apart from each other.
Table 1.
Number of RNA editing sites identified in each sample
Ten previously known A-to-I edited genes (Morse and Bass 1999; Morse et al. 2002) were all found to be edited in this study but in a wider region along the gene bodies than previously reported (Supplemental Table 5). We selected 15 A-to-I regions for validation using PCR and Sanger sequencing. In the seven regions that were successfully amplified, the editing signals were all validated (Supplemental Fig. 1). In contrast, of the 71 automatically called non-A-to-I editing sites, we selected seven for validation, and none were validated except for one site in an rRNA (Supplemental Table 6). One previously reported gld-2 C-to-U editing site (Chr I: 6377791) (Wang et al. 2004) was not observed in our RNA-seq result, nor in our PCR and Sanger sequencing result (Supplemental Fig. 2).
RNA editing sites largely located in noncoding regions
In total, 2500 genes were edited either in the annotated gene bodies or within 2 kb upstream of or downstream from the gene bodies (Supplemental Table 4). The identified editing sites were mainly located in introns and other noncoding regions such as the 3′ UTR and regions further downstream or the 5′ UTR and regions further upstream (Fig. 2A). When all of the wild-type samples were pooled together, the identified editing sites in the UTRs, but not the introns, reached saturation (Supplemental Fig. 3).
Figure 2.

Characteristics and sequence preference around the RNA editing sites. (A) Location distribution of RNA editing sites. (B) Overlap between the RNA editing sites and each of the three categories: inverted repeats that coincide with transposons (InvR & TE, royal blue), inverted repeats outside of transposons (InvR, midnight blue), transposon regions not containing inverted repeats (TE, light cyan). Indicated in parentheses are the numbers of overlapped sites, which are also represented by the colored areas. (C) A predicted stem–loop structure of an RNA from an editing locus (Chr I: 2415351). Edited adenosines are marked red, and the red bars denote editing frequency. (D) Nucleotide preference within 3 nt around the editing sites in the wild type. The RNA editing sites were divided into 10 groups according to their editing frequencies. (E) Editing frequency at different positions of adenosine homopolymers in the wild type (blue) and the adr-1 (red) mutant.
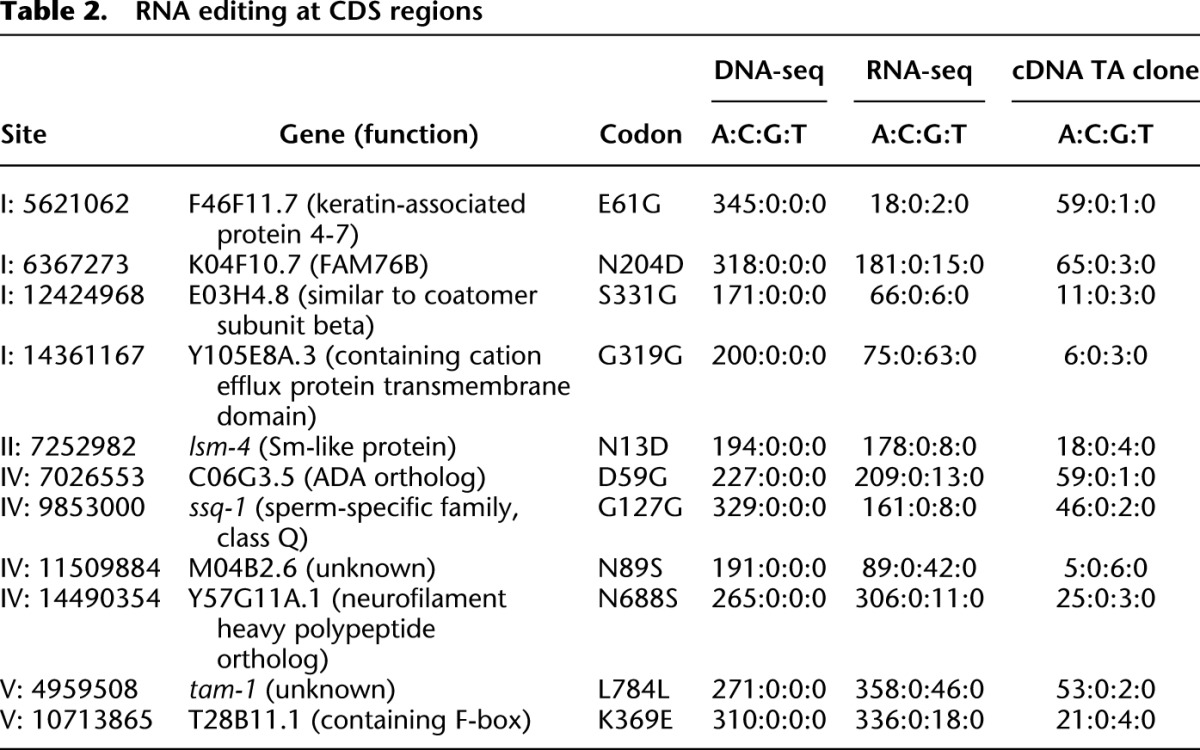
The most well-known function of RNA editing is to alter specific amino acid residues of glutamate and serotonin receptors (Rosenthal and Seeburg 2012) that are essential in mammals. A-to-I editing in coding regions has not been reported in C. elegans. Here, we identified 11 RNA editing sites in coding regions from all the samples. Most of these sites had an editing frequency of less than 10%; thus, we used TA cloning to verify the existence of RNA editing. We successfully validated all 11 RNA editing sites in coding regions using PCR and Sanger sequencing (Table 2; Supplemental Table 7). Among these sites, eight resulted in altered codons. However, these genes are not enriched in any function category.
Table 2.
RNA editing at CDS regions
DNA transposons and hairpin structures around RNA editing sites
Similar to findings in other species (Neeman et al. 2006; Ramaswami et al. 2012), we also observed that RNA editing sites were enriched in inverted repeats and transposons. Coding regions have fewer inverted repeats and transposons, which explains why RNA editing sites are typically located in noncoding regions. However, in contrast to findings in humans where nearly all A-to-I editing sites are exclusively clustered in Alu elements, we found that these editing sites in C. elegans were located in many classes of DNA transposons (Fig. 2B; Supplemental Table 8). Across different samples, 85%–90% of the identified sites overlapped with annotated inverted repeats, and 63%–73% overlapped with annotated DNA transposons, significantly higher than what would be expected by chance (P < 10−3; Monte Carlo simulation). We found that transposons of the same family tend to share a similar RNA editing pattern (permutation P < 10−4, see an example in Supplemental Fig. 4), suggesting that RNA editing might have a target recognition mechanism.
It was previously found that double-stranded RNAs of at least 15–20 bp could serve as substrates for ADARs (Nishikura et al. 1991). Here we found that 70% of the editing regions contained hairpin structures predicted by RNAfold (Lorenz et al. 2011), which was significantly higher than the whole genome background (P < 10−3; Monte Carlo simulation). These double-stranded RNA structures were formed by neighboring transposons of the same family or by self-palindrome (Supplemental Table 8). For > 60% of edited transposons, we could find a similar transposon (> 80% sequence identity) located in the opposite strand ≤ 3 kb away. Of the top 20 most frequently edited transposons, seven contained self-palindrome structures. Figure 2C shows a hairpin structure containing many editing sites. Stem structures containing RNA editing sites had > 80% pairing identity but varied in length from 20 bp to 1 kb. RNA editing density positively correlated with both the length and the extent of perfect base-pairing of the stem (P < 10−11 and P < 10−15, respectively). RNA editing occurred almost exclusively in helix regions and ∼25% of the adenosines in helix regions were edited. Bulges of ≥ 2 bp were less preferred by ADARs. ADR-2 had a 5′ nearest and second nearest neighboring preference for U > A > C > G and a 3′ nearest neighboring preference for A > G > U > C (Fig. 2D), which was similar to but still distinct from findings in humans (5′ U > A > C > G and 3′ G > C > U ∼ A, respectively) (Lehmann and Bass 2000). We also found that the second adenosine in adenosine homopolymers had a significantly higher editing frequency than its neighboring sites (Fig. 2E).
Inverted repeats and transposons could be edited in both sense and antisense orientations and occasionally in both orientations simultaneously (Supplemental Fig. 5). We used a strand-specific strategy during RNA-seq library construction, and the accuracy of the strand separation was confirmed to be higher than 99.8% (Methods). Hence, we could determine the transcript orientation with high confidence in the absence of gene annotations. RNA editing was found in both the sense and antisense transcripts in ∼5% of the RNA editing loci.
Because RNA editing sites were frequently located in DNA transposons, reads from transposons filtered out due to multiple mapping may also contain editing sites. We retrieved such reads and attempted to call RNA editing from them. We did not know exactly from which genome regions these multiple-hit reads were transcribed, but we obtained maximum and minimum transcription regions by counting all possible alignments or only one. The number of additional RNA editing sites from multiple-hit reads was 25%–90% of that found from uniquely mapped reads in each sample. Compared with the editing sites found from uniquely mapped reads, these editing sites were enriched in transposon families that are still active in C. elegans and hence have low divergence among members, such as Tc5A, Tc6, Tc1A, Tc3, and Tc4.
Differences in RNA editing across developmental stages
We found that the number of RNA editing sites in wild-type worms was the highest at the L1 and embryonic stages, then decreased dramatically from L2 to L4, and increased slightly after the adult stage (Table 1). The number of editing clusters followed a similar trend across different stages (Pearson’s correlation 0.95, P = 2.7 × 10⁻⁵). Once a site was found edited, its editing frequency (i.e., the percentage of reads edited at the site among all reads across the site) remained relatively stable between different developmental stages (R2 > 0.8 and slope ∼0.9, pairwise linear regression, Fig. 3A). Both the R2 and the slope moved even closer to 1 when sequencing depth increased (Supplemental Fig. 6).
Figure 3.

Characteristics of RNA editing in ADAR mutant strains compared with the wild type. (A) Pairwise comparison of RNA editing frequency at each site between samples. Three scatter plots illustrate the comparison of RNA editing site frequency between three pairs of samples. (Blue) Wild-type vs. wild-type; (red) adr-1 vs. adr-1; (green) wild-type vs. adr-1. Black dots highlight sites with significant differences in editing frequency between samples (Fisher’s exact test, corrected P < 0.01). Linear regression was performed for each pair of samples, and the slope and R2 were plotted in the lower right panel. (B) Number of editing clusters in each sample. Filled bars depict the number of editing clusters. Empty bars depict the number of expressed clusters not edited in this sample but edited in at least one other sample. (C) Density plot of the number of RNA editing clusters over editing frequency at different developmental stages. For clusters with 10 or more editing sites, there was generally a peak near 100% of editing frequency. For clusters with less than five editing sites, the density curves were generally flat with a rise near zero. Lines of different colors indicate different developmental stages. (D) Violin plot of the distribution of RNA editing frequency in the wild type and the adr-1 mutant. The adr-1 mutant had reduced RNA editing frequency. (E) adr-1; adr-2 mutant worms have a shortened lifespan at 20°C (log-rank test, P = 0.004).
We defined “a site with editing potential” as a site found to be edited in at least one of the developmental stages. We defined a RNA editing cluster as “expressed” at a developmental stage if there was at least one read covering any of the sites with editing potential within the cluster, and as “edited” if at least one site was edited. For each expressed RNA editing cluster, we counted the total number of reads covering one or more sites with editing potential (T) and the number of edited reads (E), and calculated the editing frequency of the cluster as E/T. In wild-type C. elegans of different developmental stages, 543–1605 RNA editing clusters were expressed; among the expressed clusters, 80%–95% were edited (Fig. 3B). A strong positive correlation was observed between the editing frequency of a cluster and the number of editing sites in the cluster (P = 10−16). Intriguingly, for clusters harboring 10 or more sites with editing potential, once expressed, 80% of these clusters had an editing frequency close to one and only < 2% were not edited at all (Fig. 3C). In contrast, among the clusters with less than five sites with editing potential, 30% were not edited at all when expressed (Fig. 3C). Together with our observation that the RNA editing density positively correlated with both the length and identity of the stem structure, our results suggested that ADARs might preferentially target long and perfectly base-paired double-stranded RNAs.
An essential role of ADR-2 and a modulating role of ADR-1 in A-to-I editing
Both adr-1 and adr-2 knockout worms were reported to be defective in chemotaxis to some extent (Tonkin et al. 2002). Previous studies focused on 10 known edited genes and found no editing in the adr-2 mutant and some editing in the adr-1 mutant (Tonkin et al. 2002). However, there was no genome-wide study of RNA editing in adr-1 and adr-2 mutants.
Our genome-wide profiling revealed that RNA editing was almost completely eliminated in adr-2 mutant and adr-1; adr-2 double mutant strains (Table 1), indicating an essential role of ADR-2 in A-to-I editing. In contrast, ADR-1 played a modulating role. In adr-1 mutants, the normalized number of editing clusters was similar to that in the wild type (Fig. 3B), whereas the number of editing sites was nearly halved (Table 1), and the overall editing frequency decreased by ∼30% (Fig. 3D). This decrease was uneven across sites, as indicated by a significant decrease of the slope and R2 in pairwise linear regression between the wild type and the adr-1 mutant (Fig. 3A). The editing frequency at individual sites was stable across different developmental stages in the adr-1 mutant, a pattern similar to that in the wild type (Fig. 3A; Supplemental Fig. 6).
ADAR mutants had altered proteome that affected aging-related functional categories and showed shortened lifespan
We compared the proteomes of the wild-type and the adr-2 mutant worms at the L1 larval stage and adult day 1 stage using 15N metabolic labeling and quantitative mass spectrometry (Dong et al. 2007). About 6000 proteins were reliably quantified (Supplemental Fig. 7A). We detected little difference between the wild type and the adr-2 mutant on adult day 1. In contrast, 127 proteins were differentially expressed in the adr-2 mutant L1 larvae compared to wild-type animals at the same stage (fold-change > 2; Wilcoxon rank-sum test, corrected P < 0.05) (Supplemental Fig. 7B). An interesting coincidence is that wild-type animals have the highest number of edited genes at the L1 stage, nearly four times as many as that on adult day 1. However, differentially expressed proteins are not enriched for those encoded by edited genes, suggesting that RNA editing plays an indirect role in regulating the abundance of the 127 proteins.
Functional enrichment analysis of Gene Ontology (GO) using the KOBAS software (Xie et al. 2011) showed that the differentially expressed proteins in the adr-2 L1 larvae were enriched in GO classification terms “aging” and “determination of adult lifespan” (corrected P < 10−4, Supplemental Fig. 7C). In agreement with this finding, we also observed that C. elegans lacking RNA editing activity had a significantly shortened lifespan (log-rank test, P = 0.004, Fig. 3E), which is a previously undiscovered phenotype.
Discussion
In this study, we performed the first genome-wide RNA editome profiling of C. elegans and analyzed the changes in RNA editing across different developmental stages between wild-type and ADAR mutant strains. We found extensive RNA editing events in C. elegans, almost all of which were A-to-I editing, located primarily in noncoding regions, especially DNA transposons. We found that different numbers of genes were edited in different developmental stages. Surprisingly, for > 80% of the editing clusters with 10 or more sites with editing potential, all transcripts were edited when expressed. We discovered an essential role of ADR-2 in A-to-I editing and a modulating role of ADR-1. We found a connection between adr genes and lifespan regulation.
Furthermore, RNA editing sites were located primarily in repeat elements, and different species had different types of repeat elements. It has been reported that human coding RNA editing is generally nonadaptive (Xu and Zhang 2014), thus it may not be surprising that we found only four homologous sites that were edited in both C. elegans and human (Supplemental Table 10) (list of RNA editing sites in human were from RADAR [Ramaswami and Li 2014]). We identified RNA editing sites in three additional nematode species closely related to C. elegan—C. remanei, C. brenneri, and C. briggasae—using public data (SRP006033 and SRP034522 from NCBI Sequence Read Archive (SRA; http://www.ncbi.nlm.nih.gov/sra). Again we only found dozens of homologous sites that were edited in both C. elegans and at least one other nematode species (Supplemental Table 10), similar to the previous finding that RNA editing sites are not conserved among mammals (Pinto et al. 2014). Therefore, although RNA editing was a conserved phenomenon and catalyzed by conserved ADAR family members, the edited genes or sites were not conserved across species.
We observed that for more than 80% of the clusters which contain 10 or more editing sites, nearly every read covering an editing cluster was edited. This suggests that for these clusters, RNA editing occurs in an exhaustive manner. A possible explanation would be that unedited RNAs were degraded, which would be consistent with the hypothesis that ADAR protects double-stranded RNAs from RNA interference (RNAi)-mediated degradation. However, our data did not support this explanation. First, > 80% of the regions edited in the wild type were covered by unedited reads in the adr-2 mutants, indicating that unedited transcripts were not degraded in the absence of RNA editing. Second, we sequenced the small RNAs at the L1 and day 1 adult stages using sRNA-seq (data not shown). Approximately 400 sRNA clusters were up-regulated in at least one ADAR mutant strain compared with the wild type, of which only 15% or so were within 1 kb of the identified RNA editing sites, suggesting that the majority of the unedited transcripts were probably not targeted by RNAi.
The RNA editing sites are enriched in introns. Given that the average sequencing depth of introns was only 7× (compared to 100× for exons) and the RNA editing sites identified in introns are still far from saturation (Supplemental Fig. 3), we expect that more RNA editing sites will be identified in introns in the future. As the sequencing technology improves and the cost decreases, it will become feasible to enrich pre-mRNAs and sequence them in greater depth, which may bring new insights to RNA editing in C. elegans.
The RNA editing identification pipeline we developed markedly improved sensitivity and specificity over previous methods. Sensitivity was achieved primarily by incorporating a bisulfite-seq-mapping-like step to align ultra-edited reads, and specificity was achieved by applying different filters to clustered and scattered candidate sites to control for false positives. We have shown that our pipeline is applicable to other organisms including humans. As more and more sequencing data become available, our pipeline can facilitate RNA editing research for a better understanding of this interesting post-transcriptional regulation.
Methods
C. elegans strains and sample preparation
The strains used in this study included Bristol N2 (wild type), BB2 adr-1(gv6) I, BB3 adr-2(gv42) III, and BB4 adr-1(gv6); adr-2(gv42).
Worm strains were cultured and maintained as described by Brenner (1974). The embryos were prepared by bleaching a mixed population with a solution containing ∼3% NaClO and 0.75 N KOH. The embryos were incubated in M9 buffer (3.0 g KH2PO4, 6.0 g Na2HPO4, 0.5 g NaCl, and 1.0 g NH4Cl in 1 L H2O) for 17 h, causing the larvae to arrest at the L1 stage upon hatching. The freshly hatched L1 larvae were cultured on high-growth plates seeded with Escherichia coli OP50 at 20°C. The animals were collected at the L1, L2/L3, L4, and young adult (pregravid) stages. The larvae stage was determined by observing vulval and germline development. The exact time for growth after the plating of the starved L1s was as follows: (1) L1 worms were grown for 4 h; (2) L2/L3 worms for 25 h; (3) L4 worms for 42 h; and (4) young adult worms for 54 h. The animals were then washed and centrifuged, and the pellets were frozen in M9 buffer using liquid nitrogen. The embryos were harvested using the same bleaching protocol, followed immediately by washing and freezing in liquid nitrogen. To collect the day 8 adult worms, L1 larvae obtained using the bleaching protocol were allowed to grow for 222 h on high-growth plates supplemented with 50 μg/mL 5-fluoro-2′-deoxyuridine (FUdR).
The total RNA was isolated by adding four volumes of TRIzol reagent (Invitrogen) per volume of packed worms. The mixture was vigorously vortexed, and the insoluble material was removed via centrifugation at 14,000g. The supernatant was extracted using chloroform. The aqueous phase was precipitated with isopropanol, and the pellet was washed with 70% ethanol. The pellet was then resuspended in DEPC-treated water, and the concentration was determined using a NanoDrop spectrophotometer. The genomic DNA was extracted via proteinase K digestion, followed by two rounds of phenol-chloroform extraction with an intermediate step of RNase A digestion in TE.
RNA-seq data quality evaluation
RNA-seq quality, including the base quality, duplication rate, intron rate, and rRNA rate, was evaluated using FastQC and RNA-SeQC (DeLuca et al. 2012). Strand specificity in the library construction was estimated using spliced reads exactly matching annotated splicing junctions (Ensembl v63) (Flicek et al. 2012). Reads supporting the annotated junctions with the same and reverse orientations had correct and incorrect strand information, respectively.
DNA-seq mapping
Reads were aligned to both the C. elegans genome (WS220) and E. coli OP50 genome with BWA (v0.6.2-r126). Reads that uniquely mapped to the C. elegans genome and properly paired were kept, and potential PCR duplicates were removed. In contrast to traditional genotyping, loose criteria were used in SNP calling, and stringent criteria were used in homozygote calling. The sites with alternative allele frequency higher than 10% and lower than 1% were considered to be heterozygous and homozygous, respectively.
RNA-seq mapping
TopHat (v1.4.1) was used in RNA-seq read mapping to identify the junctions. Ensembl gene annotation (v63) was used to guide the read mapping. The minimum intron length was set to 20 nt according to the known gene annotation. In the transcriptome mapping step, five mismatches at most were allowed, and the maximum number of hits was set to 1000 considering the highly overlapped isoform. In the second mapping step, the reads were split into three or four segments, and at most two mismatches were allowed in each segment. Because the worms were fed E. coli OP50 and the OP50 RNAs could be mixed into the total RNAs we extracted, we mapped all the reads to the E. coli OP50 genome sequence in addition to the C. elegans genome and junction flanking sequences. The unmapped reads were first trimmed with splice leaders (Blumenthal 2005), which are 22-nt sequences trans-spliced to the beginning of 70% of the C. elegans mRNAs, and then mapped again.
BWA (v0.6.2-r126) was used in the formal RNA-seq read mapping. Although the RNA-seq data were paired-end, a single-end mapping strategy was used because the reference database was mixed with junction flanking sequences. At most, three mismatches were allowed in this step.
To deal with ultra-edited reads, we transferred all the As in both reference and read sequences to Gs to eliminate A/G differences during mapping. To avoid biases, besides A-to-G, all 12 forms of transfer were performed. BWA was used in this bisulfite-mapping-like step, with only one mismatch allowed. Rules used for both sequence transformation and strand matching are listed in Supplemental Table 9 and depended on the fr-first-stranded library type of our RNA-seq data. All alignments from the above three-step BWA mapping were pooled together. Only the uniquely best-mapped read pairs located within a proper distance and relative orientation were kept.
Filters applied to clustered and scattered candidates
Before calling the variants, we cleaned the mapping result by removing potential PCR duplicates, merging overlapped paired-reads, and trimming the leading 5 nt from the starting ends. Sites with a variant frequency ≥ 5% were taken as raw candidate editing sites. The following filters were then performed in order: (1) DNA SNPs were filtered out from this raw set. (2) All alignments of reads covering the remaining candidate sites were checked with BLAT (Kent 2002), and the reads involved in inconsistent alignments were removed. The candidate editing sites were then called again using the same criteria. (3) Neighboring sites no further apart than 100 bp were clustered together. If a cluster contained three or more candidate sites, then sites in this cluster were considered “clustered.” All candidate sites were separated into “clustered” or “scattered” in this manner; loose and stringent filters were applied for the clustered and scattered sites, respectively. (4) For the scattered sites, the depth and frequency of the edited forms were required to be ≥ 5 and ≥ 5%, respectively. (5) Inaccurate junction anchoring during read alignment induced mismatches to regions at terminal and neighboring junctions; thus, at least three reads were required to support the edited forms with a reliable part that was 15 bp away from the terminal and 5 bp away from the junctions. (6) The nucleotides downstream from the homopolymers may be mistakenly sequenced as nucleotides constructing the homopolymer; a longer homopolymer in this scenario results in a higher error rate. Candidates within 3 bp downstream from a ≥ 6mer homopolymer or 2 bp downstream from a 3–5mer homopolymer and transferred to the same nucleotide of the upstream homopolymer were removed. (7) The average base quality of both reference bases and variant bases should together be ≥ 25. (8) Clustered sites shared the same editing patterns and were less likely to result from sequencing errors; therefore, we applied loose filtering criteria to the clustered sites. The depth and frequency of the edited forms were required to be ≥ 2 and ≥ 5%, respectively, and 50% of the sites of each cluster were required to have reliable supporting reads. (9) The candidate sites that passed all the above filters were considered to be final RNA editing sites if their DNA was homozygous.
PCR-Sanger validations
To verify the RNA editing events identified via RNA-seq and computational analysis, we analyzed a random selection of clustered RNA editing regions, all RNA editing sites at the coding regions, and seven non-A-to-G editing sites by Sanger sequencing of PCR-amplified DNA and cDNA samples. The cDNA was synthesized from the total RNA using the PrimeScript II First Strand cDNA Synthesis Kit (TaKaRa). To verify RNA editing sites in coding regions with a low editing frequency, we also ligated PCR products into vectors by TA cloning and sequenced dozens of clones.
Validation of C-to-U editing sites in gld-2
To validate the previously reported C-to-U sites in gld-2, we used the same primers (LWp11 and LWp13) as described by Wang et al. (2004). The cDNAs of germline-specific isoforms 4.7L and 4.7S of gld-2 were amplified from asynchronous wild type, wild-type day-1 adults, and adr-1; adr-2 day-1 adults. PCR products with expected sizes of 1464 bp and 1338 bp were gel-extracted and purified. The editing sites were verified by Sanger sequencing as well as AlwNI (NEB) digestion of the purified PCR products followed by electrophoresis.
Prediction of RNA secondary structure around RNA editing sites
RNA editing sites identified from all samples were pooled together. Neighboring sites within 1000 bp were clustered into one editing cluster. The sequence of each cluster and the 750-bp flanking regions were used to predict the RNA secondary structure. The RNAfold program (v1.6) from the Vienna RNA Package was used to calculate the minimum free energy based on the RNA secondary structure. Within the RNA secondary structure, the local structures with a stem ≥ 30 bp and identity ≥ 80% were defined as candidate dsRNA substrates that could be targeted by ADAR. Regions with the same length and number as the identified editing loci were randomly picked from the genomes and also folded with RNAfold using the same parameters and filters. This process was repeated 1000 times to obtain a random distribution of dsRNA structures on a genomic background.
Quantitative proteomics analysis
15N-labeled C. elegans samples were prepared as described (Dong et al. 2007) except that metabolically labeled E. coli K-12 MG1655 cells were used as C. elegans food. 15N-labeled MG1655 cells were cultured as previously described (Khan et al. 2011).
Worms were collected and lysed in lysis buffer (4% SDS, 0.1 M DTT in 0.1 M Tris/HCl, pH 7.6). After 5 min incubation at 95°C, the crude extract was clarified by centrifugation at 14,000 rpm at room temperature for 10 min. Protein lysates of the 15N-labeled and unlabeled worms were combined at a 1:1 protein ratio. The mixed lysate samples containing 0.4 mg of total proteins were subjected to buffer exchange, thiol reduction, alkylation, and trypsin digestion using the filter-aided sample preparation (FASP) procedure (Wisniewski et al. 2009).
Approximately 40 μg peptides were desalted and then loaded onto a home-packed capillary strong cation exchange column (250 μm internal diameter × 3 cm, Luna SCX resin). Ten SCX fractions were collected by eluting with ammonium acetate solutions at 10, 20, 30, 40, 60, 90, 150, 300, 500, and 1000 mM at a flow rate of 1.5 μL/min, 15 μL each.
Each fraction was analyzed on a Q Exactive mass spectrometer (Thermo Fisher Scientific) coupled to HPLC via a nano-electrospray ion source. Peptides were separated on a home-packed capillary reverse phase column (75-μm internal diameter × 10 cm, Luna C18 resin) with a 105-min gradient of A and B buffers (buffer A, 0.1% formic acid; buffer B, 100% ACN/0.1% formic acid). A lock mass of 445.120025 m/z was used for internal calibration. Electrospray ionization was carried out at 1.8 kV, with the heated capillary temperature set to 250°C. Full-scan mass spectra were acquired in the Orbitrap in the positive-ion mode over the m/z range of 300 to 2000 at a resolution of 70,000. MS/MS spectra were acquired in the Orbitrap for the 15 most abundant multiply-charged species in the full-scan spectrum having signal intensities of > 5.0 × 10⁻⁴ NL (Thermo). Dynamic exclusion was set such that MS/MS was acquired only once for each species over a period of 30 sec.
MS/MS spectra were searched against the concatenated forward and reversed C. elegans protein database (WS233) using ProLuCID (Xu et al. 2006) and filtered using DTASelect (Tabb et al. 2002). Carbamidomethylation of cysteines was included as a fixed modification. The estimated false discovery rate (FDR) was no more than 1% for identified spectra and no more than 4% for identified proteins. The filtered identification results were quantified using pQuant (Liu et al. 2014). Unreliable quantification results with σ values greater than 0.5 were discarded.
The median of 14N/15N-values of peptides was assigned to their parent protein. For each protein, the relative abundance ratio of adr-2/wild type was calculated by dividing the 14N-adr-2/15N ratio with the 14N-WT/15N ratio. To determine the significance of the abundance change of a protein, a Wilcoxon rank-sum test was carried on its constituent peptides that were quantified in the wild type or the adr-2 mutant. The resulting P-value was further corrected using the Benjamini–Hochberg procedure to control the false discovery rate.
Gene Ontology (GO) enrichment analysis of differentially expressed proteins was performed on the KOBAS web platform with default parameters (Xie et al. 2011).
Lifespan assay
Lifespan assays were performed as described previously (Tao et al. 2013). All lifespan assays were conducted at 20°C starting from the first day of adulthood.
Data access
All sequencing data from this study have been submitted to the NCBI Sequence Read Archive (SRA; http://www.ncbi.nlm.nih.gov/sra) under accession number SRP028863.
Supplementary Material
Acknowledgments
We thank Dr. Li-Lin Du for his valuable comments and suggestions. We thank Ms. Sasha Sa for manuscript editing. Some strains used in this study were provided by the Caenorhabditis Genetics Center (CGC), which is funded by the NIH Office of Research Infrastructure Programs (P40 OD010440). This work was supported by grants from the National Natural Science Foundation of China (no. 31025014) and the Ministry of Science and Technology of China (no. 2012CB837600) to L.W., and grants from the Ministry of Science and Technology of China (National Scientific Instrumentation Grant Program 2011YQ09000506) and the municipal government of Beijing to M.-Q.D. Publication charges were paid for by the China Ministry of Education 111 Project.
Footnotes
[Supplemental material is available for this article.]
Article published online before print. Article, supplemental material, and publication date are at http://www.genome.org/cgi/doi/10.1101/gr.176107.114.
Freely available online through the Genome Research Open Access option.
References
- Bass B, Hundley H, Li JB, Peng Z, Pickrell J, Xiao XG, Yang L. 2012. The difficult calls in RNA editing. Nat Biotechnol 30: 1207–1209. [DOI] [PubMed] [Google Scholar]
- Bazak L, Haviv A, Barak M, Jacob-Hirsch J, Deng P, Zhang R, Isaacs FJ, Rechavi G, Li JB, Eisenberg E, et al. . 2014. A-to-I RNA editing occurs at over a hundred million genomic sites, located in a majority of human genes. Genome Res 24: 365–376. [DOI] [PMC free article] [PubMed] [Google Scholar]
- Blumenthal T.2005. Trans-splicing and operons. In WormBook (ed. The C. elegans Research Community), pp. 1–9. http://www.wormbook.org. [DOI] [PubMed] [Google Scholar]
- Brenner S. 1974. The genetics of Caenorhabditis elegans. Genetics 77: 71–94. [DOI] [PMC free article] [PubMed] [Google Scholar]
- Burns CM, Chu H, Rueter SM, Hutchinson LK, Canton H, Sanders-Bush E, Emeson RB. 1997. Regulation of serotonin-2C receptor G-protein coupling by RNA editing. Nature 387: 303–308. [DOI] [PubMed] [Google Scholar]
- Danecek P, Nellaker C, McIntyre RE, Buendia-Buendia JE, Bumpstead S, Ponting CP, Flint J, Durbin R, Keane TM, Adams DJ. 2012. High levels of RNA-editing site conservation amongst 15 laboratory mouse strains. Genome Biol 13: 26. [DOI] [PMC free article] [PubMed] [Google Scholar]
- DeLuca DS, Levin JZ, Sivachenko A, Fennell T, Nazaire MD, Williams C, Reich M, Winckler W, Getz G. 2012. RNA-SeQC: RNA-seq metrics for quality control and process optimization. Bioinformatics 28: 1530–1532. [DOI] [PMC free article] [PubMed] [Google Scholar]
- Dong MQ, Venable JD, Au N, Xu T, Park SK, Cociorva D, Johnson JR, Dillin A, Yates JR III. 2007. Quantitative mass spectrometry identifies insulin signaling targets in C. elegans. Science 317: 660–663. [DOI] [PubMed] [Google Scholar]
- Flicek P, Amode MR, Barrell D, Beal K, Brent S, Carvalho-Silva D, Clapham P, Coates G, Fairley S, Fitzgerald S, et al. . 2012. Ensembl 2012. Nucleic Acids Res 40: D84–D90. [DOI] [PMC free article] [PubMed] [Google Scholar]
- Graveley BR, Brooks AN, Carlson JW, Duff MO, Landolin JM, Yang L, Artieri CG, van Baren MJ, Boley N, Booth BW, et al. . 2011. The developmental transcriptome of Drosophila melanogaster. Nature 471: 473–479. [DOI] [PMC free article] [PubMed] [Google Scholar]
- Gu T, Buaas FW, Simons AK, Ackert-Bicknell CL, Braun RE, Hibbs MA. 2012. Canonical A-to-I and C-to-U RNA editing is enriched at 3′UTRs and microRNA target sites in multiple mouse tissues. PLoS ONE 7: e33720. [DOI] [PMC free article] [PubMed] [Google Scholar]
- Higuchi M, Single FN, Kohler M, Sommer B, Sprengel R, Seeburg PH. 1993. RNA editing of AMPA receptor subunit GluR-B: a base-paired intron-exon structure determines position and efficiency. Cell 75: 1361–1370. [DOI] [PubMed] [Google Scholar]
- Higuchi M, Maas S, Single FN, Hartner J, Rozov A, Burnashev N, Feldmeyer D, Sprengel R, Seeburg PH. 2000. Point mutation in an AMPA receptor gene rescues lethality in mice deficient in the RNA-editing enzyme ADAR2. Nature 406: 78–81. [DOI] [PubMed] [Google Scholar]
- Kawahara Y, Zinshteyn B, Chendrimada TP, Shiekhattar R, Nishikura K. 2007a. RNA editing of the microRNA-151 precursor blocks cleavage by the Dicer-TRBP complex. EMBO Rep 8: 763–769. [DOI] [PMC free article] [PubMed] [Google Scholar]
- Kawahara Y, Zinshteyn B, Sethupathy P, Iizasa H, Hatzigeorgiou AG, Nishikura K. 2007b. Redirection of silencing targets by adenosine-to-inosine editing of miRNAs. Science 315: 1137–1140. [DOI] [PMC free article] [PubMed] [Google Scholar]
- Keegan LP, Gallo A, O’Connell MA. 2001. The many roles of an RNA editor. Nat Rev Genet 2: 869–878. [DOI] [PubMed] [Google Scholar]
- Kent WJ. 2002. BLAT–the BLAST-like alignment tool. Genome Res 12: 656–664. [DOI] [PMC free article] [PubMed] [Google Scholar]
- Khan Z, Amini S, Bloom JS, Ruse C, Caudy AA, Kruglyak L, Singh M, Perlman DH, Tavazoie S. 2011. Accurate proteome-wide protein quantification from high-resolution 15N mass spectra. Genome Biol 12: R122. [DOI] [PMC free article] [PubMed] [Google Scholar]
- Lehmann KA, Bass BL. 2000. Double-stranded RNA adenosine deaminases ADAR1 and ADAR2 have overlapping specificities. Biochemistry 39: 12875–12884. [DOI] [PubMed] [Google Scholar]
- Li H, Durbin R. 2009. Fast and accurate short read alignment with Burrows-Wheeler transform. Bioinformatics 25: 1754–1760. [DOI] [PMC free article] [PubMed] [Google Scholar]
- Licatalosi DD, Darnell RB. 2010. RNA processing and its regulation: global insights into biological networks. Nat Rev Genet 11: 75–87. [DOI] [PMC free article] [PubMed] [Google Scholar]
- Liu C, Song CQ, Yuan ZF, Fu Y, Chi H, Wang LH, Fan SB, Zhang K, Zeng WF, He SM, et al. . 2014. pQuant improves quantitation by keeping out interfering signals and evaluating the accuracy of calculated ratios. Anal Chem 86: 5286–5294. [DOI] [PubMed] [Google Scholar]
- Lorenz R, Bernhart SH, Honer Zu Siederdissen C, Tafer H, Flamm C, Stadler PF, Hofacker IL. 2011. ViennaRNA Package 2.0. Algorithms Mol Biol 6: 26. [DOI] [PMC free article] [PubMed] [Google Scholar]
- Morse DP, Bass BL. 1999. Long RNA hairpins that contain inosine are present in Caenorhabditis elegans poly(A)+ RNA. Proc Natl Acad Sci 96: 6048–6053. [DOI] [PMC free article] [PubMed] [Google Scholar]
- Morse DP, Aruscavage PJ, Bass BL. 2002. RNA hairpins in noncoding regions of human brain and Caenorhabditis elegans mRNA are edited by adenosine deaminases that act on RNA. Proc Natl Acad Sci 99: 7906–7911. [DOI] [PMC free article] [PubMed] [Google Scholar]
- Neeman Y, Levanon EY, Jantsch MF, Eisenberg E. 2006. RNA editing level in the mouse is determined by the genomic repeat repertoire. RNA 12: 1802–1809. [DOI] [PMC free article] [PubMed] [Google Scholar]
- Nishikura K, Yoo C, Kim U, Murray JM, Estes PA, Cash FE, Liebhaber SA. 1991. Substrate specificity of the dsRNA unwinding/modifying activity. EMBO J 10: 3523–3532. [DOI] [PMC free article] [PubMed] [Google Scholar]
- Palladino MJ, Keegan LP, O’Connell MA, Reenan RA. 2000. A-to-I pre-mRNA editing in Drosophila is primarily involved in adult nervous system function and integrity. Cell 102: 437–449. [DOI] [PubMed] [Google Scholar]
- Peng Z, Cheng Y, Tan BC, Kang L, Tian Z, Zhu Y, Zhang W, Liang Y, Hu X, Tan X, et al. . 2012. Comprehensive analysis of RNA-seq data reveals extensive RNA editing in a human transcriptome. Nat Biotechnol 30: 253–260. [DOI] [PubMed] [Google Scholar]
- Pinto Y, Cohen HY, Levanon EY. 2014. Mammalian conserved ADAR targets comprise only a small fragment of the human editosome. Genome Biol 15: R5. [DOI] [PMC free article] [PubMed] [Google Scholar]
- Piskol R, Peng Z, Wang J, Li JB. 2013. Lack of evidence for existence of noncanonical RNA editing. Nat Biotechnol 31: 19–20. [DOI] [PubMed] [Google Scholar]
- Ramaswami G, Li JB. 2014. RADAR: a rigorously annotated database of A-to-I RNA editing. Nucleic Acids Res 42: D109–D113. [DOI] [PMC free article] [PubMed] [Google Scholar]
- Ramaswami G, Lin W, Piskol R, Tan MH, Davis C, Li JB. 2012. Accurate identification of human Alu and non-Alu RNA editing sites. Nat Methods 9: 579–581. [DOI] [PMC free article] [PubMed] [Google Scholar]
- Ramaswami G, Zhang R, Piskol R, Keegan LP, Deng P, O’Connell MA, Li JB. 2013. Identifying RNA editing sites using RNA sequencing data alone. Nat Methods 10: 128–132. [DOI] [PMC free article] [PubMed] [Google Scholar]
- Rosenthal JJ, Seeburg PH. 2012. A-to-I RNA editing: effects on proteins key to neural excitability. Neuron 74: 432–439. [DOI] [PMC free article] [PubMed] [Google Scholar]
- Rueter SM, Dawson TR, Emeson RB. 1999. Regulation of alternative splicing by RNA editing. Nature 399: 75–80. [DOI] [PubMed] [Google Scholar]
- St Laurent G, Tackett MR, Nechkin S, Shtokalo D, Antonets D, Savva YA, Maloney R, Kapranov P, Lawrence CE, Reenan RA. 2013. Genome-wide analysis of A-to-I RNA editing by single-molecule sequencing in Drosophila. Nat Struct Mol Biol 20: 1333–1339. [DOI] [PubMed] [Google Scholar]
- Tao L, Xie Q, Ding YH, Li ST, Peng S, Zhang YP, Tan D, Yuan Z, Dong MQ. 2013. CAMKII and Calcineurin regulate the lifespan of Caenorhabditis elegans through the FOXO transcription factor DAF-16. eLife 2: e00518. [DOI] [PMC free article] [PubMed] [Google Scholar]
- Tabb DL, McDonald WH, Yates JR 3rd. 2002. DTASelect and Contrast: tools for assembling and comparing protein identifications from shotgun proteomics. J Proteome Res 1: 21–26. [DOI] [PMC free article] [PubMed] [Google Scholar]
- Tonkin LA, Saccomanno L, Morse DP, Brodigan T, Krause M, Bass BL. 2002. RNA editing by ADARs is important for normal behavior in Caenorhabditis elegans. EMBO J 21: 6025–6035. [DOI] [PMC free article] [PubMed] [Google Scholar]
- Trapnell C, Pachter L, Salzberg SL. 2009. TopHat: discovering splice junctions with RNA-Seq. Bioinformatics 25: 1105–1111. [DOI] [PMC free article] [PubMed] [Google Scholar]
- Trapnell C, Williams BA, Pertea G, Mortazavi A, Kwan G, van Baren MJ, Salzberg SL, Wold BJ, Pachter L. 2010. Transcript assembly and quantification by RNA-Seq reveals unannotated transcripts and isoform switching during cell differentiation. Nat Biotechnol 28: 511–515. [DOI] [PMC free article] [PubMed] [Google Scholar]
- Wang Q, Khillan J, Gadue P, Nishikura K. 2000. Requirement of the RNA editing deaminase ADAR1 gene for embryonic erythropoiesis. Science 290: 1765–1768. [DOI] [PubMed] [Google Scholar]
- Wang L, Kimble J, Wickens M. 2004. Tissue-specific modification of gld-2 mRNA in C. elegans: likely C-to-U editing. RNA 10: 1444–1448. [DOI] [PMC free article] [PubMed] [Google Scholar]
- Warf MB, Shepherd BA, Johnson WE, Bass BL. 2012. Effects of ADARs on small RNA processing pathways in C. elegans. Genome Res 22: 1488–1498. [DOI] [PMC free article] [PubMed] [Google Scholar]
- Wisniewski JR, Zougman A, Nagaraj N, Mann M. 2009. Universal sample preparation method for proteome analysis. Nat Methods 6: 359–362. [DOI] [PubMed] [Google Scholar]
- Wu D, Lamm AT, Fire AZ. 2011. Competition between ADAR and RNAi pathways for an extensive class of RNA targets. Nat Struct Mol Biol 18: 1094–1101. [DOI] [PMC free article] [PubMed] [Google Scholar]
- Xie C, Mao X, Huang J, Ding Y, Wu J, Dong S, Kong L, Gao G, Li CY, Wei L. 2011. KOBAS 2.0: a web server for annotation and identification of enriched pathways and diseases. Nucleic Acids Res 39: W316–322. [DOI] [PMC free article] [PubMed] [Google Scholar]
- Xu G, Zhang J. 2014. Human coding RNA editing is generally nonadaptive. Proc Natl Acad Sci 111: 3769–3774. [DOI] [PMC free article] [PubMed] [Google Scholar]
- Xu T, Venable J, Park SK, Cociorva D, Lu B, Liao L, Wohlschlegel J, Hewel J, Yates J III. 2006. ProLuCID, a fast and sensitive tandem mass spectra-based protein identification program. Mol Cell Proteomics 5: S174–S174. [Google Scholar]
Associated Data
This section collects any data citations, data availability statements, or supplementary materials included in this article.