

Abstract
The human genome is arguably the most complete mammalian reference assembly1–3 yet more than 160 euchromatic gaps remain4–6 and aspects of its structural variation remain poorly understood ten years after its completion7–9. In order to identify missing sequence and genetic variation, we sequenced and analyzed a haploid human genome (CHM1) using single-molecule, real-time (SMRT) DNA sequencing10. We closed or extended 55% of the remaining interstitial gaps in the human GRCh37 reference genome—78% of which carried long runs of degenerate short tandem repeats (STRs) often multiple kilobases in length embedded within GC-rich genomic regions. We resolved the complete sequence of 26,079 euchromatic structural variants at the basepair level, including inversions, complex insertions, and long tracts of tandem repeats. Most have not been previously reported with the greatest increases in sensitivity occurring for events less than 5 kbp in size. Compared to the human reference, we find a significant insertional bias (3:1) in regions corresponding to complex insertions and long STRs. Our results suggest a greater complexity of the human genome in the form of variation of longer and more complex repetitive DNA that can now be largely resolved with the application of this longer-read sequencing technology.
Keywords: human genome sequence, sequence gaps, genome assembly, PacBio, single-molecule real-time sequencing, structural variation
Data generated by SMRT sequencing technology differs significantly from most sequencing platforms because native DNA is sequenced without cloning or amplification and read lengths typically exceed 5 kbp. Despite overall lower individual read accuracy (~85%), longer read length facilitates high confidence mapping across a greater percentage of the genome11,12.We generated ~40-fold sequence coverage from a human CHM1 hydatidiform mole using long-read SMRT sequence technology (average mapped read length = 5.8 kbp; Supplementary Table S1). We selected a hydatidiform mole to sequence because it is effectively haploid lacking allelic variation and provides higher effective sequence coverage. We aligned 93.8% of all sequence reads to the human reference genome (GRCh37) using a modified version of BLASR11 (Supplementary Information) and generated local assemblies of the mapped reads using Celera13 and Quiver14, which leverage estimates of insertion, deletion, and substitution probabilities to accurately determine consensus sequences. We compared the consensus sequences of regions with previously sequenced and assembled large-insert BAC clones generated from CHM1tert15. The comparison shows a consensus sequencing concordance of >99.97% (Q37.5), with 72% of the errors confined to indels within homopolymer stretches (Supplementary Table S3).
We initially assessed whether the mapped reads could facilitate closure of any of the 164 interstitial euchromatic gaps within the human reference genome (GRCh37). We extended into gap regions using a reiterative map-and-assemble strategy where SMRT WGS sequence reads mapping to each edge of a gap were assembled into a new high-quality consensus which, in turn, served as a template for recruiting additional sequence reads for assembly (Supplementary Information). Using this approach, we closed 50 gaps and extended into 40 others (60 boundaries) adding, respectively, 398 kbp and 721 kbp of novel sequence to the genome (Supplementary Table S4). The closed gaps in the human genome were enriched for simple repeats, long tandem repeats, and high GC content (Fig. 1) but also included novel exons (Supplementary Table S20) and putative regulatory sequences based on DNase I hypersensitivity and ChIP-seq analysis (Supplementary Information). We identified a significant 15-fold enrichment of STRs when compared to a random sample (p < 0.00001) (Fig. 1a). 78% (39/50) of the closed gap sequences were composed 10% or more of STRs. The STRs were frequently embedded in longer, more complex, tandem arrays of degenerate repeats reaching up to 8,000 bp in length (Extended Data Fig. 1a–c), some of which bore resemblance to sequences known to be toxic to E. coli16. Since most human reference sequences17,18 have been derived from clones propagated in E. coli, it is perhaps not surprising that application of a long-read sequence technology to uncloned DNA would resolve such gaps. Moreover, the length and complex degeneracy of these STRs embedded within GC-rich DNA likely thwarted efforts to follow up most of these by PCR amplification and sequencing.
Figure 1. Sequence content of gap closures.
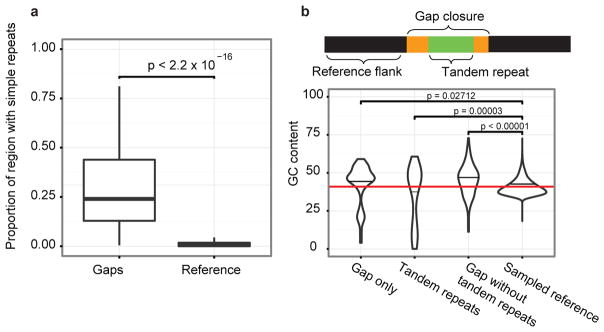
a, Gap closures are enriched for simple repeats compared to equivalently sized regions randomly sampled from GRCh37. b, Human genome gaps typically consist of GC-rich sequence flanking complex AT-rich STRs (empirical p-value; Supplementary Information).
Next, we developed a computational pipeline (Extended Data Fig. 2) to systematically characterize structural variation—defined here as differences ≥50 bp in length, including deletions, duplications, insertions, and inversions7. Structural variants (SVs) were discovered by mapping SMRT sequencing reads to the human reference genome11 and searching for specific mapping signatures (Supplementary Information). At every variant locus, we recruited all uniquely mapping reads, created a local de novo assembly, defined breakpoints compared to the human reference, and classified each SV by type and likely mechanism (Table 1). We identified a total of 26,079 insertions/deletions ≥50 bp within the euchromatic portion of the genome. Almost all insertion and deletion breakpoints were resolved at the single-basepair level generating one of the most comprehensive catalogs of structural variation (47,238 breakpoint positions). 6,796 of the events map within 3,418 genes with a subset of events (169) corresponding to variation in the spliced transcripts of 140 genes (Supplementary Table S9). From all targeted sequencing experiments combined (Supplementary Information) we estimate an overall validation rate of 97%, of which only a fraction can be detected by application of Illumina next-generation sequencing (NGS).
Table 1. A census of insertion and deletion in CHM1.
The statistics of insertion and deletion events in CHM1 compared to GRCh37 are listed by sequence category. Low complexity sequence is divided between STR and VNTR (Supplementary Information). AluY, L1HS, SVA, and HERV are active mobile elements. Alu indel events in conjunction with STR sequences or mosaic Alu are considered separate from solitary AluY MEI. Inactive MEI include L1P, and AluS mobile elements. Rarely observed elements (<10) are combined as other. Classes of structural variation showing an insertional bias (>2.5 fold excess in CHM1) are shaded.
Structural variation between CHM1 and GRCh37.
| Insertion | Deletion | Ins/Del | ||||||
|---|---|---|---|---|---|---|---|---|
| Number | Mean length | Total bases | Number | Mean length | Total bases | Total events | Total bases | |
| STR >10bp | 6,007 | 295 | 1,771,948 | 2,986 | 90 | 268,075 | 2.01 | 6.61 |
| STR >= 50 bp | 4,289 | 398 | 1,706,524 | 1,530 | 139 | 212,957 | 2.80 | 8.01 |
| STR >10, < 50bp | 1,718 | 38 | 65,424 | 1,456 | 38 | 5,518 | 1.18 | 11.86 |
| Tandem Repeat | 2,760 | 303 | 836,474 | 2,398 | 182 | 4,361,598 | 1.15 | 0.19 |
| MEI | 2,149 | 497 | 1,200,647 | 2,084 | 428 | 841,617 | 1.03 | 1.43 |
| AluY | 859 | 302 | 259,810 | 859 | 302 | 259,220 | 1.00 | 1.00 |
| LINE/L1HS | 145 | 2,412 | 349,780 | 141 | 2,411 | 339,971 | 1.03 | 1.03 |
| SVA | 457 | 369 | 168,762 | 382 | 274 | 104,589 | 1.20 | 1.61 |
| HERV | 58 | 338 | 19,619 | 60 | 180 | 10,779 | 0.97 | 1.82 |
| Alu+STR/Alu+mosaic | 287 | 413 | 118,486 | 186 | 262 | 46,905 | 1.54 | 2.53 |
| Inactive | 343 | 226 | 77,602 | 456 | 176 | 80,153 | 0.75 | 0.97 |
| Centromeric satellites | 669 | 693 | 463,687 | 817 | 722 | 590,223 | 0.82 | 0.79 |
| HSAT | 46 | 861 | 39,604 | 48 | 790 | 37,935 | 0.96 | 1.04 |
| ALR | 622 | 681 | 423,453 | 769 | 718 | 552,288 | 0.81 | 0.77 |
| Other | 168 | 112 | 18,790 | 277 | 98 | 27,144 | 0.61 | 0.69 |
| Complex | 1,115 | 1,927 | 2,148,642 | 317 | 2,066 | 654,834 | 3.52 | 3.28 |
| Unannotated | 2,386 | 60 | 143,598 | 2,313 | 62 | 143,559 | 1.03 | 1.00 |
|
| ||||||||
| Total | 17,851 | 398 | 7,112,381 | 11,819 | 271 | 3,208,633 | 1.51 | 2.22 |
| Euchromatic subtotal | 15,776 | 390 | 6,149,335 | 10,303 | 248 | 2,559,644 | 1.53 | 2.40 |
| Euchromatic subtotal (>=50 bp) | 9,638 | 542 | 5,237,445 | 6,111 | 358 | 2,189,837 | 1.58 | 2.39 |
Of all copy number differences found, 85% were novel compared to previous studies of structural variation7,8,19 in large part due to increased ascertainment of smaller variation (average length 497 bp). The effect was most pronounced for insertions where 92% of all differences had not been previously reported, in contrast to deletions where 69% of the events were novel (Fig. 2). When comparing the size distribution of insertions and deletions between the two haplotype references, we found that insertions within CHM1 were significantly longer and more abundant with 5,473 additional insertion events when compared to the human reference (Table 1). This difference contributes to a significant insertional bias of 3.9 Mbp of additional sequence either missing or expanded when compared to the human reference (Table 1). We find a substantial increase in the amount of long, ≥50 bp STR insertions relative to deletions (p < 2.2 × 10⁻¹⁶), including STRs within genes (Supplementary Table S9). In addition to being 2.80 times more frequent than deletions, the STR insertions ≥50 bp are, on average, 2.87 times longer. This asymmetry becomes more pronounced with increasing STR insertion length (Fig. 2b). The genomic distribution of STR insertions is highly nonrandom being biased to the last 5 Mbp of human chromosomes (Extended Data Fig. 3) correlating with recombination rate20 (r2 = 0.21) and human-chimpanzee divergence (r2 = 0.20). We note that 2,285 of these expanded STRs occur within genes, including 11 within an untranslated region (noting shorter insertions in FMR1 and ALS, Supplementary Information) and two within the coding sequence of genes (MUC2, SAMD1). A total of 189 genes have an STR expansion >1 kbp representing potential sites of genomic instability (Supplementary Table S9).
Figure 2. Structural variation analyses.

a, Histograms display the distribution of novel insertions (black/grey) and deletions (red/pink) between CHM1 and GRCh37 haplotypes compared to copy number variants (CNVs) identified from other studies. Most of the increased sensitivity occurs below 5 kbp. Peaks at ~300 and 6 kbp correspond to Alu and L1 insertions, respectively. b, STR insertions in CHM1 (green) are longer when compared to the human genome (blue) and this effect becomes more pronounced with increasing length (x-axis). c, The percent repeat composition (x-axis) of 1 kbp sequences flanking insertion sites for Alu, L1, and SVA MEIs. Insertion calls from the 1000 Genomes Project (light red)21 compared to calls from CHM1 using PacBio reads (blue) show increased sensitivity for repeat-rich insertions.
The remaining half of the insertional bias (~1.5 Mbp) was accounted for by 1,116 more complex SVs—defined here as insertions having either multiple annotated repeat elements or at least 30% of the remaining sequence not annotated as repeat (Table 1; Extended Data Fig. 4). Sequence analyses of these regions of the genome revealed these insertions were frequently embedded within regions already enriched for clusters of mobile element insertions (MEIs). Complex repetitive regions such as these represent a major challenge in SV detection due to spurious mapping of short-read sequence data. We performed site complexity analysis of annotated MEI loci by assessing the repeat composition of the 1 kbp sequences 5′ and 3′ flanking AluY, L1, and SVA insertions in both the CHM1 sequencing data and insertion sites from population scale low-coverage sequencing data21. While we observed a small bias in the repeat complexity of AluY insertions (53% versus 48%; p = 4.8 × 10⁻⁶ Kolmogorov-Smirnov (KS) test), a much more drastic shift is seen for L1 and SVA insertions. We found that L1HS insertion sites in CHM1 have a flanking common repeat content of 59% when compared to 39% in the 1000 Genomes Project dataset (p = 1.8 × 10⁻¹⁰, KS test) (Fig. 2c). The bias for SVA insertions is even greater with 76% of insertions mapping adjacent to repeats when compared to 50% using Illumina read-pair data (p = 3.84 × 10⁻¹⁴, KS test).
The large STR and complex insertions are enriched for regions annotated as having potential clone assembly problems. This enrichment becomes more pronounced the larger and more complex the insertion (e.g., the 185-fold enrichment of “black tag” annotations for STR insertions; Supplementary Information). Remarkably, less than 1% of these variants are present in newer assemblies of the human genome, including GRCh38 and CHM1.122 (derived primarily by Illumina sequencing technology). Since we find evidence of most of these complex events in additional human or chimpanzee genomes (Supplementary Information), we propose that ~1,700 sites (3.5 Mbp) represent deficiencies or “muted” gaps that can now be accessed as a result of SMRT technology (Supplementary Table 7). We incorporated these inserted sequences as well as gap closures into a patched GRCh37 reference effectively mapping 0.026% additional Illumina reads and discovering additional single nucleotide polymorphisms or SNPs (e.g., 9,231 SNPs; Supplementary Information).
In addition to insertions and deletions, we also searched for the presence of inversions—an SV class that is notoriously difficult to ascertain. We developed a search algorithm that specifically leveraged the increased length of the SMRT sequence reads to search for “reversals” in order when aligned to the reference. Regions with two or more reversals were then locally assembled to optimally define the breakpoints of each event. We identified 34 inversions with an average length of 7.1 kbp corresponding to a total of ~150 kbp of inverted sequence (Supplementary Table S8; Fig. S6). We subcloned and sequenced 15 events using a large-insert BAC library with a validation rate of 100% (15/15) (Extended Data Fig. 5). None of the events disrupted genes, no enrichment was observed on the X chromosome, and 68% (23/34) of the inversions were flanked by inverted repeats (Supplementary Table S8).
A limitation of our approach is its dependence on local assembly of mapped reads to the human reference genome. Even with an average mapped read length of 5.8 kbp not all reads may be uniquely mapped to a specific location. As a result, gaps (n = 82) adjacent to segmental duplications were largely unresolved, inversions exceeding the read length (>20 kbp) could not be detected (e.g., 15q13.3 region), and SMRT sequence read synthesis within or flanking long, highly identical repeats could not be reliably assembled. We identified a total of 737 euchromatic regions (12.5 Mbp) of our genome where large-scale mapping inconsistences (n = 22) or deficiencies (n = 715) were noted but were unresolvable by this approach (Supplementary Tables S26, S27). We selected one 6.5 Mbp region mapping to chromosome 10q11.23 for a more detailed analysis. The region carried seven gaps within the human reference genome (GRCh37), none of which were resolved or extended by SMRT whole-genome shotgun (WGS) sequence reads. We applied an alternate clone-based hierarchical approach (Supplementary Information) and identified a tiling path of 32 BACs and assembled the clone inserts using SMRT sequencing14. We generated sequence contigs spanning two large clusters of segmental duplication (2.7 and 1.2 Mbp) closing six of the seven gaps in this region (Fig. 3; Extended Data Fig. 6) adding 416 kbp of missing reference sequence, correcting the orientation of 1,451 kbp, and eliminating 856 kbp of redundant sequence that was represented twice within the reference. Two gaps remain, each at the same location within paralogous segmental duplications, corresponding to a nearly perfect 50 kbp tandem repeat that cannot be resolved at the level of large-insert clones using existing methods. These results indicate that while it is possible to use reads to close gaps and detect variation missed by other NGS methods, the resolution of larger, complex regions of the genome still require targeted efforts that leverage both clones and WGS data. Complete de novo assembly of human genomes will likely require the development of even longer-range sequencing data. The approaches outlined here will have broader application to many of the unfinished and complex regions of mammalian genomes.
Figure 3. CHM1 clone-based assembly of the human 10q11 genomic region.
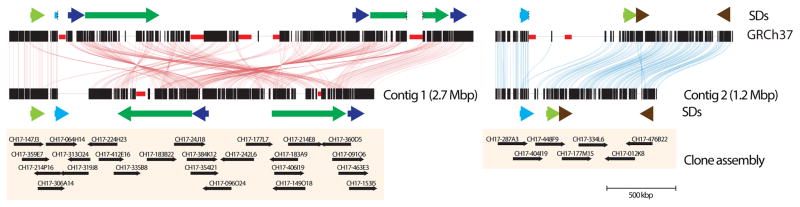
The clone-based assembly is composed primarily of BACs from the CH17 library as shown in the tiling path below the internal repeat structure of the region. Colored arrows indicate large segmental duplications with homologous sequences connected by lines generated by Miropeats23.
Methods
SMRT WGS sequence data (41-fold sequence coverage) was generated using a Pacific Biosciences RSII instrument (P5C3 chemistry) from genomic libraries generated from a complete hydatidiform mole DNA (CHM1tert). Sequence reads were mapped to the human reference genome (GRCh37) using a modified version of BLASR (www.github.com/EichlerLab/blasr) (Supplementary Methods); a bioinformatics pipeline was developed to identify regions of structural variation and extensions into gaps (www.github.com/EichlerLab/chm1-scripts); corresponding sequence reads were de novo assembled and a high-quality consensus sequence generated for each region using Celera v.8.1 and Quiver v.0.7.6. Reads are selected for support of a variant if the mapping quality is greater than 20; a minimum of 5 reads are required to trigger an assembly. For the purpose of this analysis, we focused only on the euchromatic portion of the genome excluding pericentromeric regions (5 Mbp flanking annotated centromeres), all acrocentric portions of chromosomes, and subtelomeric regions (150 kbp from the annotated telomeric sequence). Repeat content of all SVs was determined using CENSOR26, RepeatMasker27, Miropeats28 and TRF (http://tandem.bu.edu/). The sequence accuracy of the assemblies and SV polymorphisms were inferred by comparison to 18 sequenced large-insert BAC (CH17) and 89 fosmid clones8, Sanger-based BAC-end sequence generated for CHM1tert (GenBank accession pending), and comparison to Illumina-based WGS sequence generated for human genomes1. We also generated Illumina NGS WGS data (41-fold) for comparison (GenBank SRP044331). For the chromosome 10q11 region, 125 CH17 BACs were identified and sequenced using a Nextera-Illumina protocol29. A minimal tiling path of 35 clones was deeply sequenced (300-fold coverage) using 1 SMRT cell per clone; inserts were assembled and an alternate reference was created using methods described previously30.
Extended Data
Extended Data Figure 1. Sequence content of gap closures.

a, Gap closures are enriched for simple repeats compared to equivalently sized regions randomly sampled from GRCh37; examples of the organization of these regions is shown using Miropeats for (b) chromosome 4 (GRCh37, chr4:59724333-59804333), (c) chromosome 11 (GRCh37, chr11:87673378-87753378), and (d) chromosome X (GRCh37, chrX:143492324-143572324). Dotplots show the architecture of the degenerate STRs with the core motif highlighted below. Shared sequence motifs between blocks is indicated by color.
Extended Data Figure 2. Variant detection pipeline.

At every variant locus, we collected the full-length reads that overlap the locus, performed de novo assembly using the Celera assembler, and called a consensus using Quiver after remapping reads used in the assembly as well as reads flanking the assembly (yellow reads) to increase consensus quality at the boundaries of the assembly. BLASR is used to align the assembly consensus sequences to the reference, and insertions and deletions in the alignments are output as variants. Reads spanning a deletion event within a single alignment are shown as bars connected by a solid line, and double hard-stop reads spanning a larger deletion event and split into two separate alignments of the same read are shown as a dotted line.
Extended Data Figure 3. Genome distribution of closed gaps and insertions.

Chromosome ideogram heatmap depicts the normalized density of inserted CHM1 basepairs per 5 Mbp bin with a strong bias noted near the end of most chromosomes. Locations of SVs and closed gaps are given by colored diamonds to the left of each chromosome: closed gap sequences (red), inversions (green), and complex gaps (blue).
Extended Data Figure 4. Confirmation of complex insertions in additional genomes.

(top) Genotypes of polymorphic complex regions using read depth of unique k-mers (blue: present; white: absent). (bottom) Extended examples of complex insertion events: (dark blue) alignment to chimpanzee panTro4 reference; (light teal) existing human reference hg19; (dark teal) inserted sequence. The bottom rows show repeat annotations, with darker hues for repeats overlapping the inserted region.
Extended Data Figure 5. Inversion validation by BAC-insert sequencing.

Inversions detected by alignment of single long reads were validated by sequencing clones from the CHM1 BAC library (CHORI17) whose end mappings to GRCh37 spanned the putative inversions. Inversions were validated by aligning the corresponding BAC sequences to GRCh37 with Miropeats. Shared sequence between the BACs and GRCh37 is shown in black while inversion events are indicated in red.
Extended Data Figure 6. CHM1 clone-based assembly of the human 10q11 genomic region.

a, The clone-based assembly is composed primarily of BACs from the CH17 library as shown in the tiling path below the internal repeat structure of the region. Colored arrows indicate large segmental duplications with homologous sequences connected by colored lines (Miropeats). Genes annotated from alignment of RefSeq mRNA sequences with GMAP are shown. b, Miropeats comparisons of the 10q11 clone-based assembly against the corresponding sequence from GRCh37, with gaps shown in red highlights the degree to which the reference was misassembled.
Supplementary Material
Acknowledgments
We thank D. Alexander, D. Church and A. Klammer for helpful discussions, K. Mohajeri and L. Harshman for technical assistance, and T. Brown for assistance in manuscript preparation. This work was supported, in part, by U.S. National Institutes of Health (NIH) grant HG002385 to E.E.E. M.Y.D. is supported by the U.S. National Institute of Neurological Disorders and Stroke (award K99NS083627). E.E.E. is an investigator of the Howard Hughes Medical Institute.
Footnotes
DATA RELEASE
All underlying SMRT WGS sequence read data has been released within the NCBI GenBank Sequence Read Archive (SRA) accession SRX533609 and may also be accessed as part of all the SMRT datasets via this link: http://www.ncbi.nlm.nih.gov/sra/?term=SRP040522. Illumina NGS WGS data for CHM1 are available in the NCBI SRA under accession SRP044331 as well as finished BAC and fosmid clone inserts using SMRT sequence data (GenBank accessions in Supplementary Table S35). For the purpose of mapping and annotation, we developed a patched GRCh37 reference genome including a track hub for upload into the UCSC Genome Browser. A complete list of all inaccessible regions of the human genome and a database of heterochromatic and subtelomeric sequence reads that could not be assembled are available at http://eichlerlab.gs.washington.edu/publications/chm1-structural-variation.
AUTHOR CONTRIBUTIONS
E.E.E., M.J.C., M.Y.D., J.H. and J.K. designed experiments; M.M. prepared DNA; M.M. and M.B. prepared libraries and generated sequence data; P.H.S., J.H. and M.Y.D. identified clones for sequencing; J.H., P.H.S., M.Y.D., F.H. and M.J.C. performed bioinformatics analyses; M.Y.D. and M.M. performed targeted sequencing of clones; M.J.C. designed algorithms and pipelines for mapping SMRT sequence data and detection of SVs; M.W.H., R.K.W., U.S., R.S. and J.A.S. provided access to critical resources; J.L. deposited SMRT sequence data into SRA; M.J.C., J.H. and E.E.E. wrote the manuscript.
COMPETING FINANCIAL INTERESTS
The authors declare competing financial interests. M.B., J.L., M.W.H. and J.K. are employees of Pacific Biosciences, Inc., a company commercializing DNA sequencing technologies; E.E.E. is on the scientific advisory board (SAB) of DNAnexus, Inc. and was formerly an SAB member of Pacific Biosciences, Inc. (2009–2013) and SynapDx Corp. (2011–2013); and M.J.C. was a former employee for Pacific Biosciences, Inc.
References
- 1.1000 Genomes Project Consortium. An integrated map of genetic variation from 1. 092 human genomes. Nature. 2012;491:56–65. doi: 10.1038/nature11632. [DOI] [PMC free article] [PubMed] [Google Scholar]
- 2.The International HapMap Project Consortium. Nature. 2003;426:789–796. doi: 10.1038/nature02168. [DOI] [PubMed] [Google Scholar]
- 3.International Human Genome Sequencing Consortium. Finishing the euchromatic sequence of the human genome. Nature. 2004;431:931–945. doi: 10.1038/nature03001. [DOI] [PubMed] [Google Scholar]
- 4.Kurahashi H, et al. Molecular cloning of a translocation breakpoint hotspot in 22q11. Genome Research. 2007;17:461–469. doi: 10.1101/gr.5769507. [DOI] [PMC free article] [PubMed] [Google Scholar]
- 5.Genovese G, et al. Using population admixture to help complete maps of the human genome. Nature Genetics. 2013;45:406–414. 414e401–402. doi: 10.1038/ng.2565. [DOI] [PMC free article] [PubMed] [Google Scholar]
- 6.Bovee D, et al. Closing gaps in the human genome with fosmid resources generated from multiple individuals. Nature Genetics. 2008;40:96–101. doi: 10.1038/ng.2007.34. [DOI] [PubMed] [Google Scholar]
- 7.Mills RE, et al. Mapping copy number variation by population-scale genome sequencing. Nature. 2011;470:59–65. doi: 10.1038/nature09708. [DOI] [PMC free article] [PubMed] [Google Scholar]
- 8.Kidd JM, et al. A human genome structural variation sequencing resource reveals insights into mutational mechanisms. Cell. 2010;143:837–847. doi: 10.1016/j.cell.2010.10.027. [DOI] [PMC free article] [PubMed] [Google Scholar]
- 9.Eichler EE, Clark RA, She X. An assessment of the sequence gaps: unfinished business in a finished human genome. Nature Reviews Genetics. 2004;5:345–354. doi: 10.1038/nrg1322. [DOI] [PubMed] [Google Scholar]
- 10.Eid J, et al. Real-time DNA sequencing from single polymerase molecules. Science. 2009;323:133–138. doi: 10.1126/science.1162986. [DOI] [PubMed] [Google Scholar]
- 11.Chaisson MJ, Tesler G. Mapping single molecule sequencing reads using basic local alignment with successive refinement (BLASR): application and theory. BMC Bioinformatics. 2012;13:238. doi: 10.1186/1471-2105-13-238. [DOI] [PMC free article] [PubMed] [Google Scholar]
- 12.Lee H, Schatz MC. Genomic dark matter: the reliability of short read mapping illustrated by the genome mappability score. Bioinformatics. 2012;28:2097–2105. doi: 10.1093/bioinformatics/bts330. [DOI] [PMC free article] [PubMed] [Google Scholar]
- 13.Myers EW, et al. A Whole-Genome Assembly of Drosophila. Science. 2000;287:2196–2204. doi: 10.1126/science.287.5461.2196. [DOI] [PubMed] [Google Scholar]
- 14.Chin CS, et al. Nonhybrid, finished microbial genome assemblies from long-read SMRT sequencing data. Nature Methods. 2013;10 doi: 10.1038/nmeth.2474. [DOI] [PubMed] [Google Scholar]
- 15.Huddleston JRS, Malig M, Antonacci F, Chaisson M, Hon L, Sudmant PH, Graves TA, Alkan C, Dennis MY, Wilson RK, Turner SW, Korlach J, Eichler EE. Reconstructing complex regions of genomes using long-read sequencing technology. Genome Research. 2014 doi: 10.1101/gr.168450.113. [DOI] [PMC free article] [PubMed] [Google Scholar]
- 16.Kimelman A, et al. A vast collection of microbial genes that are toxic to bacteria. Genome Research. 2012;22:802–809. doi: 10.1101/gr.133850.111. [DOI] [PMC free article] [PubMed] [Google Scholar]
- 17.Lander ES, et al. Initial sequencing and analysis of the human genome. Nature. 2001;409:860–921. doi: 10.1038/35057062. [DOI] [PubMed] [Google Scholar]
- 18.Venter JC, et al. The sequence of the human genome. Science. 2001;291:1304–1351. doi: 10.1126/science.1058040. [DOI] [PubMed] [Google Scholar]
- 19.Conrad DF, et al. Origins and functional impact of copy number variation in the human genome. Nature. 2010;464:704–712. doi: 10.1038/nature08516. [DOI] [PMC free article] [PubMed] [Google Scholar]
- 20.Kong A, et al. A high-resolution recombination map of the human genome. Nature Genetics. 2002;31:241–247. doi: 10.1038/ng917. [DOI] [PubMed] [Google Scholar]
- 21.Stewart C, et al. A comprehensive map of mobile element insertion polymorphisms in humans. PLoS Genetics. 2011;7:e1002236. doi: 10.1371/journal.pgen.1002236. [DOI] [PMC free article] [PubMed] [Google Scholar]
- 22.Meltz Steinberg K, et al. Single haplotype assembly of the human genome from a hydatidiform mole. 2014 doi: 10.1101/006841. [DOI] [PMC free article] [PubMed] [Google Scholar]
- 23.Parsons JD. Miropeats: graphical DNA sequence comparisons. Computer applications in the biosciences: CABIOS. 1995;11:615–619. doi: 10.1093/bioinformatics/11.6.615. [DOI] [PubMed] [Google Scholar]
- 24.Jurka J, Klonowski P, Dagman V, Pelton P. CENSOR--a program for identification and elimination of repetitive elements from DNA sequences. Computers & Chemistry. 1996;20:119–121. doi: 10.1016/s0097-8485(96)80013-1. [DOI] [PubMed] [Google Scholar]
- 25.Smit AFA, Hubley R, Green P. RepeatMasker Open-3.0. 1996–2010. [Google Scholar]
- 26.Adey A, et al. Rapid, low-input, low-bias construction of shotgun fragment libraries by high-density in vitro transposition. Genome Biology. 2010;11:R119. doi: 10.1186/gb-2010-11-12-r119. [DOI] [PMC free article] [PubMed] [Google Scholar]
- 27.Huddleston J, et al. Reconstructing complex regions of genomes using long-read sequencing technology. Genome Research. 2014;24:688–696. doi: 10.1101/gr.168450.113. [DOI] [PMC free article] [PubMed] [Google Scholar]
Associated Data
This section collects any data citations, data availability statements, or supplementary materials included in this article.