Abstract
Huntington’s disease (HD) is a progressive neurodegenerative disorder caused by a polyglutamine expansion in the Huntingtin protein which results in the selective degeneration of striatal medium spiny neurons (MSN). A number of genetic mouse models have been developed to model HD phenotype. Most of these models display impaired performance in motor coordination assays and variety of neuropathological abnormalities. Quantitative neuropathological assessment in these mice requires application of stereological techniques and very labor-intensive and time consuming. Here, we report a development of a novel paradigm that simplifies and accelerates quantitative evaluation of striatal atrophy in HD mice. To achieve this goal, we crossed YAC128 HD transgenic mice with Rgs9-EGFP mice. In Rgs9-EGFP mice the EGFP transgene is expressed selectively in MSN neurons at high levels. Using high resolution fluorescence laser scanning imager, we have been able to precisely measure striatal area and intensity of EGFP expression in coronal slices from these mice at 2 months, 4 months and 9 months of age. Using this approach, we demonstrated significant reduction in striatal volume in YAC128 mice at 4 months and 9 months of age when compared to wild type littermates. We evaluated behavior performance of these mice at 2 months, 4 months and 6 months of age and demonstrated significant impairment of YAC128 mice in beam walk assay at 4 months and 6 months of age. This new mouse model and the quantitative neuropathological scoring paradigm may simplify and accelerate discovery of novel neuroprotective agents for HD.
Keywords: Huntington’s disease, transgenic, Gensat, imaging, striatum, high-throughput, neuroprotection, behavior
INTRODUCTION
Huntington’s disease (HD) is a devastating, hereditary and degenerative brain disorder caused by a polyglutamine expansion in the Huntingtin protein [1]. The pathological hallmark of HD is the loss of medium spiny neurons (MSN) in the striatum, which accounts for some of the major clinical symptoms of the disease. The clinical picture of HD includes chorea, psychiatric disturbance, gradual dementia, and death [2]. The dopamine signalling antagonist, tetrabenazine (a selective vesicular monoamine transporter inhibitor), has been recently approved in the United States by the Food and Drug Administration for treatment of HD symptoms [3, 4]. There is no disease-modifying therapy currently available to prevent the onset of HD symptoms or slow the progression of the disease, in large part due to an insufficient understanding of its pathogenesis.
A number of genetic mouse models has been developed for studies of HD [5, 6]. These models display variety of HD-like behavioral phenotypes and neuropathological abnormalities and used widely in HD field to perform mechanistic studies and to evaluate potential therapeutic agents. Immunohisto-chemical staining for striatal markers (for example DARPP-32) is often used to evaluate progression of neuropathology in these mice. However, such approach is semi-quantitative. Stereological counts provide precise measure of neuronal loss [7, 8]. Our previous analysis of MSN loss in YAC128 HD mice was based on stereology-based quantification of NeuN-positive cell nuclei [9–12]. Stereological approach is appropriate for this purpose, but it is extremely labor intensive and time consuming as it requires staining of multiple striatal sections and manual scoring using Stereoinvestigator software. Stereological quantification approach is also prone to “user-bias” [7, 8]. For all these reasons it is not widely used in the HD field.
In order to develop a simple and quantitative assay of striatal atrophy in HD mice, we crossed heterozygotous YAC128 HD transgenic mice with homozygotous BAC-Rgs9-EGFP mice (Rgs9-EGFP) developed by Gensat consortium [13]. We prepared coronal sections from Rgs9-EGFP/Rgs9-EGFP and YAC128/+; Rgs9-EGFP/Rgs9-EGFP mice at different ages. Using high resolution fluorescence laser scanning imager, we have been able to easily quantify the shape of striatal region and intensity of EGFP expression in coronal slices from these mice at different ages. We also evaluated behavior performance and demonstrated significant impairment of aging YAC128/+; Rgs9-EGFP/Rgs9-EGFP mice in beam walk assay. This new mouse model and the developed quantitative and unbiased striatal atrophy scoring paradigm may simplify and accelerate discovery of novel neuroprotective agents for HD.
MATERIALS AND METHODS
Generation of Rgs9-EGFP/Rgs9-EGFP and YAC128/+; Rgs9-EGFP/Rgs9-EGFP mice
All animal studies were approved by the University of Texas Southwestern Medical Center Animal Care and Use Committee. The Rgs9-EGFP mice [13] were obtained from MMRRC (line 252, Mutant Mouse Regional Resource Centers). These mice were crossed to each other to establish homozygous mouse line Rgs9-EGFP/Rgs9-EGFP (FVB background strain). This line was maintained by intercross between the homozygous animals. YAC128 heterozygotous mice (FVB background) [14] was crossed to the homozygous Rgs9-EGFP mice for 2 generations to obtain YAC128/+; Rgs9-EGFP/Rgs9-EGFP mice. The YAC128/+; Rgs9-EGFP/Rgs9-EGFP line was maintained by crossing with Rgs9-EGFP/Rgs9-EGFP mice. The presence of YAC128 transgene was confirmed by genotyping with primers specific for exons 44 and 45 of human Htt gene as we previously described [9, 10, 15]. Both the Rgs9-EGFP/Rgs9-EGFP and YAC128/+; Rgs9-EGFP/Rgs9-EGFP mice were healthy and fertile. In this paper we use “WT” to identify Rgs9-EGFP/Rgs9-EGFP mice and “YAC” to identify YAC128/+; Rgs9-EGFP/Rgs9-EGFP mice.
Motor coordination assessment in mice
The beam walking assay was performed as described previously for YAC128 mice [9, 10]. In these experiments we tested 11 WT mice and 15 YAC mice at 2 months, 4 months and 6 months of age. At each time point, the mice were trained on 17 mm round beam, 11 mm round beam and 5 mm square beam for 3 consecutive days (3 trials per day) to traverse the beam to the enclosed box. On the fourth day, the mice were tested on 11 mm round and 5 square beams. The latency to traverse the middle section (80 cm in length) of each beam and the number of times the hind feet slipped off each beam were recorded for each trial. For each measure, the mean scores of the three trials for each beam were used in the analysis.
Neuropathological assessment in mice
At the age of 2, 4 and 9 months old, the mice were terminally anesthetized with Euthasol solution and perfused transcardially with 15 ml PBS solution followed by 100 ml of fixative solution (4% paraformaldehyde in 0.1M PBS, pH7.4). All the brains were removed from skull and weighed. The brains were postfixed overnight at 4 °C in 4% paraformaldehyde and equilibrated in 25% (w/v) sucrose in PBS. The brains were sliced to 30 μm-thick coronal sections using a Leica (Bannock-burn, IL) SM2000R sliding microtome. The sections throughout the striatum (in the range from +1.70 mm to −2.30 mm relative to bregma) were mounted on the slides. The slides were scanned using IsoCyte laser scanning imager. The IsoCyte system was set up using the 488 excitation laser. EGFP has an excitation/emission spectrum of 488 nm and 509 nm. A 510–540 nm band pass filter is used for EGFP emission. The PMT gain of the green channel was set at 550 mV and 1x sensitivity. The image acquisition was done at 10 × 10 micro resolution using BBIsoCyte software.
The MetaXpress analysis software was used to obtain quantitative information from these images. The regions of interest on each slice were initially selected manually for the analysis and the exact boundaries of the EGFP-positive area was determined automatizally by the software. The analysis of images within selected regions of interest was performed by the software, resulting in measurement of total EGFP signal intensity and the size of EGFP-positive area for each slice. To estimate striatal volume the EGFP-positive area measurements from each slice (between 110 – 130 slices covering striatal region) were summed up for each mice. The EGFP signal intensities from each slice were summed up for each mice as well. The “surrogate striatal volume” and “total EGFP signal intensity” were calculated for each group of mice.
Statistical data analysis
For comparison between two groups, Student’s unpaired t test was used to statistically analyze data. Repeated measure ANOVA were used for the behavior experiment mice. Statistical power was calculated as described [16].
RESULTS
Motor coordination deficit in YAC128/+; Rgs9-EGFP/Rgs9-EGFP mice
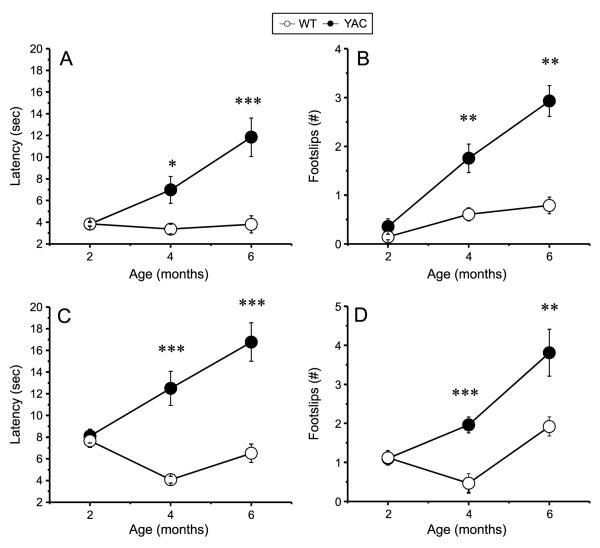
The breeding colonies of Rgs9-EGFP/Rgs9-EGFP (WT) and YAC128/+; Rgs9-EGFP/Rgs9-EGFP (YAC) mice were established as described in Methods. The mice were viable and fertile. We selected Rgs9-EGFP/Rgs9-EGFP homozygotous mice for this breeding as EGFP signal was weaker in striatal section from Rgs9-EGFP/+ heterozygotous mice (data not shown). Also, use of homozygotous mice simplified breeding strategy as only genotyping for YAC128 transgene was necessary. A cohort of 11 female WT and 15 female YAC littermates was selected for behavioral studies. The average weight of YAC mice was significantly higher than the weight of WT mice at all ages (Fig. 1), consistent with known effects of Htt transgene overexpression [14]. Motor coordination and balancing capabilities of both groups of mice were assessed at 2 months, 4 months and 6 months of age by beam walk assay performed as we previously described [9, 10]. In these experiments we tested the mice on 11 mm round and 5 mm square beams to achieve different levels of task difficulty. The mice were trained to walk across these beams to reach an enclosed box, and the time to traverse the beam and the number of foot slips while walking on the beam were recorded for each trial. We found that the beam walk performances of WT and YAC mice were similar at 2 months of age (Fig. 2). With age, the YAC mice exhibited a progressive impairment in beam walk ability compared with WT mice. The YAC mice had significantly longer beam traverse latencies (Fig. 2A, C) and significantly increased number of foot slips when compared to WT mice (Fig. 2B, D) at 4 months and 6 months of age. During beam walking experiments, we noticed some 6-month-old YAC mice exhibited crawling behavior, which was manifested as prolonged contact between the thorax and abdomen of the mice and beam surface. These mice used forelimbs to drag themselves along the beam. Starting from the age of 8 months, most of the YAC mice fell off the 11 mm round and 5 mm square beams, which made the data collection impossible. In contrast, none of the WT mice exhibited crawling behavior or fell off the beams at any age between 2 and 8 months. Based on behavioral evaluation we concluded that YAC mice showed impaired motor coordination compared with WT mice. This motor deficit appeared at 4 month of age and become more severe with age. Interestingly, the motor deficit in YAC128/+; Rgs9-EGFP/Rgs9-EGFP mice developed faster and was more severe than in YAC128 mice in the same beamwalking assay [9–12].
Fig. 1.
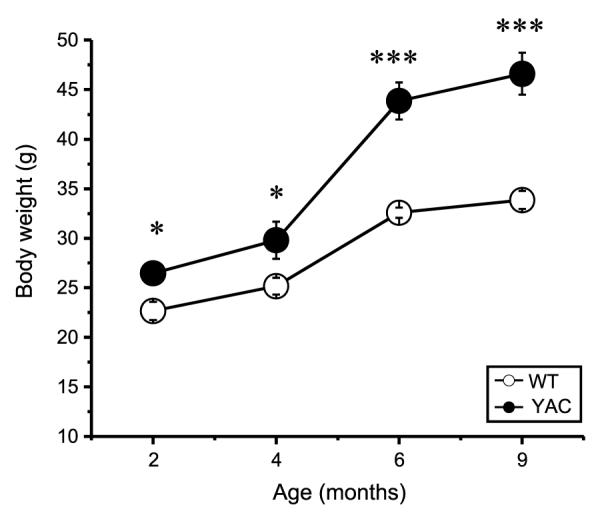
Body weight of YAC and WT mice. Total body weight of YAC and WT mice were compared at 2, 4, 6, and 9 months of age. The data for WT mice (open circles, n = 11) and YAC mice (filled black circles, n = 15) are shown as mean ± SEM at 2, 4, 6 and 9 months of age.
Fig. 2.
Beam walk performance of YAC and WT mice. The average time to cross the beam (A, C) and the average number of foot slips on the beam (B, D) are shown for beam walk experiments performed with 11 mm round beam (A, B) and 5 mm square beam (C, D). The data for WT mice (open circles, n = 11) and YAC mice (filled circles, n = 15) are shown as mean ± SEM at 2, 4 and 6 month time points. *p < 0.05; **p < 0.01; ***p < 0.001.
Quantitative analysis of striatal shrinkage in YAC128/+; Rgs9-EGFP/Rgs9-EGFP mice
Selective loss of striatal medium spiny neurons is a major neuropathological hallmark of HD. Previous analysis of YAC128 mice revealed strong connection between impaired motor coordination and striatal MSN loss in these mice [9–12, 14]. In our previous studies stereological technqiues were used to quantify MSN loss in aging YAC128 mice [9–12]. However, stereological quantification of neuronal numbers is time consuming, labor intensive and prone to operator-dependent bias. In the present study we focused on developing a procedure for simple and quantitative analysis of striatal atrophy. To achieve this goal, we took an advantage of MSN-specific expression of EGFP protein to compare striatal size in age-matched YAC128/+; Rgs9-EGFP/Rgs9-EGFP (YAC) and Rgs9-EGFP/Rgs9-EGFP (WT) mice. The brains of 2 months, 4 months and 9 months old WT and YAC mice were removed from the skull and weighed after transcardial perfusion. At the age of 2 months, the brain weights of WT (n = 7) and YAC(n = 7) mice were similar (Fig. 3). At the age of 4 months, the brain weights of both groups increased compared with 2-month data point. There was some reduction in brain weight of YAC mice (n = 6) when compared with WT mice (n = 6), but the difference did not reach a level of statistical significance (Fig. 3). At the age of 9 months, the average brain weight of WT mice was 0.511 ± 0.013 g (n = 15) and the average brain weight of YAC mice was 0.460 ± 0.012 g (n = 15), significantly (p < 0.05) lower (Fig. 3).
Fig. 3.
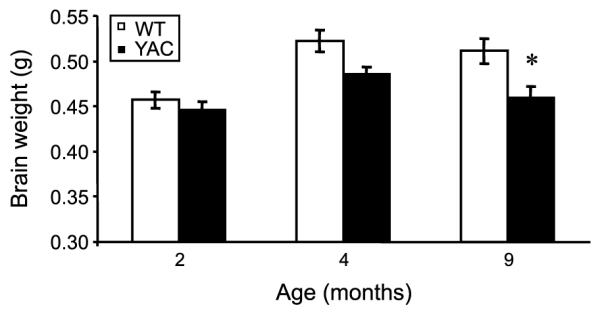
Brain weight of YAC and WT mice. Total brain weights of WT mice at 2 months (n = 7), 4 months (n = 6) and 9 months (n = 9) of age are shown as mean ± SEM (open bars). Total brain weights of YAC mice are shown at 2 months (n = 7), 4 months (n = 6) and 9 months (n = 15) of age as mean ± SEM (filled bars). *p < 0.05.
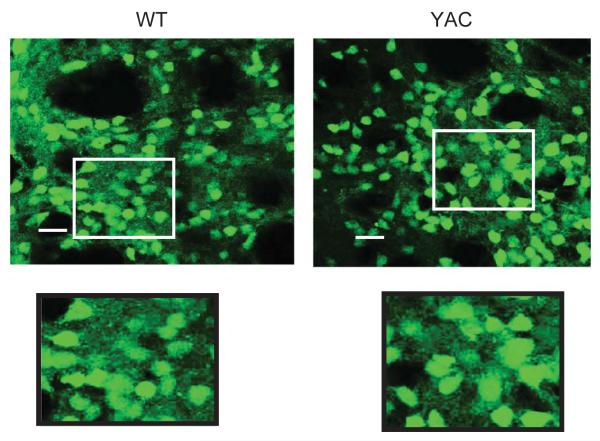
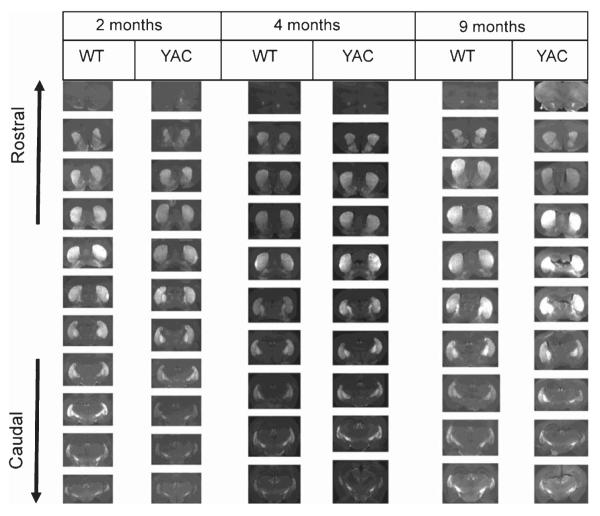
The extracted brains were fixed, frozen, and sliced with the microtome. The 30 μm-thick coronal coronal sections through striatal region were mounted on the slides. In confocal imaging experiments we observed specific expression of EGFP transgene in MSN neurons in YAC128/+; Rgs9-EGFP/Rgs9-EGFP (YAC) and Rgs9-EGFP/Rgs9-EGFP (WT) mice (Fig. 4). This is in agreement with the data reported by Gensat consortium [13]. EGFP signal was observed in soma and dendrites of MSNs in these slices (Fig. 4, insert). To quantify EGFP signals, the slides were scanned using IsoCyte laser scanning imager. The representative images of the coronal sections spaced 360 μm apart throughout the striatum are shown for WT and YAC mice at 2 months, 4 months and 9 months (Fig. 5).
Fig. 4.
Confocal imaging of striatal slices from WT and YAC mice. Confocal images of GFP signals in striatal slices from 9 months old WT and YAC mice are shown. Inserts are shown at higher magnification. The scale bar is 20 μm.
Fig. 5.
Striatal morphology in YAC and WT mice. Representative scans of brain coronal sections from WT and YAC mice at the age of 2, 4 and 9 months are shown. Representative images of serial brain sections spaced 360 μm apart are shown for each age and group of mice. The sections obtained from each mice are arranged from rostral to caudal.
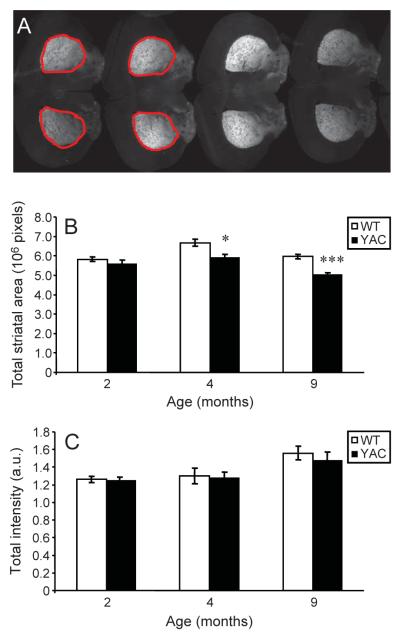
Quantitative analysis of EGFP fluorescence on each slice and for each mice was performed as described in Methods. To facilitate this analysis, the approximate boundaries of EGFP fluorescent area on each slice were initially outlined manually (Fig. 6A), with the remainder of the analysis and quantification performed in a fully automated manner. From this analysis we found that at 2 month of age, there was no difference between the average “surrogate striatal volume” of WT (n = 7) and YAC (n = 7) mice (Fig. 6B). At 4 months of age, average striatal volume of YAC mice (n = 6) was significantly (p < 0.05, statistical power of 50%) reduced when compared to average striatal volume of WT mice (n = 6) (Fig. 6B). Interestingly, motor behavior impairment in YAC mice was also manifested at 4 months time point (Fig. 2). At 9 months of age, average striatal volume of YAC mice (n = 15) was even more significantly (p < 0.001, statistical power of 90%) reduced when compared to average striatal volume of WT mice (n = 11) (Fig. 6B). This is consistent with more dramatic behavioral phenotype of 6 months old and 8 months old YAC mice (Fig. 2). We have not observed significant difference in total EGFP signal intensity between WT and YAC mice at any time point (Fig. 6C). We observed an increase in EGFP signal intensity with aging of the mice, but there was no difference between WT and YAC mice when compared at the same age. These results suggest that the function of RGS9 promoter and expression of EGFP protein were not affected in YAC mice when compared to WT mice.
Fig. 6.
Quantification of striatal morphology in YAC and WT mice. A, Representative scans of coronal section analyzed by MetaXpress software. The region of interest was selected manually and is shown by red line on 4 slices on the left. B, C The average striatal volume (B) and total EGFP fluorescence (C) for WT mice at 2 months (n = 7), 4 months (n = 6) and 9 months (n = 9) of age are shown as mean ± SEM (open bars). The average surrogate striatal volume (B) and total EGFP fluorescence (C) for YAC mice are shown at 2 months (n = 7), 4 months (n = 6) and 9 months (n = 15) of age as mean SEM (filled bars). *p < 0.05; ***p < 0.001.
DISCUSSION
In mechanistic and preclinical studies with genetic HD mouse models, the behavioral phenotypes are typically assessed by motor coordination assays (such as rotarod and beamwalk). Neuropathological assessment is performed by semi-quantitative techniques (such as DARPP-32 staining intensity) or by quantitative stereological methods. In our previous studies stereological technqiues were used to quantify MSN loss in aging YAC128 mice [9–12]. However, stereological methods are time consuming, labor intensive and prone to operator-dependent bias. In the present study we focused on developing a procedure for simple and quantitative analysis of striatal atrophy. We took an advantage of Rgs9-EGFP mice developed by Gensat consortium [13]. The RGS9 is a striatal-specific gene and by crossing Rgs9-EGFP mice with YAC128 mice we have been able to achieve specific fluorescent labeling of MSN with EGFP protein (Fig. 4). In behavioral studies we demonstrated that generated YAC128/+; Rgs9-EGFP/Rgs9-EGFP (YAC) mice has significantly impaired performance in beam-walking assay at 4 and 6 months of age (Fig. 2). The phenotype of YAC128/+; Rgs9-EGFP/Rgs9-EGFP mice became so severe at 8 months of age that the mice were not able to perform the beamwalk task at this age. In our previous studies YAC128 mice exhibited motor deficit on 5 mm square beam around 6 to 7 month of age and on 11 mm round beam around 9 month of age [9–12]. Therefore, phenotype of YAC128/+; Rgs9-EGFP/Rgs9-EGFP mice developed much faster than the phenotype of YAC128 mice. One possibility that may explain this observation is that increased weight of YAC128/+; Rgs9-EGFP/Rgs9-EGFP mice (Fig. 1) makes motor performance tasks more challenging. Another possibility is potential toxic effects of EGFP transgene overexpression, as toxic effects of transgenic expression of EGFP has been previously reported in cardiac tissue [17]. Although Rgs9-EGFP mice are normal in beam walk behavior experiments (Fig. 2), it is however possibile that overexpression of EGFP causes additional neuronal stress which is magnified in the presence of the mutant Huntingtin in YAC mice.
By using Isocyte fluorescence laser scanning imager, we have been able to quantify striatal atrophy in YAC128/+; Rgs9-EGFP/Rgs9-EGFP mice at different ages (Figs. 5 and 6). We discovered significant striatal shrinkage at 4 and 9 months of age in these mice when compared to age-matched Rgs9-EGFP/Rgs9-EGFP mice (Fig. 6B). Therefore, 4 months time point corresponded to appearance of phenotype in both behavioral and neuropathological assessment in this mouse model. This is significantly earlier than observed for most other full-length HD transgenic models [5, 6]. Surprisingly, we have not detected significant loss in total EGFP signal in these mice as a function of age (Fig. 6C). In the previous studies we used stereology-based quantification of NeuN-positive cell nuclei to score neurodegenerative phenotype in YAC128 mice [9–12]. However, downregulation of NeuN is one of the early pathological events in this model, and preeceds cell death. Thus, it is likely that loss of NeuN staining in our previous experiments was a measure of early stages of neuronal pathology, not of cell death. Results in the present manuscript indicate that “striatal atrophy” in these mice occurs prior to cell death, and most likely reflect cell shrinkage. This findings is consistent with previous analysis of striatal pathology in R6/2 mice [18] and probably reflect striatal atrophy in presymptomatic and early symptomatic human HD patients [19]. Confocal images of WT and YAC slices at 9 months of age did not reveal obvious differences in size of the MSN somas (Fig. 4). It is possible that striatal atrophy in this model results from reduction in the size of dendritic fields, as has been previously suggested for R6/2 mice mice [18]. It is also possible that striatal shrinkage occurs due to reduced numbers of cortical or thalamic axons in the striatum, which have not been visualized in our experiments. Careful cellular and morphological analysis of striatal slices from this model need to be performed in the future to discriminate between these possibilities.
Importantly, procedure used to quantify striatal atrophy in our studies did not rely on staining with antibodies and was mostly automated. Both of these factors reduced variability and bias. The approach was also time-efficient. No time had to be spend on immunostaining steps. The scan of striatal slices from each mouse brain took several minutes and analysis of the images took less than 30 minutes. This is compare to at least 1 full day that was needed to perform stereological analysis of a single mouse striatum in our previous studies. For the reasons outlined above we hope that described approach and the mouse model may simplify and accelerate discovery of novel neuroprotective agents for HD.
ACKNOWLEDGMENTS
We are grateful to members of Ilya Bezprozvanny laboratory for advice and suggestions and to Leah Taylor and Polina Plotnikova for administrative assistance. IB is a holder of the Carl J. and Hortense M. Thomsen Chair in Alzheimer’s Disease Research. PE is a holder of Presidential Stipend 2354.2013.4. This work was supported by the NIH grants R01NS074376 and R01NS056224 (I.B.), by the contract with the Russian Ministry of Science 11.G34.31.0056 (I.B), and by the Russian Scientific Fund grant 14-25-00024 (IB).
Footnotes
CONFLICT OF INTEREST STATEMENT IB is a paid consultant of Ataxion Inc. None of the other authors have any financial interests related to this work.
REFERENCES
- [1].A novel gene containing a trinucleotide repeat that is expanded and unstable on Huntington’s disease chromosomes. The Huntington’s Disease Collaborative Research Group. Cell. 1993;72:971–83. doi: 10.1016/0092-8674(93)90585-e. [DOI] [PubMed] [Google Scholar]
- [2].Vonsattel JP, DiFiglia M. Huntington disease. J Neuropathol Exp Neurol. 1998;57:369–84. doi: 10.1097/00005072-199805000-00001. [DOI] [PubMed] [Google Scholar]
- [3].HSG Tetrabenazine as antichorea therapy in Huntington disease: A randomized controlled trial. Neurology. 2006;66:366–72. doi: 10.1212/01.wnl.0000198586.85250.13. [DOI] [PubMed] [Google Scholar]
- [4].Hayden MR, Leavitt BR, Yasothan U, Kirkpatrick P. Tetrabenazine. Nat Rev Drug Discov. 2009;8:17–8. doi: 10.1038/nrd2784. [DOI] [PubMed] [Google Scholar]
- [5].Heng MY, Detloff PJ, Albin RL. Rodent genetic models of Huntington disease. Neurobiol Dis. 2008;32:1–9. doi: 10.1016/j.nbd.2008.06.005. [DOI] [PubMed] [Google Scholar]
- [6].Ehrnhoefer DE, Butland SL, Pouladi MA, Hayden MR. Mouse models of Huntington disease: Variations on a theme. Dis Model Mech. 2009;2:123–29. doi: 10.1242/dmm.002451. [DOI] [PMC free article] [PubMed] [Google Scholar]
- [7].Schmitz C, Hof PR. Design-based stereology in neuroscience. Neuroscience. 2005;130:813–31. doi: 10.1016/j.neuroscience.2004.08.050. [DOI] [PubMed] [Google Scholar]
- [8].Glaser JR, Glaser EM. Stereology, morphometry, and mapping: The whole is greater than the sum of its parts. J Chem Neuroanat. 2000;20:115–26. doi: 10.1016/s0891-0618(00)00073-9. [DOI] [PubMed] [Google Scholar]
- [9].Tang TS, Chen X, Liu J, Bezprozvanny I. Dopaminergic signaling and striatal neurodegeneration in Huntington’s disease. J Neurosci. 2007;27:7899–7910. doi: 10.1523/JNEUROSCI.1396-07.2007. [DOI] [PMC free article] [PubMed] [Google Scholar]
- [10].Tang TS, Guo C, Wang H, Chen X, Bezprozvanny I. Neuroprotective effects of inositol 1,4,5-trisphosphate receptor C-terminal fragment in a Huntington’s disease mouse model. J Neurosci. 2009;29:1257–66. doi: 10.1523/JNEUROSCI.4411-08.2009. [DOI] [PMC free article] [PubMed] [Google Scholar]
- [11].Wang H, Chen X, Li Y, Tang TS, Bezprozvanny I. Tetrabenazine is neuroprotective in Huntington’s disease mice. Mol Neurodegener. 2010;5:18. doi: 10.1186/1750-1326-5-18. [DOI] [PMC free article] [PubMed] [Google Scholar]
- [12].Chen X, Wu J, Lvovskaya S, Herndon E, Supnet C, Bezprozvanny I. Dantrolene is neuroprotective in Huntington’s disease transgenic mouse model. Mol Neurodegener. 2011;6:81. doi: 10.1186/1750-1326-6-81. [DOI] [PMC free article] [PubMed] [Google Scholar]
- [13].Gong S, Zheng C, Doughty ML, Losos K, Didkovsky N, Schambra UB, Nowak NJ, Joyner A, Leblanc G, Hatten ME, Heintz N. A gene expression atlas of the central nervous system based on bacterial artificial chromosomes. Nature. 2003;425:917–25. doi: 10.1038/nature02033. [DOI] [PubMed] [Google Scholar]
- [14].Slow EJ, van Raamsdonk J, Rogers D, Coleman SH, Graham RK, Deng Y, Oh R, Bissada N, Hossain SM, Yang YZ, Li XJ, Simpson EM, Gutekunst CA, Leavitt BR, Hayden MR. Selective striatal neuronal loss in a YAC128 mouse model of Huntington disease. Hum Mol Genet. 2003;12:1555–67. doi: 10.1093/hmg/ddg169. [DOI] [PubMed] [Google Scholar]
- [15].Tang TS, Slow E, Lupu V, Stavrovskaya IG, Sugimori M, Llinas R, Kristal BS, Hayden MR, Bezprozvanny I. Disturbed Ca2+ signaling and apoptosis of medium spiny neurons in Huntington’s disease. Proc Natl Acad Sci U S A. 2005;102:2602–7. doi: 10.1073/pnas.0409402102. [DOI] [PMC free article] [PubMed] [Google Scholar]
- [16].Hoenig JM, Heisey DM. The abuse of power: The pervasive fallacy of power calculations for data analysis. Am Stat. 2001;55:19–24. [Google Scholar]
- [17].Huang WY, Aramburu J, Douglas PS, Izumo S. Transgenic expression of green fluorescence protein can cause dilated cardiomyopathy. Nat Med. 2000;6:482–3. doi: 10.1038/74914. [DOI] [PubMed] [Google Scholar]
- [18].Stack EC, Kubilus JK, Smith K, Cormier K, Del Signore SJ, Guelin E, Ryu H, Hersch SM, Ferrante RJ. Chronology of behavioral symptoms and neuropathological sequela in R6/2 Huntington’s disease transgenic mice. J Comp Neurol. 2005;490:354–70. doi: 10.1002/cne.20680. [DOI] [PubMed] [Google Scholar]
- [19].Tabrizi SJ, Scahill RI, Owen G, Durr A, Leavitt BR, Roos RA, Borowsky B, Landwehrmeyer B, Frost C, Johnson H, Craufurd D, Reilmann R, Stout JC, Langbehn DR, Investigators T-H. Predictors of phenotypic progression and disease onset in premanifest and early-stage Huntington’s disease in the TRACK-HD study: Analysis of 36-month observational data. Lancet Neurol. 2013;12:637–49. doi: 10.1016/S1474-4422(13)70088-7. [DOI] [PubMed] [Google Scholar]


