Abstract
The Gene Ontology and annotations derived from the S. cerivisiae Genome Database were analyzed to calculate functional similarity of gene products. Three methods for measuring similarity (including a distance-based approach) were implemented. Significant, quantitative relationships between similarity and expression correlation of pairs of genes were detected. Using a known gene expression dataset in yeast, this study compared more than three million pairs of gene products on the basis of these functional properties. Highly correlated genes exhibit strong similarity based on information originating from the gene ontology taxonomies. Such a similarity is significantly stronger than that observed between weakly correlated genes. This study supports the feasibility of applying gene ontology-driven similarity methods to functional prediction tasks, such as the validation of gene expression analyses and the identification of false positives in protein interaction studies.
Keywords: Gene Ontology, functional similarity, gene expression correlation
I. Introduction
AN important goal in functional genomics is the automated incorporation of prior knowledge to support the generation and validation of hypotheses. Moreover, this process should facilitate integrative prediction strategies based on the analysis of diverse sources of genomic information, which provide incomplete and sometimes inconsistent views of a biological phenomenon. The Gene Ontology™ (GO) represents an important knowledge resource to describe the function of genes [1]. The GO was designed to offer controlled vocabularies and shared hierarchies for aiding in the annotation of molecular attributes across model organisms. Initially, it facilitated the development of several organism-specific databases and the implementation of cross-database queries [1]. More recently, it has been used as a gold standard for functional prediction applications. It has supported functional assessment of gene products, including gene expression cluster interpretation [2].
The GO has been proposed as a tool for measuring similarity between genes. This approach is referred to as semantic similarity, which may be based on statistical and topological information about GO terms and/or their interrelationships in the ontology. Previous research has shown significant relationships between semantic similarity of pairs of genes and their structural, sequence-based similarity [3]. Also initial studies have evaluated relevant associations between GO-driven similarity and other functional properties, such gene expression correlation and protein complex membership [4].
This study focuses on the incorporation of ontology-based similarity for functional classification problems. It aims to expand our understanding of the relationships between GO-driven gene similarity and expression correlation. Such an assessment may allow one to justify the design of annotation-based predictive models and their integration with expression data models. It may provide the basis for novel methods to assess the predictive quality and reliability of functional genomics analyses involving gene expression or other types of related data. Moreover, this research may be seen as an analysis of the reliability and consistency of the information represented in the GO and resulting databases.
The results are based on the GO annotations from the Saccharomyces Genome Database (SGD) [5]. Section 2 introduces the GO and relevant applications. GO-based similarity assessment methods are introduced in Section 3. Section 4 describes the datasets and methods. Section 5 summarizes results. Section 6 discusses the relevance of the results and ongoing research.
II. The Gene Ontology and its Applications in Functional Genomics
A. Introduction to the Gene Ontology
The GO defines a shared and structured vocabulary to annotate molecular attributes across models organisms [1]. It allows scientists to access annotation information resulting from different model organisms. The terms defined by the GO have been used to develop several genomic databases, such as the SGD [5] and FlyBase [6]. The GO and resulting databases also provide information about the quality of the associations between GO terms and gene products. This information is represented by evidence codes, which are assigned to each gene annotation using the GO. The GO supports different types of evidence codes. For instance, the evidence codes TAS (Traceable Author Statement) and IEA (Inferred from Electronic Annotation). The TAS code refers to annotations supported by articles or books. In contrast, IEA annotations are based on results automatically derived from sequence similarity searches, which have not been reviewed by curators. Detailed information on databases and evidence codes supported is available at www.geneontology.org.
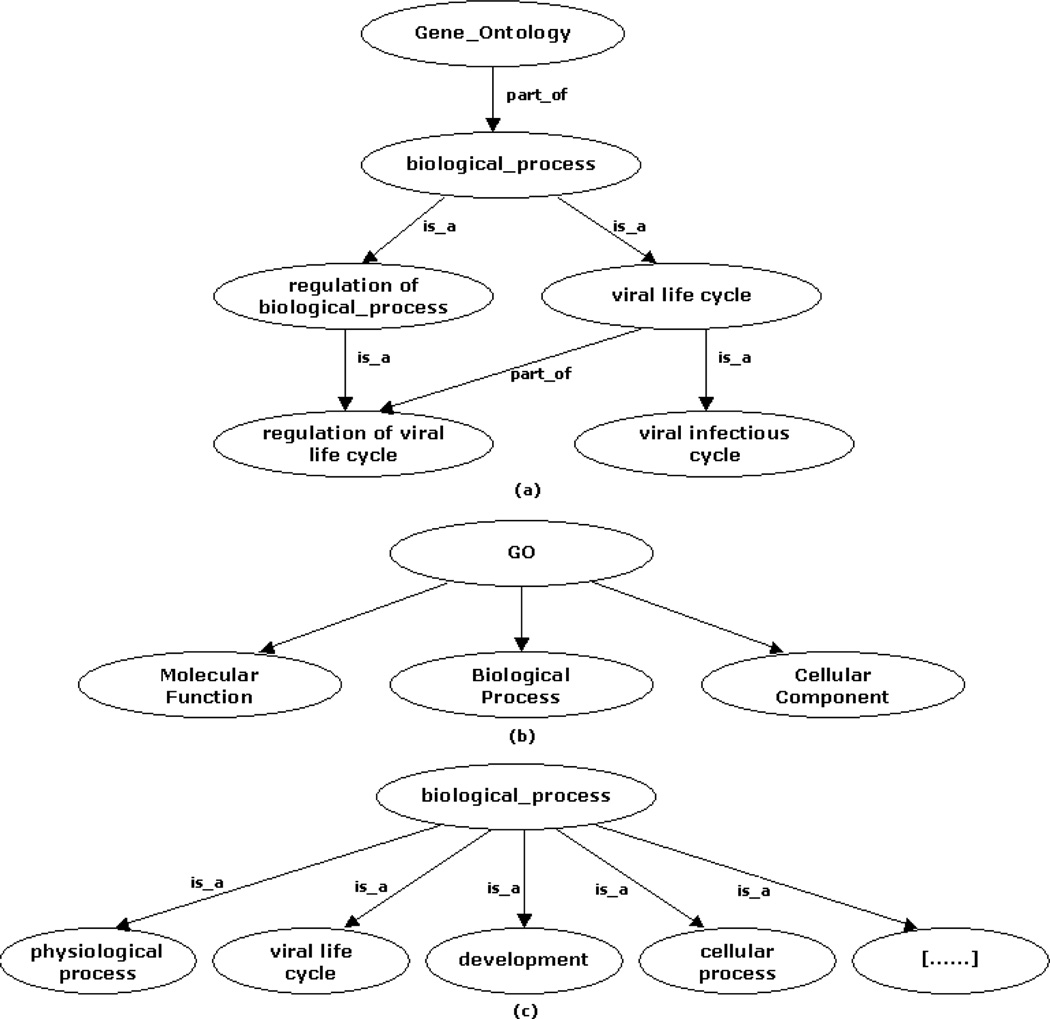
The GO comprises three ontologies, sometimes referred to as taxonomies or hierarchies: Molecular function (MF), biological process (BP), and cellular component (CC). MF represents information on the role played by a gene product. BP refers to a biological objective to which a gene product contributes. CC represents the cellular localization of the gene product, including cellular structures and complexes. Fig. 1 summarizes the organization of the GO and a partial view of the first level of terms included under BP. The design and implementation of the GO is reviewed in [1]. These vocabularies (one for each ontology) and their relationships are represented by directed acyclic graphs (DAGs). A hierarchy in the GO may be seen as a network in which each term may represent a “child node” of one or more “parent nodes”. There are two types of child-to-parent relationships in the GO: “is a” and “part of” types. The first type is defined when a child class is a subclass of a parent class. For example, from the BP ontology, “viral infectious cycle” is a child of “viral life cycle”. The second type is used when a parent has the child as its part. For instance, from the same ontology, “regulation of viral life cycle” is part of “viral life cycle”. Fig. 1.a illustrates these examples and a partial view of a DAG in the GO.
Fig. 1.
Different views of the GO. (a) Example of a DAG. (b) GO taxonomies. (c) Partial view of the first level of BP. […] indicates the presence of several terms not included here.
B. Gene Ontology Applications to Functional Genomics
Ontologies have been traditionally used to improve database search applications. However, the significance of the GO goes beyond information search applications. The GO may facilitate large-scale applications for functional genomics. GO annotations have been recently integrated with relevant genomic resources, including gene expression data. One such application is the FatiGO tool, which is a Web-based interface for analyzing groups of genes and their associations with GO terms [2]. FatiGO allows users to analyze differential distributions of GO terms for two sets of genes.
King et al. [7] have predicted gene-phenotype associations in yeast. Their model processed phenotypic annotations extracted from the MIPS (Munich Information Center for Protein Sequences) database and GO annotations. Decision trees were implemented to infer these associations. Hvidsten et al. [8] have combined gene expression data with annotations originating from the GO biological process taxonomy. They applied rough set theory to assign biological process terms to genes represented by expression patterns. King et al. [9] implemented decision trees and Bayesian networks to predict new GO terms-gene associations based on existing annotations from the SGD and FlyBase. Lægreid et al. [10] also applied supervised learning methods to predict GO biological process annotation terms. Although these methods consist of the analysis of GO annotations, they are not based on semantic similarity approaches. Moreover, they do not apply information content models, which may significantly represent relevant patterns associated with the structure and relationships in the GO. By ignoring the semantic similarity between closely related GO terms (e.g., between a parent and a child), these methods may fail to identify the similarity between genes annotated with these closely related yet distinct terms. One of the contributions of this paper is to exploit term-term similarity in GO hierarchies for computing gene-gene similarity.
III. Similarity Assessment with the Gene Ontology
Before explaining the calculation of ontology-based similarity between gene products, it is first necessary to understand how to measure similarity between annotation terms in the ontology.
Given a pair of terms, c1 and c2, a traditional method for measuring their similarity consists of calculating the distance –measured by the number of edges – between the nodes associated with these terms in the ontology. The shorter this distance, the higher the similarity. The shortest or the average distance may be used when there are multiple paths. This type of approaches is commonly known as edge counting methods. Variations may define weights for the links according to their position in the taxonomy [11]. One of the main limitations shown by these methods is that they assume that nodes and links are uniformly distributed in an ontology. This is not an accurate assumption in taxonomies exhibiting variable link densities. Information-theoretic models [12] offer alternative approaches to measuring similarity in an ontology. Previous research has shown that this type of approaches may be significantly less sensitive to link density variability [13], [14]. These methods traditionally consider only the “is a” links in a taxonomy. However, it has been shown that other types of links may also be processed to perform similarity assessment [13]. The majority of the GO links are “is a” links [3]. Such a bias towards link type usage also justifies the application of this type of similarity assessment approaches. This research implemented and evaluated information-theoretic techniques to measure similarity of GO terms. It considers the two types of GO links as equally important for estimating similarity.
Let C be the set of terms in the GO. An information-theoretic approach to measuring similarity between terms, c ∈ C, consists of determining the amount of information they share in common. In the GO this information may be represented by the set of parent nodes, which subsume the pairs of terms under analysis. For example, in Fig. 1.a the terms “regulation of viral life cycle” and “viral infectious cycle” are subsumed by the terms “viral life cycle” and “biological_process”. This indicates that the terms “regulation of viral life cycle” and “viral infectious cycle” shared those attributes (parents) in common. For each term, c ∈ C, p(c) is the probability of finding a child of c in the annotation database being analyzed, in this case the SGD. Thus, as one moves up to the root node of the GO (i.e. terms “molecular function”, “biological process” and “cellular component”), p(c) monotonically approaches a value equal to 1. The principle of information theory defines the information content of a term as equal to −log(p(c)).
This type of methods exploits the assumption that the more information two terms share in common, the more similar they are. Thus, the information shared by two terms may be calculated using the information content of the terms subsuming them in the ontology. One such technique is known as the Resnik’s model, and calculates similarity between terms ci and cj as [13], [14]:
| (1) |
where S(ci, cj) represents the set of parent terms shared by both ci and cj, and ‘max’ represents the maximum operator. The value of this metric can vary between 0 and infinity. In Fig. 1.a, for example, if “regulation of viral life cycle” and “viral infectious cycle” represent c1 and c2 respectively, S(c1, c2) will then include “viral life cycle” and “biological_process”. Nevertheless, “viral life cycle”, which provides the minimum p(c) and the maximum −log(p(c)), represents the most informative term. Thus, (1) provides the information content of the lowest common ancestor of two terms.
An alternative information-theoretic technique was proposed by Lin [15]. This technique also estimates similarity on the basis of the parent commonality of two query terms. However, it also incorporates the information content of the query terms. Thus, given terms, ci and cj, their similarity may be calculated as:
| (2) |
where p(ci) and p(cj) are defined as above. The values generated by (2) vary between 0 and 1. Lin’s values also increase in relation to the degree of similarity shown by two terms, and decreases with their difference. This technique may be seen as a normalized version of (1).
Similarity between terms may also be assessed using distance functions. In this case the resulting values will decrease with regard to their level of similarity. The more similar two terms are, the closer they would be in the distance space. One such method is the Jiang’s distance [16], which is defined as:
| (3) |
where the variables are defined as above. The values generated by (3) can vary between 0 and infinity and they reflect the semantic dissimilarity between a pairs of terms, ci and cj For additional information on these and related techniques the reader is referred to [14], [15].
Similarity and distance values for a pair of gene products described by GO terms may be calculated based on (1) to (3). Given a pair of gene products, gi and gj, which are annotated by a set of terms Ai and Aj respectively, where Ai and Aj comprise m and n terms respectively, the semantic similarity, SIM(gi, gj), may be defined as the average inter-set similarity between terms from Ai and Aj:
| (4) |
where sim(ck, cp) may calculated using either (1) or (2). Using (3) the semantic distance, D(gi, gj), may be defined as:
| (5) |
These methods aggregate similarity and distance information originating from all of the terms used to describe gi and gj
Cao et al. [17] applied (1) to implement a genomic data warehouse search system. Given a query gene and its GO terms, this system allows users to search for similar genes. Cao et al. do not actually implement (4). In their system a reference term associated with the query gene is specified to search for genes containing similar terms.
The relationship between semantic and sequence similarities has been investigated by Lord et al. [3]. They found significant correlations between (4), based on (1) and (2), and gene sequence similarity. Their results were based on the analysis of the Swiss-Prot-Human database and the application of the BLAST tool. More recently, Azuaje and Bodenreider [4] studied significant, quantitative associations between GO-driven similarity and gene expression correlation, and between similarity and protein complex membership. Based on a relatively small sample of genes involved in the yeast cell cycle, their study suggested that a high degree of semantic similarity may be associated with significant levels of expression correlation. They evaluated methods based on (1), (2) and (4). The study reported in this paper builds on the research initiated by [4]. GO-driven similarity of pairs of genes is analyzed using the techniques introduced above. Significant relationships between such properties and gene expression correlation are established for a larger dataset.
IV. Data and Methods
This investigation processed associations between GO terms and gene products included in the SGD. Results are based on the analysis of the February 2004 GO release. Experiments ignored IEA annotations due to their lack of reliability. Quantitative relationships between the semantic similarity of pairs of gene products and their expression correlation were studied. This research incorporates a known dataset taken from Eisen et al. study [18], which contains expression responses to several perturbations in S. cerevisiae. Our analyses included 2460 ORFs with available GO annotations. The importance of this dataset, which reflects fundamental cellular states of this organism, has been widely reported elsewhere. Each gene is described by 79 expression values, which are associated with 79 separate time courses during the following processes: the diauxic shift, the mitotic cell division cycle, sporulation, and temperature and reducing shocks. A detailed description of the dataset is given in [18]. More than 3 million gene pairs were derived from this dataset. For each pair of genes, the similarity and the distance in each ontology was compared to the absolute expression correlation value. Expression correlation was calculated using the well-known Pearson correlation coefficient. We split the gene pairs into five groups with respect to absolute correlation values and computed information content-based similarity and distance values in each group. Our hypothesis is that pairs of genes exhibiting similar expression levels (as measures by the absolute correlation values) also tend to have high similarity or short distance (as measured by the information content-based methods). Additionally, this study was done separately on the three hierarchies of the GO in order to evaluate whether this hypothesis holds for CC and BP annotations as well as for MF annotations.
V. Results
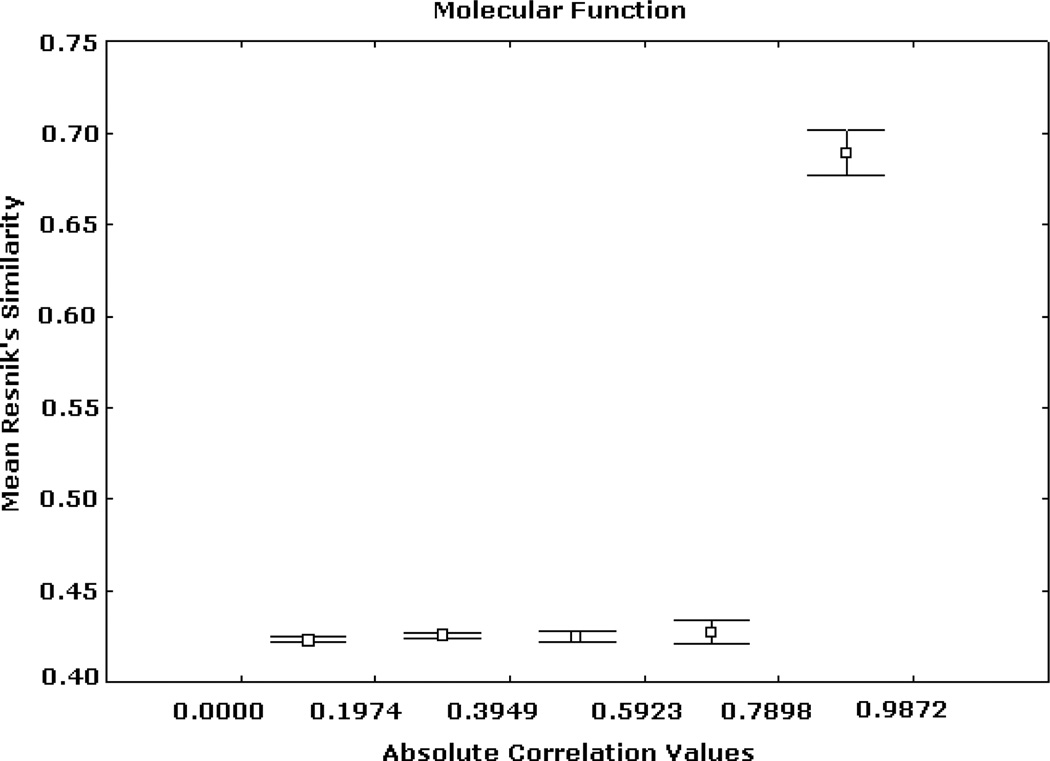
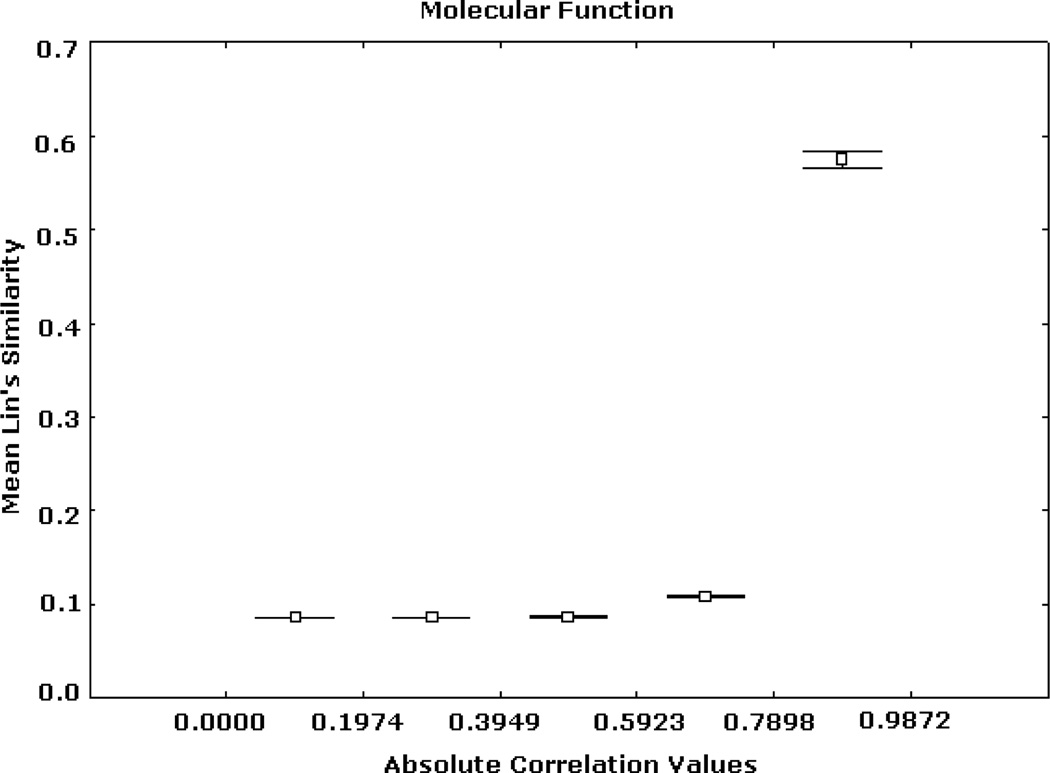
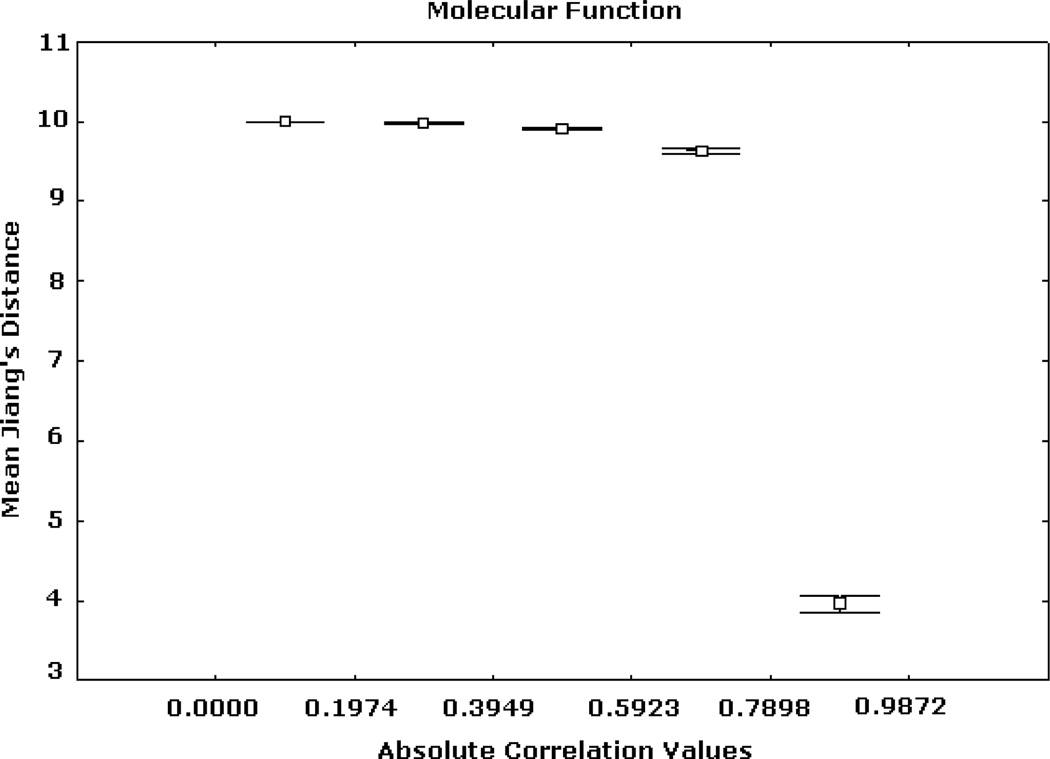
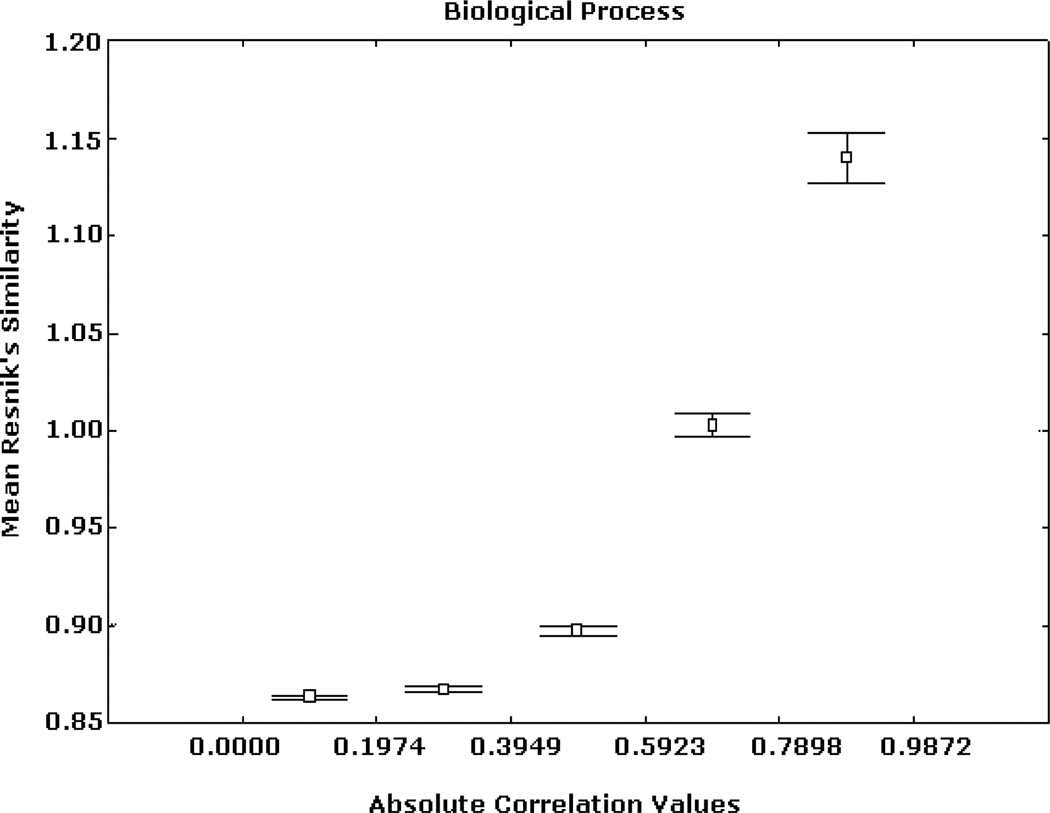
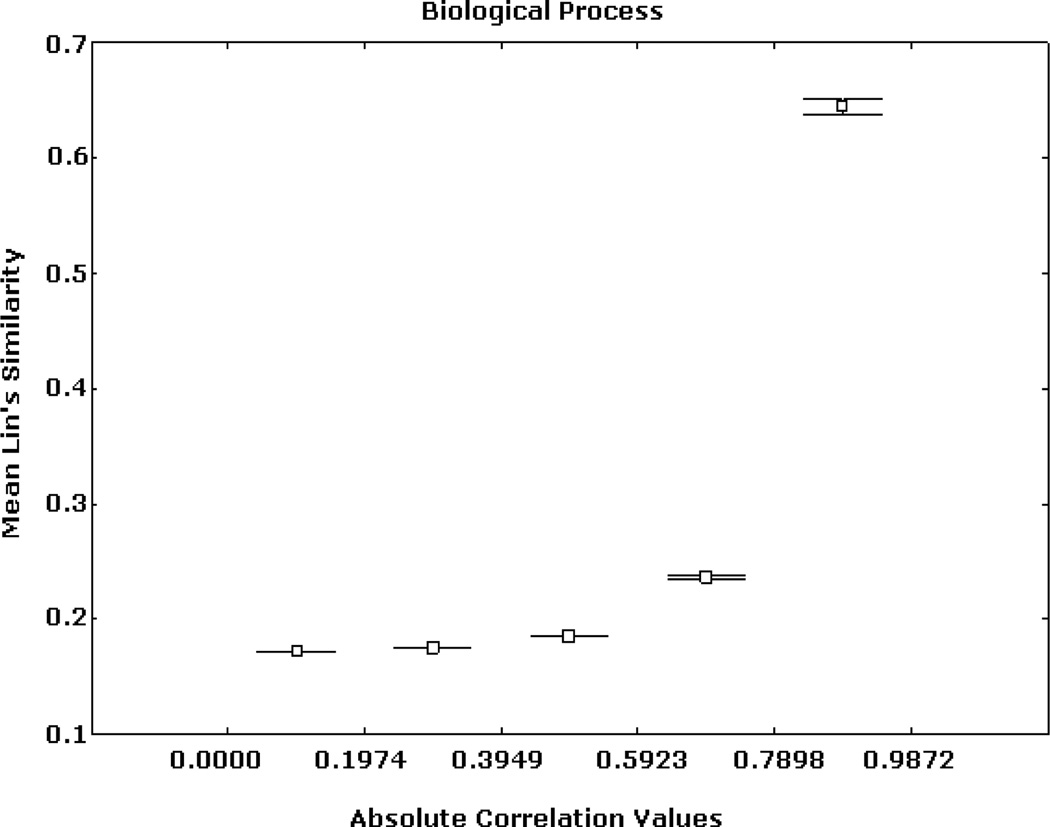
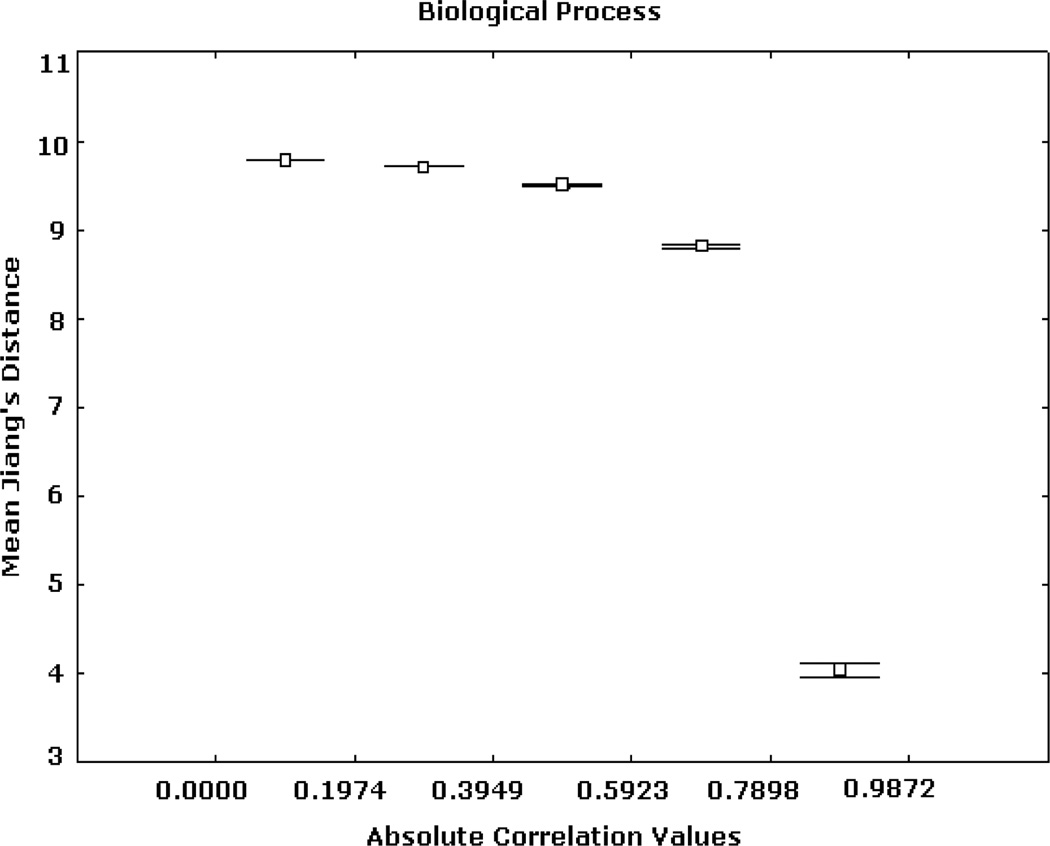
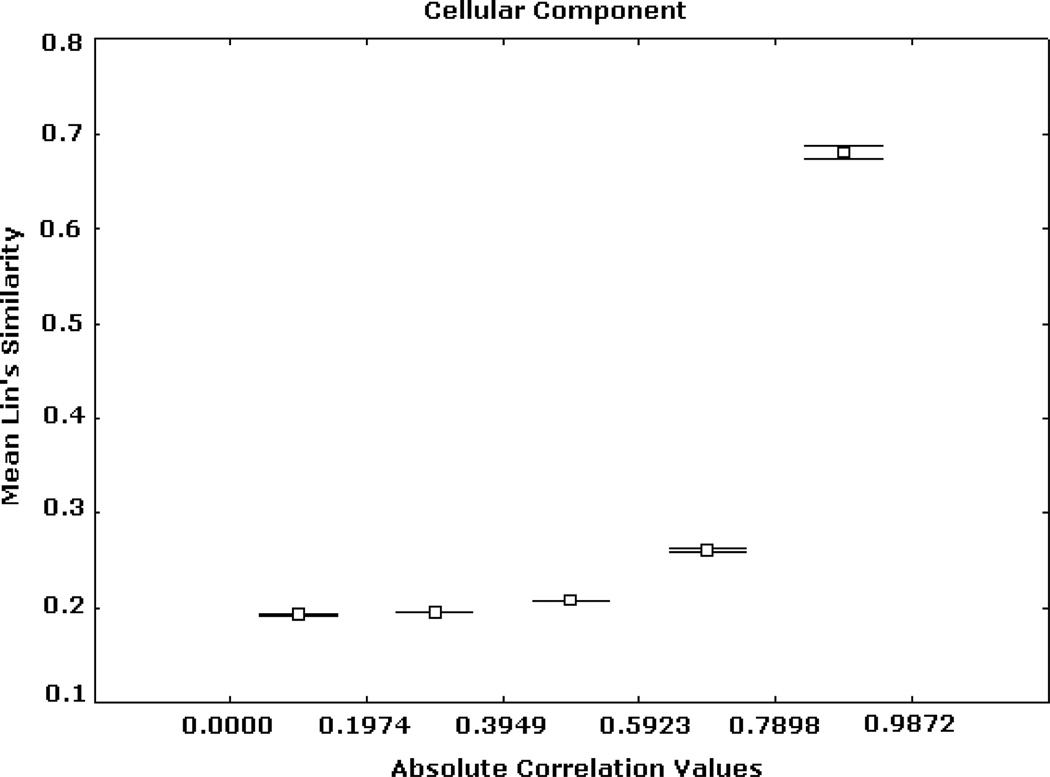
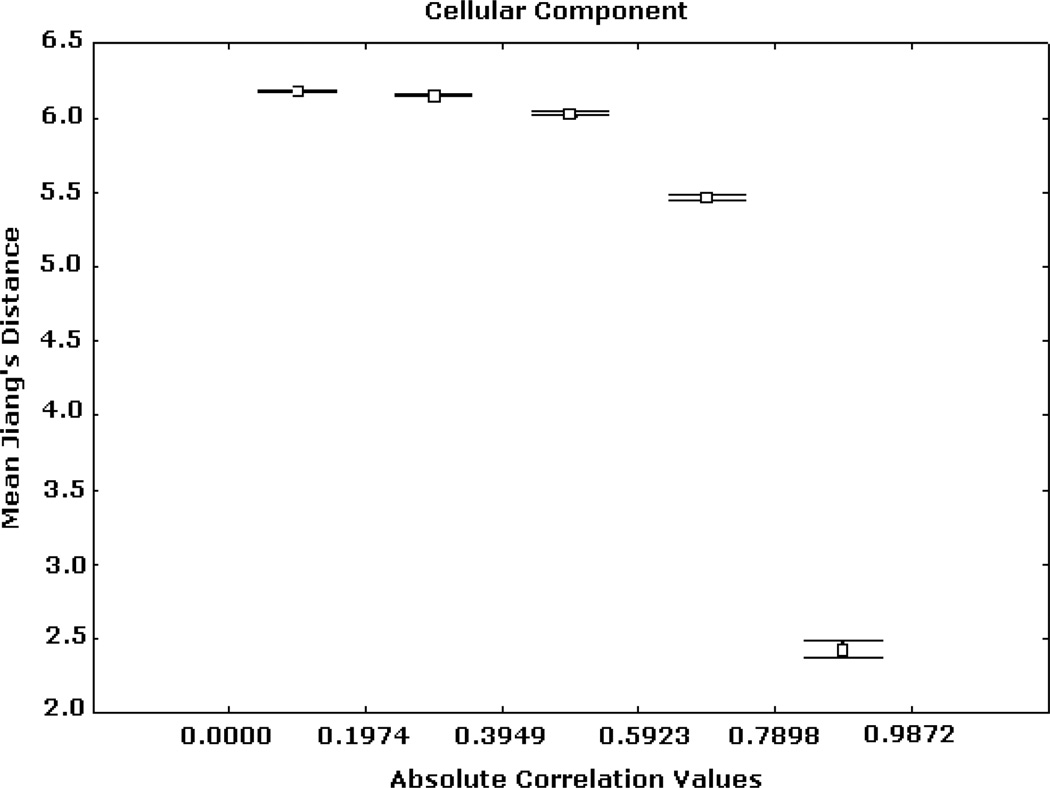
Figs. 2, 3, and 4 summarize Renisk’s similarity, Lin’s similarity and Jiang’s distance against absolute expression correlation values between pairs of gene products respectively. Similarity and distance information was derived from the MF hierarchy. For these and all of the subsequent figures the axis of abscissas is divided into a number of absolute correlation intervals, and the axis of ordinates shows the mean similarity (or distance) values detected in these intervals and their 95% confidence intervals. Similar trends, but with different levels of resolution, were obtained for other numbers of intervals. High similarity and short distance values are significantly associated with strong expression correlation values. Weak similarity and long distance are significantly related to low expression correlation values. This trend is significantly stronger in the case of the highest expression correlation values. For instance, among more than 3 million gene pairs, there are 1798 pairs from the BP hierarchy whose correlation values are greater than 0.9, in which more than 97.5% has Jiang’s distances smaller than 5.
Fig. 2.
Expression correlation and GO-based similarity based on (1) for MF ontology. The axis of ordinates shows the mean Resnik’s similarity values for each correlation interval and their 95% confidence intervals.
Fig. 3.
Expression correlation and GO-based similarity based on (2) for MF ontology. The axis of ordinates shows the mean Lin’s similarity values for each correlation interval and their 95% confidence intervals.
Fig. 4.
Expression correlation and GO-based distance based on (3) for MF ontology. The axis of ordinates shows the mean Jiang’s distance values for each correlation interval and their 95% confidence intervals.
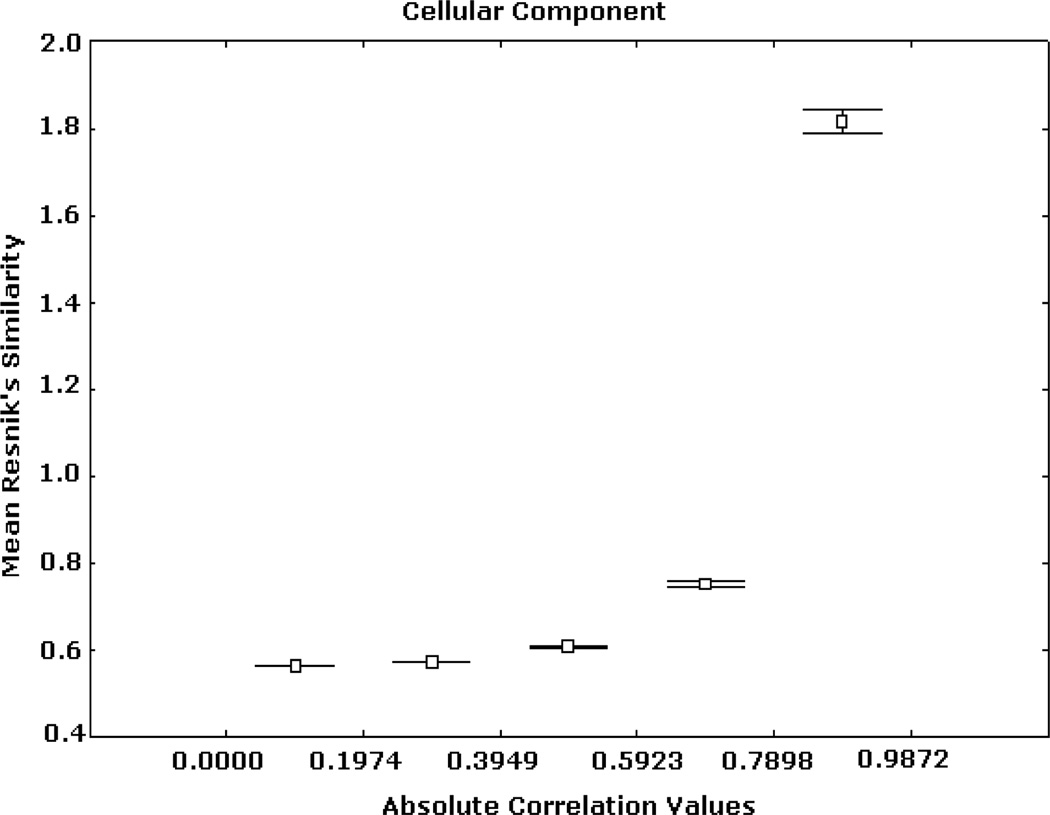
Similar patterns were obtained from the analyses based on the BP and CC ontologies. These results are illustrated in Figs. 5, 6, 7, 8, 9, and 10, depicting significant associations between similarity, distance and correlation. Similar results were obtained for different number of intervals.
Fig. 5.
Expression correlation and GO-based similarity based on (1) for BP ontology. The axis of ordinates shows the mean Resnik’s similarity values for each correlation interval and their 95% confidence intervals.
Fig. 6.
Expression correlation and GO-based similarity based on (2) for BP ontology. The axis of ordinates shows the mean Lin’s similarity values for each correlation interval and their 95% confidence intervals.
Fig. 7.
Expression correlation and GO-based distance based on (3) for BP ontology. The axis of ordinates shows the mean Jiang’s distance values for each correlation interval and their 95% confidence intervals.
Fig. 8.
Expression correlation and GO-based similarity based on (1) for CC ontology. The axis of ordinates shows the mean Resnik’s similarity values for each correlation interval and their 95% confidence intervals.
Fig. 9.
Expression correlation and GO-based similarity based on (2) for CC ontology. The axis of ordinates shows the mean Lin’s similarity values for each correlation interval and their 95% confidence intervals.
Fig. 10.
Expression correlation and GO-based distance based on (3) for CC ontology. The axis of ordinates shows the mean Jiang’s distance values for each correlation interval and their 95% confidence intervals.
VI. Conclusions
This study confirms that the GO-driven similarity and expression correlation of pairs of gene products are significantly interrelated. This property is consistently valid for similarity information originating from all of the GO hierarchies. Significant associations between a distance-based approach and expression correlation were also investigated in connection to all three ontologies. Such a distance model is also based on an information content approach.
This investigation expands and confirms the ideas reported in [4]. Our results indicate stronger connections between expression correlation and functional similarity knowledge extracted from the GO. We determined significant associations between high GO-driven similarity and high absolute expression correlation using a much larger sample of genes. Significant relationships between low correlation and similarity levels were also identified. Analyses on Jiang’s results suggest that such an approach may generate relevant indicators of dissimilarity, which are in general consistent with the outcomes derived from Resnik’s and Lin’s methods.
The results support the idea of applying GO-driven similarity assessment techniques for validating gene expression correlation. Similarity values may provide indicators to detect irrelevant expression correlations between pairs of genes. Moreover, these tools may be used to support expression cluster analysis and evaluation. The authors and collaborators are currently investigating the application of these methods for defining semantic cluster validity indices. Such indices together with data-driven cluster validity indices [19], [20], may be useful to aid in the prediction of the correct number of clusters. We are also designing hierarchical clustering strategies that combine expression correlation and semantic similarity information.
The authors will analyze other gene expression data sets in S. cerevisiae and C. elegans. Alternative ontology-driven similarity assessment methods will be implemented. Differences between the three GO hierarchies in terms of semantic similarity will be further assessed. One important next step is to implement methods to integrate similarity information from all of the GO hierarchies. One basic approach is to calculate the average of the similarity values obtained from each hierarchy. Initial results have been consistent with the relationships summarized in this paper.
Ontology-driven similarity assessment techniques may be useful to support annotation tasks. In one possible application, groups of gene products could be annotated using their lowest common ancestor rather than multiple annotations. These models may also be applied to analyze differences in annotations across genes across multiple organisms.
GO-driven similarity assessment methods may also be incorporated into models for predicting new annotations for partially characterized genes. Machine learning models have been previously reported to address this problem. However, they measure similarity between sets of annotations based solely on the presence or absence of GO terms [9]. Thus, the information-theoretic tools evaluated in this paper may be useful to support the development of more meaningful and reliable prediction models.
GO-driven similarity assessment techniques may become reliable tools for helping scientists to validate hypothesis in functional genomics. For example, they may significantly contribute to the detection of false-positives interactions. These tools may indicate when two potentially-interacting proteins are not functionally associated. Such a functional dissimilarity is an important sign of false-positive interactions [21].
This study contributes to the automated integration of prior, background knowledge into large-scale, integrative biological data mining.
Contributor Information
Haiying Wang, Email: hy.wang@ulster.ac.uk, School of Computing and Mathematics, University of Ulster, BT37 0QB, UK.
Francisco Azuaje, School of Computing and Mathematics, University of Ulster, BT37 0QB, UK.
Olivier Bodenreider, Email: olivier@nlm.nih.gov, U.S. National Library of Medicine, National Institutes of Health, Department of Health & Human Services, 8600 Rockville Pike, Bethesda, Maryland 20894, U.S.A.
Joaquín Dopazo, Email: jdopazo@cnio.es, Bioinformatics Unit, Spanish National Cancer Centre (CNIO), Melchor Fernandez Almagro 3, 28039, Madrid, Spain.
References
- 1.The Gene Ontology Consortium. Creating the gene ontology resource: Design and implementation. Genome Research. 2001;11:1425–1433. doi: 10.1101/gr.180801. [DOI] [PMC free article] [PubMed] [Google Scholar]
- 2.Al-Shahrour F, Diaz-Uriarte R, Dopazo J. Fatigo: a web tool for finding significant associations of Gene Ontology terms with groups of genes. Bioinformatics. 2004;20:578–580. doi: 10.1093/bioinformatics/btg455. [DOI] [PubMed] [Google Scholar]
- 3.Lord P, Stevens R, Brass A, Goble C. Investigating semantic similarity measures across the Gene Ontology: the relationship between sequence and annotation. Bioinformatics. 2003;19:1275–1283. doi: 10.1093/bioinformatics/btg153. [DOI] [PubMed] [Google Scholar]
- 4.Azuaje F, Bodenreider O. Incorporating ontology-driven similarity knowledge into functional genomics: an exploratory studies. Proc. of IEEE 4th Symposium on Bioinformatics and Bioengineering; BIBE 2004; 2004. pp. 317–324. [DOI] [PMC free article] [PubMed] [Google Scholar]
- 5.Dwight SS, Harris MA, Dolinski K, Ball CA, Binkley G, Christie KR, Fisk DG, Issel-Tarver L, Schroeder M, Sherlock G, Sethuraman A, Weng S, Botstein D, Cherry JM. Saccharomyces genome database (SGD) provides secondary gene annotation using the gene ontology (GO) Nucleic Acids Research. 2002;30(1):69–72. doi: 10.1093/nar/30.1.69. [DOI] [PMC free article] [PubMed] [Google Scholar]
- 6.The FlyBase Consortium. The FlyBase database of the Drosophila genome projects and community literature. Nucleic Acids Research. 2003;31:172–175. doi: 10.1093/nar/gkg094. [DOI] [PMC free article] [PubMed] [Google Scholar]
- 7.King OD, Lee JC, Dudley AM, Janse DM, Church GM, Roth FP. Predicting phenotype from patterns of annotation. Bioinformatics. 2003;19(Suppl. 1):183–189. doi: 10.1093/bioinformatics/btg1024. [DOI] [PubMed] [Google Scholar]
- 8.Hvidsten T, Lægreid A, Komorowski J. Learning rule-based models of biological process from gene expression time profiles using Gene Ontology. Bioinformatics. 2003;19:1116–1123. doi: 10.1093/bioinformatics/btg047. [DOI] [PubMed] [Google Scholar]
- 9.King OD, Foulger RE, Dwight SS, White JV, Roth FP. Predicting gene function from patterns of annotation. Genome Research. 2003;13:896–904. doi: 10.1101/gr.440803. [DOI] [PMC free article] [PubMed] [Google Scholar]
- 10.Lægreid A, Hvidsten TR, Midelfart H, Komorowski J, Sandvik AK. Predicting gene ontology biological process from temporal gene expression patterns. Genome Research. 2003;13:965–979. doi: 10.1101/gr.1144503. [DOI] [PMC free article] [PubMed] [Google Scholar]
- 11.Zhong J, Zhu H, Li Y, Yu Y. Conceptual graph matching for semantic search. In: Priss U, Corbett D, Angelova G, editors. Proc. of Conceptual Structures: Integration and Interfaces. London: Springer Verlag; 2002. pp. 92–106. (ICCS 2002) [Google Scholar]
- 12.Budanitsky A, Hirst G. Proc. of Workshop on WordNet and Other lexical Resources. Pittsburgh, PA: 2001. Semantic distance in WordNet: An experimental, application-oriented evaluation of five measures. [Google Scholar]
- 13.Resnik P. Using information content to evaluate semantic similarity in a taxonomy. Proc. of the 14th International Joint Conference on Artificial Intelligence, Montreal. 1995:448–453. [Google Scholar]
- 14.Resnik P, Diab M. Proc. of Twenty Second Annual Meeting of the Cognitive Science Society. Philadelphia: 2000. Aug, Measuring verb similarity. (COGSCI2000) [Google Scholar]
- 15.Lin D. Proc. of 15th International Conference on Machine Learning. San Francisco: 1998. An information-theoretic definition of similarity; pp. 296–304. [Google Scholar]
- 16.Jiang JJ, Conrath DW. Proc. of International Conference on research in Computational Linguistics. Taiwan: 1998. Semantic similarity based on corpus statistics and lexical taxonomy. [Google Scholar]
- 17.Cao S, Qin L, He W, Zhong Y, Zhu Y, LI1 Y. Semantic search among heterogeneous biological databases based on Gene Ontology. Acta Biochim et Biophysica Sinica 2004. 2004;36(5):365–370. doi: 10.1093/abbs/36.5.365. [DOI] [PubMed] [Google Scholar]
- 18.Eisen M, Spellman PL, Brown PO, Botsein D. Cluster analysis and display of genome-wide expression patterns. Proc. Natl. Acad. Sci. USA. 1998;95:14863–14868. doi: 10.1073/pnas.95.25.14863. [DOI] [PMC free article] [PubMed] [Google Scholar]
- 19.Bolshakova N, Azuaje F. Cluster validation techniques for genome expression data classification. Signal Processing. 2003;83(4):825–833. [Google Scholar]
- 20.Azuaje F. A cluster validity framework for genome expression data. Bioinformatics. 2002;8(2):319–320. doi: 10.1093/bioinformatics/18.2.319. [DOI] [PubMed] [Google Scholar]
- 21.Rives AW, Galitski T. Modular organization of cellular networks. Proc Natl Acad Sci U S A. 2003;100:1128–1133. doi: 10.1073/pnas.0237338100. [DOI] [PMC free article] [PubMed] [Google Scholar]


