Abstract
The pH of body fluids is one the most important key factors regulating various cell function such as enzyme activity and protein-protein interaction via modification of its binding affinity. Therefore, to keep cell function normal, the pH of body fluids is maintained constant by various systems. Insulin resistance is one of the most important, serious factors making the body condition worse in diabetes mellitus. I have recently found that the pH of body (interstitial) fluids is lower in diabetes mellitus than that in non-diabetic control, and that the lowered pH is one of the causes producing insulin resistance. In this review article, I introduce importance of body (interstitial) fluid pH in regulation of body function, evidence on abnormal regulation of body fluid pH in diabetes mellitus, and relationship between the body fluid pH and insulin resistance. Further, this review proposes perspective therapies on the basis of regulation of body fluid pH including propolis (honeybee product) diet.
Keywords: pH, Interstitial fluid, Insulin, Binding affinity to receptors, Propolis
Core tip: This review article provides new findings on changes of body (interstitial) fluid pH in type 2 diabetes mellitus, the role of body (interstitial) fluid pH in occurrence of insulin resistance, and future possibility of treatment for type 2 diabetes mellitus from a viewpoint of improvement of body (interstitial) fluid pH.
INTRODUCTION
Metabolic syndrome increases the risk developing type 2 diabetes mellitus, cardiovascular disease and cancer, etc., meaning that it would be a pre-stage for diseases. Therefore, to prevent progression of metabolic syndrome is one of the most effective strategies for prevention of occurrence of type 2 diabetes mellitus. Insulin resistance is one of the most important, serious factors developing symptoms of type 2 diabetes mellitus. Patients with insulin resistance show hypertension, one of typical clinical symptoms for diagnosis of cardiovascular disorders[1-4]. Further, patients with hyperinsulinemia, which is generally caused by insulin resistance, show hypertension mediated through various types of disorders such as renal failure, vascular dysfunction, and hyper-activation of sympathetic nerve[5-10]. These findings suggest that preventing develo-pment of insulin resistance would be one of the most important key subjects keeping the healthy body function.
Pathogenesis of insulin resistance means insufficiency of insulin action on glucose uptake in skeletal muscle[11], sustaining blood glucose at high levels after meals; this is known as one of typical symptoms of type 2 diabetes mellitus. The number of patients suffering from type 2 diabetes mellitus still continuously increases, and this becomes one of the most serious worldwide social problems[12]. Thus, clarification of mechanisms causing insulin resistance is one of the most important key subjects on prevention and treatment for diabetes mellitus. Unfortunately, the mechanisms of occurrence of insulin resistance have not yet been fully clarified.
As described above, one of the most major symptoms of type 2 diabetes mellitus is insulin resistance causing hyperglycemia, which leads to progression of pancreatic β-cell dysfunction due to hyper-secretion of insulin. Continuous hyperglycemia due to poor uptake of glucose into cells such as skeletal muscles, adipocytes, hepatocytes, etc., in general, irreversibly leads to macro- and micro-vascular complications, resulting in myocardial infarction, stroke, blindness, renal dysfunction, and peripheral neuropathy. International Diabetes Federation (IDF) reports that in 2012, 370 million people are recognized as diabetes mellitus in the worldwide, and the number of people with diabetes mellitus is considered to increase up to 550 million by 2030[12]. Various types of drugs have been developed for treatment of type 2 diabetes mellitus, however a tremendous number of people still suffer from type 2 diabetes mellitus. This means that although some newly developed drugs for treatment of type 2 diabetes mellitus are very efficient, the drugs are sill not effective to fully treat patients suffering from type 2 diabetes mellitus.
Interstitial fluids provide circumstances where extra-cellular signaling molecules such as hormones and neurotransmitters regulate cell function. This means that alteration of interstitial fluid composition affects efficiency of signal transduction of extracellular signaling molecules in intracellular signal transduction. Specially, it is notable that pH of interstitial fluids is very variable, since interstitial fluids contain little pH buffering molecules (Figures 1 and 2). On the other hand, blood has powerful pH buffering such as hemoglobin, albumin, etc., (Figures 1 and 2), keeping strictly pH of blood at a range between 7.35-7.45. These facts mean that even if pH of blood stays at normal levels, 7.35-7.45, pH of interstitial fluids would deviate from the normal range under metabolically pathophysiological conditions. As described above, hormones and neurotransmitters act on their receptors in the interstitial (extracellular) fluids (spaces) but not inside blood vessels (Figures 1 and 2). Further, it is notable that pH regulates activity of various types of enzymes and binding affinity of hormones and neurotransmitters to their receptors (Figure 1). This means that pH of interstitial fluids plays one of the most important key roles in regulation of cell function keeping homeostasis of the body function and condition, nevertheless unfortunately little information on pH of interstitial fluids is available.
Figure 1.
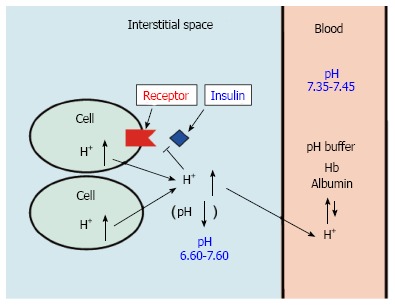
pH of interstitial fluid and blood, and binding affinity of insulin to its receptor. Interstitial fluids have little pH-buffering molecules, while blood has very strong, powerful pH buffering molecules such as hemoglobin and albumin. Thus, even under mild but not severe metabolic disorder conditions, blood pH is kept constant within a normal range (7.35-7.45), but interstitial fluid pH would be lower than a normal level.
Figure 2.
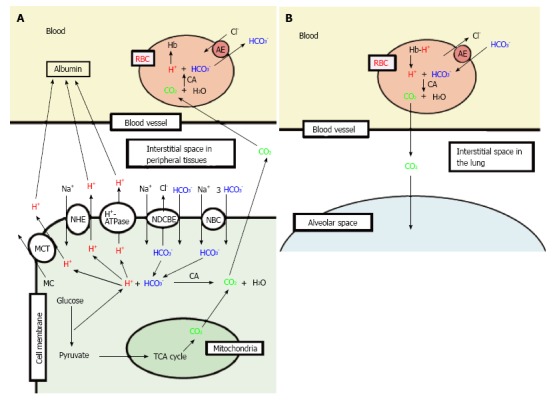
Production of H+, and H+ transporting systems in peripheral tissues (A) and the lung (B). A: In cells of peripheral tissues, H+ is produced from organic acids generated as metabolites via glycolysis such as lactic acid. H+ is directly extruded via Na+/H+ exchanger (NHE), H+-ATPase and H+-coupled monocarboxylate (MC) transporter (MCT) from intracellular to extracellular (interstitial) spaces, and moves into blood, and binds to albumin. Further, a part of H+ produced from metabolites is converted to CO2 and H2O consuming HCO3- via carbonic anhydrase (CA)-mediated facilitation process. To supply HCO3- consumed for conversion of H+ to CO2 and H2O in cells, Na+-driven Cl-/HCO3- exchanger (NDCBE) and Na+-HCO3- cotransporter (NBC) participate in uptake of HCO3- into intracellular from extracellular (interstitial) spaces. CO2 moves into red blood cell (RBC, erythrocyte) in blood via permeation across the plasma membrane of RBC due to high CO2 permeability of the plasma membrane, and is converted to H+ and HCO3- consuming H2O via CA-mediated facilitation process. H+ produced from CO2 and H2O via CA-mediated facilitation process in RBC binds to hemoglobin. HCO3- produced from CO2 and H2O via CA-mediated facilitation process in RBC is extruded from intracellular to extracellular (interstitial) spaces via exchange of Cl- existing in the extracellular space by anion exchanger (AE): this exchanging step of HCO3- extrusion and Cl- uptake is so called as Cl- shift; B: In the lung, the reversible process occurs due to low CO2 circumstances.
As mentioned above, activity of most enzymes and binding affinity of hormones and neurotransmitters to their receptors directly depend on pH of interstitial fluids. Therefore, keeping normal body/cell function requires maintenance of interstitial fluid pH within a normal range. Energy has to be also supplied to keep normal cell/body function. This process produces organic acids via glycolysis and CO2 via TCA cycle (Figure 2). Under physiological conditions, these acids including CO2 (H+ produced from CO2 and H2O) and organic acids are extruded via the lung and the kidney to keep pH of interstitial fluids within a normal range. However, under metabolically pathophysiological conditions such as diabetes mellitus, pH of interstitial fluids would become lower; i.e., interstitial fluids become acidic. For example, severe diabetes mellitus causes ketoacidosis detected as lowered pH (< 7.35) of “arterial” blood even containing strong pH buffers such as hemoglobin and albumin. This suggests that the interstitial fluid pH with little pH buffer in severe diabetes mellitus would be much lower than that in normal persons. The lowered pH of interstitial fluids under metabolically pathophysiological conditions leads patients to being further worse conditions of the disease[13,14]. Interestingly, even in pre-disease stages pH is drastically lowered in interstitial fluids around various tissues including the brain[15-17], developing diseases.
In this review article, I provide a new concept regarding insulin resistance and its improvement; particularly I discuss the role of interstitial fluid pH in cell function in diabetes mellitus.
INTERSTITIAL FLUIDS
Interstitial fluid pH kept within a normal range plays a role as one of the most important key factors in keeping normal cell/body functions and adaptation of body condition as mentioned above. However, unfortunately interstitial fluids have little pH buffers unlike blood. The reason why interstitial fluids have little pH buffers unlike blood containing hemoglobin and albumin, very strong pH buffers, is as follows. If interstitial fluids have pH-buffering proteins such as albumin, colloid osmotic pressure of interstitial fluids becomes larger than that without pH buffering proteins such as albumin. High colloid osmotic pressure of interstitial fluids leads to disturbance of transport and circulation of nutrition and metabolites between blood and interstitial fluids across walls of blood vessels. Namely, metabolites produced in peripheral tissues are collected into capillaries near veins by the larger colloid osmotic pressure in the capillary than that in the interstitial fluid. This driving force of metabolite collection into capillary becomes low if the colloid osmotic pressure becomes large. Therefore, the fact that interstitial fluids have little pH buffering proteins is a weak point for keeping activity of hormones and enzymes at normal levels, but is essentially required for collection of metabolites produced in peripheral tissues into capillaries. In general, the pH-buffering capacity in blood is large enough to keep the interstitial fluid pH constant under physiological conditions. Unfortunately, under metabolically pathophysiological conditions, the pH-buffering capacity in blood is not large enough to maintain activity of hormones and enzymes in interstitial fluids, resulting in disorders such as insulin resistance.
REGULATION AND ABNORMALITIES IN pH OF INTERSTITIAL FLUIDS
The pH of mammalian “arterial” blood is accurately maintained at 7.40 ± 0.05 under normal physiological conditions. Severe metabolic disorders cause deviation of “arterial” blood pH more than 0.05 unit from a normal range of 7.35-7.45; i.e., pH < 7.35 is defined as acidosis or pH > 7.45 is defined as alkalosis. Alkalosis, pH > 7.45, is caused by vomiting of gastric juices or diarrhea (metabolic alkalosis), or hyperventilation (respiratory alkalosis), etc. However, long-term alkalosis rarely occurs. On the other hand, acidosis (specially long-term acidosis) occurs in various metabolic disorders including diabetes mellitus. Acidosis and alkalosis are well recognized as severe disorders of body conditions, however little information is available on the interstitial fluid pH. Even under the condition with normal pH (7.35-7.45) of “arterial” blood, pH of interstitial fluids would deviate from the normal range. Our previous reports indicate that the pH of interstitial fluids is deviated form the normal range[15-17] even under conditions maintained at normal “arterial” blood pH. The pH of interstitial fluids is determined by the content of H+ (proton) provided from organic acids as metabolites produced at ATP synthesis in living cells.
One of typical H+ sources is lactate, CH3-CH(OH)-COOH [CH3-CH(OH)-COO- + H+], which is converted from pyruvate, CH3-CO-COOH (CH3-CO-COO- + H+), a product from glycolysis. In tissues requiring much energy (ATP) such as skeletal muscles, the anaerobically glycolytic metabolism mediates the conversion of glucose and glycogen into lactic acid via production of pyruvate. Under an aerobic condition, pyruvate is used for TCA cycle conducted in mitochondria. Therefore, under physiological conditions little amounts of lactate are generated, and most of the final product of glycolysis followed by TCA cycle is CO2, which is facilitated to be converted into H+ and HCO3- by carbonic anhydrase. Of course, CO2 is one of major sources for H+. However, to obtain a fixed amount of ATP, the amount of H+ generated by organic acids and CO2 produced in the process for generation of ATP mediated via both glycolysis and TCA cycle is much smaller than that produced only by glycolysis. Namely, under conditions with ATP synthesis predominantly mediated via glycolysis but not followed by function of TCA cycle, the total amount of produced H+ is much larger than that under conditions with ATP synthesis via glycolysis associated with functional TCA cycle. Patients with diabetes mellitus are suggested to have reduced mitochondria function[11,18-20]. Based on this suggestion[11,18-20], the total amount of H+ produced in patients with diabetes mellitus is much larger than that in healthy persons with normal mitochondrial function. Even in cases that blood pH in patients with diabetes mellitus except severe cases is within a normal range (7.35-7.45), pH of interstitial fluids would be less than 7.35.
Other sources of H+ are ketone bodies; i.e., metaboli-sm of fatty acids in liver generates beta-hydroxybutyrate, which provides H+ via dissociation into beta-hydroxy-butyrate anion and H+ (beta-hydroxybutyrate- + H+)[21]. Beta-hydroxybutyrate is the major ketone body (approx-imately 70% of total ketone bodies) produced by TCA cycle in liver mitochondria via oxidation of free fatty acids released from adipocytes[22]. Another major ketone body is acetoacetate, which is converted to beta-hydroxybutyrate. The synthesis of these ketone bodies in liver mitochondria is, in general, occurs in response to an unavailability of blood glucose, contributing to overall energy metabolism. The ketone bodies produced in liver mitochondria are transported via blood to extra-hepatic tissues such as skeletal muscles and heart muscles. Under conditions with an unavailability or low availability of blood glucose, the transported ketone bodies such as beta-hydroxybutyrate and acetoacetate to muscles are used as sources of acetyl CoA, which is utilized in TCA cycle in mitochondria of muscles for generation of ATP[23]. Further, fatty acids can be converted to acetyl CoA without formation of ketone bodies, meaning that fatty acids are sources of ATP in mitochondria. However, when amounts of fatty acids is very large, abundant ketone bodies are produced in liver mitochondria and the amount of ketone bodies are exceeds the metabolizing capacity in mitochondria of muscles[23]. In this case, the body produces a large amount of ketone bodies, leading to elevation of H+ concentration (lowered pH) as mentioned above. This means that when low utilization of glucose or low mitochondria function occurs, high levels of ketone bodies appear in periphery tissues, providing a large amount of H+ (low pH).
METABOLITES INFLUENCING pH OF INTERSTITIAL FLUIDS AND pH-BUFFERING SYSTEMS
Lactate is dissociated into CH3-CH(OH)-COO- + H+ under physiological conditions of pH (approximately 7.40) much higher than pKa of lactate (3.86), leading to production of H+. In addition to lactate, as mentioned above H+ is also provided from materials such as ketone bodies; for example, metabolism of fatty acids in liver generates beta-hydroxybutyrate, one of typical ketone bodies, provides H+ via dissociation into beta-hydroxybutyrate anion and H+ (beta-hydroxybutyrate- + H+). The H+ produced in cells via metabolism is extruded as a form of H+ itself or CO2 via various types of H+ transporter such as Na+/H+ exchanger (NHE), H+-ATPase, H+-coupled monocarboxylate transporter (MCT), Na+-driven Cl-/HCO3- exchanger (NDCBE), and Na+-HCO3- cotransporter (NBC), etc., (Figure 2A)[24-29]. Namely, extrusion of H+ as a form of H+ itself is mediated by NHE, H+-ATPase and/or MCT, etc., that directly transport H+ to the extracellular (interstitial) space. On the other hand, NDCBE or NBC doesn’t directly transport H+, but uptake HCO3- into the intracellular space, resulting in production of CO2 + H2O from H+ and HCO3- via carbonic anhydrase (CA). CO2 produced by H+ and HCO3- via a CA-facilitated process easily moves to the extracellular space by permeating the plasma membrane, since the plasma membrane of cells has high permeability to CO2 (Figure 2A). Thus, H+ produced in the intracellular space is extruded to the extracellular (interstitial) space as a form of CO2 via consumption of HCO3- transported from the extracellular (interstitial) space. Because, HCO3- originally generated from CO2 produced via TCA cycle in cells associated with H+ could not be a net source for conversion to CO2 due to its origin, CO2. Thus, H+ produced from lactate, etc., in the intracellular space is extruded to the extracellular (interstitial) space via directly NHE/H+-ATPase/MCT, and indirectly NDCBE/NBC. Anyway, H+ produced from metabolites such as lactate, etc., consumes HCO3-, reducing the intracellular concentration of HCO3- associated with a compensatory increase in HCO3- uptake via NDCBE and NBC. The source of HCO3- under anaerobic conditions associated with dysfunction of mitochondria in cells such as muscles is HCO3- in blood, which is produced from CO2 + H2O via facilitated conversion by carbonic anhydrase in other tissues. H+ is finally extruded from the body via the kidney into urine. Therefore, severe overproduction of H+ spends HCO3-, being converted into CO2 an H2O (Figure 2). This CO2 produced from H+ and HCO3- moves into red blood cells (RBC, erythrocytes), and is again converted into H+ and HCO3- via a CA-facilitated process (Figure 2A). In red blood cells, H+ binds to hemoglobin, and HCO3- is extruded to the extracellular space in blood via anion exchanger (AE) (Figure 2A). Namely, even though HCO3- is consumed in cells, HCO3- is again produced in red blood cells, suggesting that HCO3- is not consumed in peripheral tissues. However, HCO3- is transported into red blood cells via AE in blood at the lung due to low CO2 pressure compared with peripheral tissues, and HCO3- is converted to CO2 with H+ released from hemoglobin (Figure 2B). CO2 produced in this process is extruded to atmosphere (Figure 2B). Thus, via this overall process the concentration of HCO3- in blood is reduced under these metabolically pathophysiological conditions. Severe overproduction of H+ causes metabolic acidosis consuming HCO3-, pH of “arterial” blood being less than 7.35. This acidosis has been previously recognized to occur as results from general metabolic disorders, however diabetes mellitus is recently indicated to be associated with mitochondrial dysfunction[11,18-20]. This mitochondrial dysfunction is one of main causes leading to acidosis. Further, as mentioned above, lowered pH is also caused by H+ dissociated from ketone bodies generated in liver provide, which are mainly produced via oxidation of free fatty acids released from adipocytes[22]; representative ketone bodies are beta-hydroxybutyrate, and acetoacetate. As described above, the synthesis of these ketone bodies in the liver mitochondria are generally produced in response to an unavailability of blood glucose in muscles. Therefore, these ketone bodies are utilized as sources of acetyl CoA for generation of ATP via TCA cycle in mitochondria of muscles[23]. Under conditions with mitochondrial dysfunction in muscles, these ketone bodies generated in the liver are not utilized as sources of acetyl CoA for generation of ATP via TCA cycle in mitochondria of muscles[23]. Thus, under these conditions, the ketone bodies provide a lot of H+, leading to much lower pH (acidosis) than that under conditions with normal mitochondrial function.
Lactate in intracellular spaces is a useful energy source via oxidation as a respiratory fuel[30,31]. Thus, the cytosolic lactate produced in fast muscles contracting relatively fast at heavy exercise under physiological conditions is extruded to the extracellular (interstitial) space via MCTs[32,33], being delivered to oxidative tissues via extracellular lactate shuttle through the blood[34]. Specially, in diabetes mellitus patients, lactate is generated due to mitochondrial dysfunction even in cases of regular exercise without heavy contraction of fast muscles[20,35]. In most mammalian cells, MCTs participate in the transport of lactate and other monocarboxylic acids such pyruvate, beta-hydroxybutyrate and acetoacetate across the cellular membrane[36-38]. It has been indicated that patients suffering from diabetes mellitus show alteration of MCTs expression[39,40]. Since MCTs carry monocarboxylate with H+, MCTs function as H+ extrusion coupled with monocarboxylate extrusion (Figure 2A), meaning that MCTs plays important, essential roles in pH and energy balance in patients suffering from diabetes mellitus.
ABNORMAL INTERSTITIAL FLUID pH AND PROGRESSION OF DIABETES MELLITUSS
As well known, insulin decreases blood glucose levels by stimulating glucose uptake into skeletal muscle cells via glucose transporter 4 (GLUT4), maintaining whole-body glucose homeostasis[41]. GLUT4 translocation to the plasma membrane from intracellular store sites is the main mechanism of insulin showing its stimulatory action on glucose uptake into skeletal muscle cells and adipocytes. Insulin regulates a dynamic process of GLUT4 trafficking between the plasma membrane and its intracellular store sites[42]. Insulin binds to its receptor located on the plasma membrane, immediately auto-phosphorylating tyrosine residues of the receptor. This auto-phosphorylation of insulin receptor subsequently induces phosphorylation of tyrosine residues of insulin receptor substrate-1 (IRS-1) phosphorylating (activating) PI3K, which catalyzes 3’ phosphorylation of phosphatidylinositol 4,5-diphosphate, leading to activation of Akt. This PI3K/Akt-mediated signaling pathway in the insulin-induced down-stream pathway stimulates the intracellular translocation of GLUT4 to the plasma membrane, elevating glucose uptake in skeletal muscles. Dysfunction of this insulin signal transduction leads to reduced levels of insulin-stimulated glucose uptake into skeletal muscles in type 2 diabetic patients, and this dysfunction is so-called insulin resistance[43]. Our recent study has shown that pH of interstitial fluids is lower in Otsuka Long-Evans Tokushima Fatty (OLETF) rats, a model in type 2 diabetes mellitus, than normal one[15]. Many epidemiological studies have recently reported the relationship between metabolic acidosis and insulin resistance[44]. Organic acids-induced acidosis would contribute to early stages in the development of insulin resistance[15,44-46]. The relationship between production of organic acids and development of insulin sensitivity is an important subject in patients suffering from type 2 diabetes mellitus[47-49]. Insulin sensitivity and urine pH have negative correlation with body weight and waist size[34]. Persons with metabolic syndrome are reported to have a significantly lower value of 24-h urine pH than that in normal persons without metabolic syndrome[48]. Persons with higher amounts of anion gap in metabolic acidosis associated with lower serum HCO3- show lower insulin sensitivity[50]. Our recently studies[15,17] indicate that the interstitial fluid pH in ascites, brain hippocampus and metabolic tissues in Otsuka Long-Evans Tokushima Fatty (OLETF) rats in early developing stages of diabetic mellitus is lower than the normal pH (7.40). Although our studies have not yet clarified the molecular mechanism causing lowered pH of interstitial fluids, these phenomena would be due to dysfunction or hypo-function of mitochondria in diabetes mellitus[11,19,20]. As mentioned above, the pH-buffering capacity in the interstitial fluid is much lower than that in the cytosol and in the blood, meaning that pH of interstitial fluids in metabolic tissues has valuable values depending on metabolic conditions. Therefore, we have studied if the lowered extracellular (interstitial fluid) pH reduces insulin action on its signaling pathways in rat skeletal model cells[46,51]. As mentioned above, insulin shows its stimulatory action on glucose uptake in skeletal muscle in a phosphatidylinositol 3-kinase (PI3K)-mediated pathway after binding to its receptor located on the plasma membrane via phosphorylation of its receptor. Therefore, we first studied if the insulin binding to its receptor is affected by lowering extracellular (interstitial fluid) pH. We have found that lowered extracellular (interstitial) fluid pH diminishes binding affinity of insulin to its receptor (Figure 3) associated with diminution of insulin receptor phosphorylation (activation) (Figure 4) without any change in expression of insulin receptor on the plasma membrane of skeletal muscle (Figure 5)[46]. Further, levels of phosphorylated (activated) Akt, a down-stream molecule of insulin signaling pathway, are decreased under conditions with lowered extracellular (interstitial fluid) pH (Figure 6)[46]. Glucose uptake is also diminished under the condition[46]. These observations indicate the importance of interstitial fluid pH in occurrence of insulin resistance.
Figure 3.
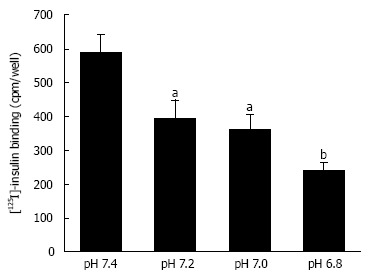
Insulin binding to insulin receptor under various pH conditions. After serum starved for 4 h, L6 myotubes were treated with 100 nmol/L insulin for 15 min in the HEPES buffer with different values of pH. Proteins expressed on the plasma membrane were biotinylated and precipitated. Differentiated L6 myotubes were treated with [125I]-labeled insulin for 15 min in the indicated pH buffers, and the radioactivities were measured after cells were washed and suspended. The values of radioactivity from at least 6 experiments are shown. The values are shown as the mean ± SEM. aP < 0.05, bP < 0.01 vs pH 7.4. Modified from ref.[46] with allowance of non-profit use of figures.
Figure 4.
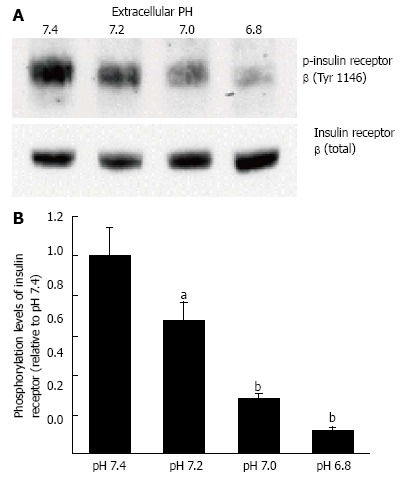
Phosphorylation levels of insulin receptor. After serum starvation for 4 h, L6 myotubes were treated with 100 nmol/L insulin for 15 min in the buffer with different pH. Total cell lysates were isolated and analyzed by Western blotting with indicated antibodies. A: Representative blots are shown; B: The quantative values of expression of insulin receptor using densitometry from 6 independent experiments using anti-phosphorylated-insulin receptor-β (Tyr 1146) antibody normalized to the level of total insulin receptor compared with that in pH 7.4 buffer. The values are shown as the mean ± SEM (n = 6). aP < 0.05, bP < 0.01 vs pH 7.4. Modified from ref.[46] with allowance of non-profit use of figures.
Figure 5.
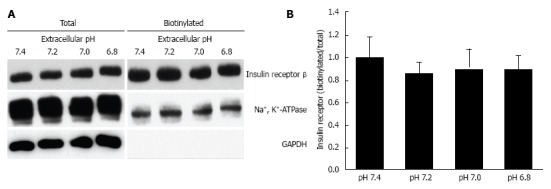
Effects of extracellular pH on the expression of insulin receptor on the plasma membrane. After serum starved for 4 h, L6 myotubes were treated with 100 nmol/L insulin for 15 min in the HEPES buffer with different pH. Proteins expressed on the plasma membrane were biotinylated and precipitated. A: Representative blots of total expression of insulin receptor on the plasma membrane, the Na+, K+-ATPase, and GAPDH; B: Quantative data of expression of insulin receptor on the plasma membrane at different pH normalized to that at pH 7.4. The results are presented as the mean ± SEM (n = 8). pH had no significant effects on the expression of insulin receptor on the plasma membrane. Modified from ref.[46] with allowance of non-profit use of figures.
Figure 6.
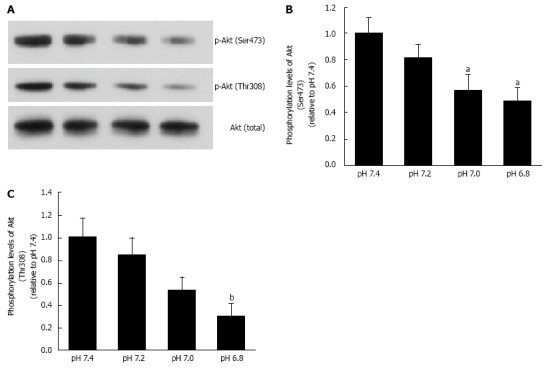
Phosphorylation levels of Akt. L6 myotubes were treated with 100 nmol/L insulin for 15 min in the buffer with different pH after serum starvation for 4 h. Total cell lysates were isolated, and were analyzed by Western blot with the indicated antibodies. A: Representative blots are shown using anti-phosphorylated (Ser473)-Akt, anti-phosphorylated (Thr308)-Akt, and anti-Akt antibodies. Phosphorylation levels of Ser473 (B) and Thr308 (C) are expressed as normalized values to the level of total Akt compared with those in pH 7.4. The values are shown as the mean ± SEM (n = 6). aP < 0.05, bP < 0.01 vs pH 7.4. Modified from ref.[46] with allowance of non-profit use of figures.
Our report also indicates an interesting observation regarding effects of propolis on various factors in type 2 diabetes mellitus model rats[15,16]. Propolis, a natural compound derived from plant resins collected by honeybees, contains various factors such as amino acids, steroids, phenolic aldehydes, polyphenols, sequiterpene quinines, and coumarins, etc.[52]. Propolis has been shown to possess anti-oxidant, anti-inflammation, and anti-tumor activities[53-56]. In addition to these actions, we have found that propolis improves insulin sensitivity[15,16]. Propolis improves (elevates) pH of interstitial fluids that is lower in type 2 diabetes mellitus than normal one[15,16]. Lowered pH of interstitial fluids diminishes binding affinity of insulin to its receptor (Figure 3), causing insulin resistance[46]. Although we have no information on molecular mechanisms how propolis improves lowered pH of interstitial fluids in type 2 diabetes mellitus at the present stage, these observations indicate us a very interesting point that propolis improves insulin sensitivity by elevating pH of interstitial fluids via recovery from diminished insulin binding affinity to insulin receptor in type 2 diabetes mellitus.
FLUIDS SECRETED INTO GASTROINTESTINAL LUMINAL SPACE AND FROM SEWEAT GLAND IN DIABETES MELLITUS
As mentioned above, the interstitial fluid has lower pH in type 2 diabetes mellitus than non-diabetic control. In addition to the interstitial fluid, I discuss about pH of fluids secreted from glands and gastrointestinal fluids. Before discussing about pH of those fluids, I should mention that these fluids are not secreted for maintenance of intracellular ionic conditions unlike the interstitial fluids. As mentioned above, pH of the interstitial fluids is lowered as a result from high production of H+ due to mitochondrial dysfunction and/or disability of glucose in muscles, neurons and, etc. On the other hands, pH of fluids secreted from glands and gastrointestinal fluids is, in general, not directly influenced by high production of H+ due to mitochondrial dysfunction and/or disability of glucose in muscles, neurons and etc. When mitochondrial dysfunction and/or disability of glucose occur in gland or gastrointestinal cells, H+ produced in these cells is, in general, extruded to the extracellular space across the basolateral membrane (so called interstitial fluid) but not to the luminal space across the apical membrane by H+ transporter such as NHE, H+-ATPase and etc. However, a study[57] indicates that the amounts of acid secreted from gastric gland under the basal condition and in response to cholecystokinin are larger in diabetes than that in non-diabetic control. This suggests that the intra-gastric pH in diabetes is lower than that in control. On the other hand, HCO3- secretion from pancreas in response to secretin shows no difference between diabetes and non-diabetic control[57]. Further, observations on sweating in diabetes are reported[58,59]. Most studies on sweating in diabetes are focused on blood flow around sweat glands and blood-flow-dependent amounts of sweat secretion without studies on ionic composition[58,59], although a study indicates that Cl- concentration is not changed in diabetes[60].
ALZHEIMER’S DISEASE IN DIABETES MELLITUS AND pH OF INTERSTITIAL FLUID
Patients with type 2 diabetes mellitus have been suggested to have a high risk of developing dementia and Alzheimer’s disease with defective memory functions[61]. Insulin is suggested to be necessary for neuronal survival within the central nervous system[62,63]. Fluctuating levels of blood glucose resulting from dysfunction of insulin (insulin resistance) leads neurons including central nervous system to apoptosis, formation of neuritic plaques, neurofibrillary tangles, energy starvation, and altered acetylcholine levels in the hippocampus, which are observed in Alzheimer’s disease[64,65]. Hippocampus is an important region parti-cipating in memory function[66]. We have found that pH of interstitial fluid around hippocampus is lower in type 2 diabetes mellitus model OLETF rats than that in normal ones (Figure 7), suggesting diminution of neuronal activity around hippocampus (Figure 8)[17,67].
Figure 7.
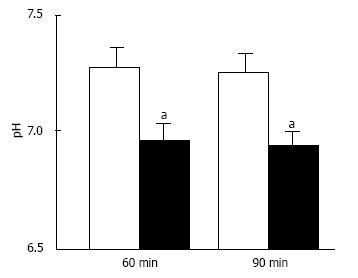
pH of interstitial (extracellular) fluid around the hippocampus of Otsuka Long-Evans Tokushima Fatty and normal (Wistar) rats. The pH value is shown as the mean ± SEM (n = 4). The pH values shown in Figure 7 were measured at 60 and 90 min after antimony pH electrodes reached interstitial (extracellular) fluids around the hippocampus of the Otsuka Long-Evans Tokushima Fatty rats (closed columns) and normal (Wistar) rats (open columns). aP < 0.05 compared with that in normal (Wistar) rats at each measured time. Modified from ref.[17] with allowance of free use of figures.
Figure 8.
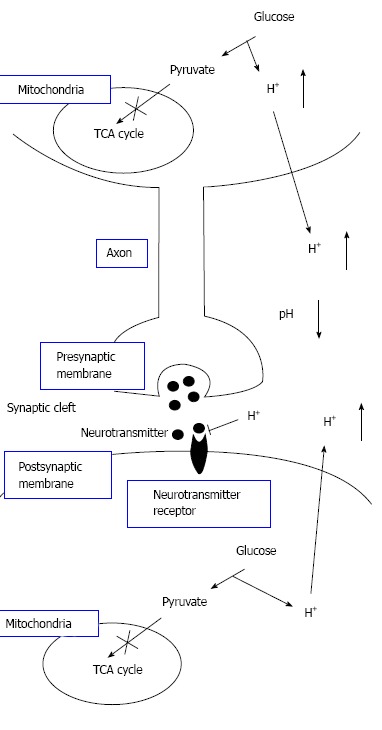
The pH-dependent mechanism of neural cell function in diabetes mellitus with dysfunction of mitochondria. Neural cells with dysfunction of mitochondria synthesize ATP required for maintenance of neural cell function only or mainly via glycolysis. Thus, neural cells with dysfunction of mitochondria produces much larger amounts of H+ than neural cells with normal function of mitochondria. H+ produced by glycolysis in neural cells with dysfunction of mitochondria[11,18-20] is released to the extracellular space, lowering pH of interstitial fluids[15-17] including the fluids in synaptic clefts. Lowered pH of synaptic cleft fluid diminishes the binding affinity of neurotransmitters to their receptors[67]. Thus, activity of neural cells is diminished at lowered pH of synaptic cleft fluid. Namely, the amount of neurotransmitters released into the synaptic cleft is large enough for generation of action potential under conditions with normal function of mitochondria. However, the amount of neurotransmitters released into the synaptic cleft is insufficient for generation of action potential under conditions with dysfunction of mitochondria, since lowered pH of synaptic cleft diminishes the binding affinity of neurotransmitters to receptors. Modified from ref.[17] with allowance of free use of figures.
Therefore, we suggest that maintenance of the inter-stitial fluid pH at the normal level or the recovery of the “interstitial” pH to normal from lowered levels would be a key factor in developing molecular and cellular therapies for metabolic brain disorders including Alzheimer’s disease.
CONCLUSION
Interstitial fluids have little pH buffering capacity. Therefore, over production of acid metabolites lower pH of interstitial fluids even when the intracellular and “arterial” blood pH remains normal (Figures 1 and 2). The lowered pH of interstitial fluids causes insulin resistance via reduced binding affinity of insulin to its receptor (Figures 1 and 3). Acidic environments due to dysfunction of mitochondria occurring in type 2 diabetes mellitus lead to insulin resistance. Further, the acidic environment occurring in the brain would be related to diminution of neuronal function and onset of Alzheimer’s disease (Figure 8).
Footnotes
P- Reviewer: Efanov AM, Ji G, Lin GM, Qu S S- Editor: Ji FF L- Editor: A E- Editor: Lu YJ
Supported by Grants-in-Aid from Japan Society of the Promotion of Science, No. 25670111; by Adaptable and Seamless Technology Transfer Program through Target-Driven RD Japan Science and Technology Agency (JST), No. 2012-2013; by KIT-KPUM-KPU-KPhU Collaborative Research Program, No. 2013-2014; and by Salt Science Foundation (1235) and Cell Research Conference.
Conflict-of-interest: There is no disclosure on financial interests.
Open-Access: This article is an open-access article which was selected by an in-house editor and fully peer-reviewed by external reviewers. It is distributed in accordance with the Creative Commons Attribution Non Commercial (CC BY-NC 4.0) license, which permits others to distribute, remix, adapt, build upon this work non-commercially, and license their derivative works on different terms, provided the original work is properly cited and the use is non-commercial. See: http://creativecommons.org/licenses/by-nc/4.0/
Peer-review started: August 28, 2014
First decision: November 3, 2014
Article in press: December 1, 2014
References
- 1.Cederholm J, Wibell L. Glucose intolerance in middle-aged subjects--a cause of hypertension? Acta Med Scand. 1985;217:363–371. doi: 10.1111/j.0954-6820.1985.tb02710.x. [DOI] [PubMed] [Google Scholar]
- 2.Eriksson KF, Lindgärde F. Contribution of estimated insulin resistance and glucose intolerance to essential hypertension. J Intern Med Suppl. 1991;735:75–83. [PubMed] [Google Scholar]
- 3.Bao W, Srinivasan SR, Berenson GS. Persistent elevation of plasma insulin levels is associated with increased cardiovascular risk in children and young adults. The Bogalusa Heart Study. Circulation. 1996;93:54–59. doi: 10.1161/01.cir.93.1.54. [DOI] [PubMed] [Google Scholar]
- 4.Haffner SM, Ferrannini E, Hazuda HP, Stern MP. Clustering of cardiovascular risk factors in confirmed prehypertensive individuals. Hypertension. 1992;20:38–45. doi: 10.1161/01.hyp.20.1.38. [DOI] [PubMed] [Google Scholar]
- 5.Marunaka Y, Hagiwara N, Tohda H. Insulin activates single amiloride-blockable Na channels in a distal nephron cell line (A6) Am J Physiol. 1992;263:F392–F400. doi: 10.1152/ajprenal.1992.263.3.F392. [DOI] [PubMed] [Google Scholar]
- 6.Mills E, Kuhn CM, Feinglos MN, Surwit R. Hypertension in CB57BL/6J mouse model of non-insulin-dependent diabetes mellitus. Am J Physiol. 1993;264:R73–R78. doi: 10.1152/ajpregu.1993.264.1.R73. [DOI] [PubMed] [Google Scholar]
- 7.Edwards JG, Tipton CM. Influences of exogenous insulin on arterial blood pressure measurements of the rat. J Appl Physiol (1985) 1989;67:2335–2342. doi: 10.1152/jappl.1989.67.6.2335. [DOI] [PubMed] [Google Scholar]
- 8.Meehan WP, Buchanan TA, Hsueh W. Chronic insulin administration elevates blood pressure in rats. Hypertension. 1994;23:1012–1017. doi: 10.1161/01.hyp.23.6.1012. [DOI] [PubMed] [Google Scholar]
- 9.Marunaka Y, Niisato N, Taruno A, Ohta M, Miyazaki H, Hosogi S, Nakajima K, Kusuzaki K, Ashihara E, Nishio K, et al. Regulation of epithelial sodium transport via epithelial Na+ channel. J Biomed Biotechnol. 2011;2011:978196. doi: 10.1155/2011/978196. [DOI] [PMC free article] [PubMed] [Google Scholar]
- 10.Marunaka Y. Characteristics and pharmacological regulation of epithelial Na+ channel (ENaC) and epithelial Na+ transport. J Pharmacol Sci. 2014;126:21–36. [PubMed] [Google Scholar]
- 11.Abdul-Ghani MA, DeFronzo RA. Pathogenesis of insulin resistance in skeletal muscle. J Biomed Biotechnol. 2010;2010:476279. doi: 10.1155/2010/476279. [DOI] [PMC free article] [PubMed] [Google Scholar]
- 12.International Diabetes Federation. Global Diabetes Plan 2011-2021. Available from: http: //www.idf.org/sites/default/files/Global_Diabetes_Plan_Final.pdf. [PubMed]
- 13.Felig P. Diabetic ketoacidosis. N Engl J Med. 1974;290:1360–1363. doi: 10.1056/NEJM197406132902405. [DOI] [PubMed] [Google Scholar]
- 14.Reaven GM, Olefsky JM. The role of insulin resistance in the pathogenesis of diabetes mellitus. Adv Metab Disord. 1978;9:313–331. doi: 10.1016/b978-0-12-027309-6.50021-5. [DOI] [PubMed] [Google Scholar]
- 15.Aoi W, Hosogi S, Niisato N, Yokoyama N, Hayata H, Miyazaki H, Kusuzaki K, Fukuda T, Fukui M, Nakamura N, et al. Improvement of insulin resistance, blood pressure and interstitial pH in early developmental stage of insulin resistance in OLETF rats by intake of propolis extracts. Biochem Biophys Res Commun. 2013;432:650–653. doi: 10.1016/j.bbrc.2013.02.029. [DOI] [PubMed] [Google Scholar]
- 16.Marunaka Y, Aoi W, Hosogi S, Niisato N, Yokoyama N, Hayata H, Miyazaki H, Kusuzaki K, Taruno A, Nomura T. What is the role of interstitial pH in diabetes mellitus? Improving action of propolis on type diabetes mellitus via pH regulation. Int J Mol Med. 2013;32:S50. [Google Scholar]
- 17.Marunaka Y, Yoshimoto K, Aoi W, Hosogi S, Ikegaya H. Low pH of interstitial fluid around hippocampus of the brain in diabetic OLETF rats. Mol Cell Therapies. 2014;2:6. doi: 10.1186/2052-8426-2-6. [DOI] [PMC free article] [PubMed] [Google Scholar]
- 18.Li R, Guan MX. Human mitochondrial leucyl-tRNA synthetase corrects mitochondrial dysfunctions due to the tRNALeu(UUR) A3243G mutation, associated with mitochondrial encephalomyopathy, lactic acidosis, and stroke-like symptoms and diabetes. Mol Cell Biol. 2010;30:2147–2154. doi: 10.1128/MCB.01614-09. [DOI] [PMC free article] [PubMed] [Google Scholar]
- 19.El-Hattab AW, Emrick LT, Hsu JW, Chanprasert S, Jahoor F, Scaglia F, Craigen WJ. Glucose metabolism derangements in adults with the MELAS m.3243A& gt; G mutation. Mitochondrion. 2014;18:63–69. doi: 10.1016/j.mito.2014.07.008. [DOI] [PMC free article] [PubMed] [Google Scholar]
- 20.Adeva-Andany M, López-Ojén M, Funcasta-Calderón R, Ameneiros-Rodríguez E, Donapetry-García C, Vila-Altesor M, Rodríguez-Seijas J. Comprehensive review on lactate metabolism in human health. Mitochondrion. 2014;17:76–100. doi: 10.1016/j.mito.2014.05.007. [DOI] [PubMed] [Google Scholar]
- 21.Gosmanov AR, Gosmanova EO, Dillard-Cannon E. Management of adult diabetic ketoacidosis. Diabetes Metab Syndr Obes. 2014;7:255–264. doi: 10.2147/DMSO.S50516. [DOI] [PMC free article] [PubMed] [Google Scholar]
- 22.Persson B. Determination of plasma acetoacetate and D-beta-hydroxybutyrate in new-born infants by an enzymatic fluorometric micro-method. Scand J Clin Lab Invest. 1970;25:9–18. doi: 10.3109/00365517009046184. [DOI] [PubMed] [Google Scholar]
- 23.Dedkova EN, Blatter LA. Role of β-hydroxybutyrate, its polymer poly-β-hydroxybutyrate and inorganic polyphosphate in mammalian health and disease. Front Physiol. 2014;5:260. doi: 10.3389/fphys.2014.00260. [DOI] [PMC free article] [PubMed] [Google Scholar]
- 24.Ward CA, Moffat MP. Modulation of sodium-hydrogen exchange activity in cardiac myocytes during acidosis and realkalinisation: effects on calcium, pHi, and cell shortening. Cardiovasc Res. 1995;29:247–253. [PubMed] [Google Scholar]
- 25.Park CO, Xiao XH, Allen DG. Changes in intracellular Na+ and pH in rat heart during ischemia: role of Na+/H+ exchanger. Am J Physiol. 1999;276:H1581–H1590. doi: 10.1152/ajpheart.1999.276.5.H1581. [DOI] [PubMed] [Google Scholar]
- 26.Loh SH, Chen WH, Chiang CH, Tsai CS, Lee GC, Jin JS, Cheng TH, Chen JJ. Intracellular pH regulatory mechanism in human atrial myocardium: functional evidence for Na(+)/H(+) exchanger and Na(+)/HCO(3)(-) symporter. J Biomed Sci. 2002;9:198–205. doi: 10.1007/BF02256066. [DOI] [PubMed] [Google Scholar]
- 27.Hosogi S, Miyazaki H, Nakajima K, Ashihara E, Niisato N, Kusuzaki K, Marunaka Y. An inhibitor of Na(+)/H(+) exchanger (NHE), ethyl-isopropyl amiloride (EIPA), diminishes proliferation of MKN28 human gastric cancer cells by decreasing the cytosolic Cl(-) concentration via DIDS-sensitive pathways. Cell Physiol Biochem. 2012;30:1241–1253. doi: 10.1159/000343315. [DOI] [PubMed] [Google Scholar]
- 28.Hosogi S, Kusuzaki K, Inui T, Wang X, Marunaka Y. Cytosolic chloride ion is a key factor in lysosomal acidification and function of autophagy in human gastric cancer cell. J Cell Mol Med. 2014;18:1124–1133. doi: 10.1111/jcmm.12257. [DOI] [PMC free article] [PubMed] [Google Scholar]
- 29.Marunaka Y. Roles of ionic environments in growth of human cancer cell and potentials of ion transporter blockers in cancer therapies. J Gastrointest Digest Syst. 2014;3:163. [Google Scholar]
- 30.Liu L, Duke BJ, Malik B, Yue Q, Eaton DC. Biphasic regulation of ENaC by TGF-{alpha} and EGF in renal epithelial cells. Am J Physiol Renal Physiol. 2009;296:F1417–F1427. doi: 10.1152/ajprenal.90337.2008. [DOI] [PMC free article] [PubMed] [Google Scholar]
- 31.Aoi W, Marunaka Y. The importance of regulation of body fluid pH in the development and progression of metabolic diseases. In: Berhardt LV, editor Advances in Medicine and Biology, editors. Hauppauge, USA: Nova Publishers; 2014. pp. 177–189. [Google Scholar]
- 32.Bonen A. Lactate transporters (MCT proteins) in heart and skeletal muscles. Med Sci Sports Exerc. 2000;32:778–789. doi: 10.1097/00005768-200004000-00010. [DOI] [PubMed] [Google Scholar]
- 33.Juel C. Lactate-proton cotransport in skeletal muscle. Physiol Rev. 1997;77:321–358. doi: 10.1152/physrev.1997.77.2.321. [DOI] [PubMed] [Google Scholar]
- 34.Han B, Bai XH, Lodyga M, Xu J, Yang BB, Keshavjee S, Post M, Liu M. Conversion of mechanical force into biochemical signaling. J Biol Chem. 2004;279:54793–54801. doi: 10.1074/jbc.M406880200. [DOI] [PubMed] [Google Scholar]
- 35.Kourtoglou GI. Insulin therapy and exercise. Diabetes Res Clin Pract. 2011;93 Suppl 1:S73–S77. doi: 10.1016/S0168-8227(11)70017-1. [DOI] [PubMed] [Google Scholar]
- 36.Garcia CK, Goldstein JL, Pathak RK, Anderson RG, Brown MS. Molecular characterization of a membrane transporter for lactate, pyruvate, and other monocarboxylates: implications for the Cori cycle. Cell. 1994;76:865–873. doi: 10.1016/0092-8674(94)90361-1. [DOI] [PubMed] [Google Scholar]
- 37.Xu AS, Kuchel PW. Characterisation of erythrocyte transmembrane exchange of trifluoroacetate using 19F-NMR: evidence for transport via the monocarboxylate transporter. Biochim Biophys Acta. 1993;1150:35–44. doi: 10.1016/0005-2736(93)90118-j. [DOI] [PubMed] [Google Scholar]
- 38.Poole RC, Halestrap AP. Transport of lactate and other monocarboxylates across mammalian plasma membranes. Am J Physiol. 1993;264:C761–C782. doi: 10.1152/ajpcell.1993.264.4.C761. [DOI] [PubMed] [Google Scholar]
- 39.Juel C, Holten MK, Dela F. Effects of strength training on muscle lactate release and MCT1 and MCT4 content in healthy and type 2 diabetic humans. J Physiol. 2004;556:297–304. doi: 10.1113/jphysiol.2003.058222. [DOI] [PMC free article] [PubMed] [Google Scholar]
- 40.Opitz D, Lenzen E, Schiffer T, Hermann R, Hellmich M, Bloch W, Brixius K, Brinkmann C. Endurance training alters skeletal muscle MCT contents in T2DM men. Int J Sports Med. 2014;35:1065–1071. doi: 10.1055/s-0034-1371838. [DOI] [PubMed] [Google Scholar]
- 41.Huang S, Czech MP. The GLUT4 glucose transporter. Cell Metab. 2007;5:237–252. doi: 10.1016/j.cmet.2007.03.006. [DOI] [PubMed] [Google Scholar]
- 42.Stöckli J, Fazakerley DJ, James DE. GLUT4 exocytosis. J Cell Sci. 2011;124:4147–4159. doi: 10.1242/jcs.097063. [DOI] [PMC free article] [PubMed] [Google Scholar]
- 43.Morgan BJ, Chai SY, Albiston AL. GLUT4 associated proteins as therapeutic targets for diabetes. Recent Pat Endocr Metab Immune Drug Discov. 2011;5:25–32. doi: 10.2174/187221411794351914. [DOI] [PubMed] [Google Scholar]
- 44.Souto G, Donapetry C, Calviño J, Adeva MM. Metabolic acidosis-induced insulin resistance and cardiovascular risk. Metab Syndr Relat Disord. 2011;9:247–253. doi: 10.1089/met.2010.0108. [DOI] [PMC free article] [PubMed] [Google Scholar]
- 45.Mandel EI, Curhan GC, Hu FB, Taylor EN. Plasma bicarbonate and risk of type 2 diabetes mellitus. CMAJ. 2012;184:E719–E725. doi: 10.1503/cmaj.120438. [DOI] [PMC free article] [PubMed] [Google Scholar]
- 46.Hayata H, Miyazaki H, Niisato N, Yokoyama N, Marunaka Y. Lowered extracellular pH is involved in the pathogenesis of skeletal muscle insulin resistance. Biochem Biophys Res Commun. 2014;445:170–174. doi: 10.1016/j.bbrc.2014.01.162. [DOI] [PubMed] [Google Scholar]
- 47.Otsuki M, Kitamura T, Goya K, Saito H, Mukai M, Kasayama S, Shimomura I, Koga M. Association of urine acidification with visceral obesity and the metabolic syndrome. Endocr J. 2011;58:363–367. doi: 10.1507/endocrj.k10e-319. [DOI] [PubMed] [Google Scholar]
- 48.Maalouf NM, Cameron MA, Moe OW, Adams-Huet B, Sakhaee K. Low urine pH: a novel feature of the metabolic syndrome. Clin J Am Soc Nephrol. 2007;2:883–888. doi: 10.2215/CJN.00670207. [DOI] [PubMed] [Google Scholar]
- 49.Maalouf NM, Cameron MA, Moe OW, Sakhaee K. Metabolic basis for low urine pH in type 2 diabetes. Clin J Am Soc Nephrol. 2010;5:1277–1281. doi: 10.2215/CJN.08331109. [DOI] [PMC free article] [PubMed] [Google Scholar]
- 50.Farwell WR, Taylor EN. Serum bicarbonate, anion gap and insulin resistance in the National Health and Nutrition Examination Survey. Diabet Med. 2008;25:798–804. doi: 10.1111/j.1464-5491.2008.02471.x. [DOI] [PubMed] [Google Scholar]
- 51.Hayata H, Miyazaki H, Niisato N, Yokoyama N, Marunaka Y. Involvement of the extracellular pH in skeletal muscle insulin resistance. J Physiol Sci. 2013;63:S199. doi: 10.1016/j.bbrc.2014.01.162. [DOI] [PubMed] [Google Scholar]
- 52.Khalil ML. Biological activity of bee propolis in health and disease. Asian Pac J Cancer Prev. 2006;7:22–31. [PubMed] [Google Scholar]
- 53.Krol W, Czuba Z, Scheller S, Gabrys J, Grabiec S, Shani J. Anti-oxidant property of ethanolic extract of propolis (EEP) as evaluated by inhibiting the chemiluminescence oxidation of luminol. Biochem Int. 1990;21:593–597. [PubMed] [Google Scholar]
- 54.Song YS, Park EH, Jung KJ, Jin C. Inhibition of angiogenesis by propolis. Arch Pharm Res. 2002;25:500–504. doi: 10.1007/BF02976609. [DOI] [PubMed] [Google Scholar]
- 55.Kimoto T, Arai S, Kohguchi M, Aga M, Nomura Y, Micallef MJ, Kurimoto M, Mito K. Apoptosis and suppression of tumor growth by artepillin C extracted from Brazilian propolis. Cancer Detect Prev. 1998;22:506–515. doi: 10.1046/j.1525-1500.1998.00020.x. [DOI] [PubMed] [Google Scholar]
- 56.Kimoto T, Koya-Miyata S, Hino K, Micallef MJ, Hanaya T, Arai S, Ikeda M, Kurimoto M. Pulmonary carcinogenesis induced by ferric nitrilotriacetate in mice and protection from it by Brazilian propolis and artepillin C. Virchows Arch. 2001;438:259–270. doi: 10.1007/s004280000350. [DOI] [PubMed] [Google Scholar]
- 57.Tachibana I, Akiyama T, Kanagawa K, Shiohara H, Furumi K, Watanabe N, Otsuki M. Defect in pancreatic exocrine and endocrine response to CCK in genetically diabetic OLETF rats. Am J Physiol. 1996;270:G730–G737. doi: 10.1152/ajpgi.1996.270.4.G730. [DOI] [PubMed] [Google Scholar]
- 58.Vinik AI, Ziegler D. Diabetic cardiovascular autonomic neuropathy. Circulation. 2007;115:387–397. doi: 10.1161/CIRCULATIONAHA.106.634949. [DOI] [PubMed] [Google Scholar]
- 59.Vinik AI, Nevoret M, Casellini C, Parson H. Neurovascular function and sudorimetry in health and disease. Curr Diab Rep. 2013;13:517–532. doi: 10.1007/s11892-013-0392-x. [DOI] [PubMed] [Google Scholar]
- 60.Doherty-Fuller E, Copeland KC. Sweat tests in patients with diabetes insipidus. Clin Pediatr (Phila) 1988;27:330–332. doi: 10.1177/000992288802700704. [DOI] [PubMed] [Google Scholar]
- 61.Mirza Z, Kamal MA, Buzenadah AM, Al-Qahtani MH, Karim S. Establishing genomic/transcriptomic links between Alzheimer’s disease and type 2 diabetes mellitus by meta-analysis approach. CNS Neurol Disord Drug Targets. 2014;13:501–516. doi: 10.2174/18715273113126660154. [DOI] [PubMed] [Google Scholar]
- 62.Dudek H, Datta SR, Franke TF, Birnbaum MJ, Yao R, Cooper GM, Segal RA, Kaplan DR, Greenberg ME. Regulation of neuronal survival by the serine-threonine protein kinase Akt. Science. 1997;275:661–665. doi: 10.1126/science.275.5300.661. [DOI] [PubMed] [Google Scholar]
- 63.Recio-Pinto E, Rechler MM, Ishii DN. Effects of insulin, insulin-like growth factor-II, and nerve growth factor on neurite formation and survival in cultured sympathetic and sensory neurons. J Neurosci. 1986;6:1211–1219. doi: 10.1523/JNEUROSCI.06-05-01211.1986. [DOI] [PMC free article] [PubMed] [Google Scholar]
- 64.Rasgon N, Jarvik L. Insulin resistance, affective disorders, and Alzheimer’s disease: review and hypothesis. J Gerontol A Biol Sci Med Sci. 2004;59:178–183; discussion 184-192. doi: 10.1093/gerona/59.2.m178. [DOI] [PubMed] [Google Scholar]
- 65.Steen E, Terry BM, Rivera EJ, Cannon JL, Neely TR, Tavares R, Xu XJ, Wands JR, de la Monte SM. Impaired insulin and insulin-like growth factor expression and signaling mechanisms in Alzheimer’s disease--is this type 3 diabetes? J Alzheimers Dis. 2005;7:63–80. doi: 10.3233/jad-2005-7107. [DOI] [PubMed] [Google Scholar]
- 66.Packard MG, Goodman J. Factors that influence the relative use of multiple memory systems. Hippocampus. 2013;23:1044–1052. doi: 10.1002/hipo.22178. [DOI] [PubMed] [Google Scholar]
- 67.Modest VE, Butterworth JF. Effect of pH and lidocaine on beta-adrenergic receptor binding. Interaction during resuscitation? Chest. 1995;108:1373–1379. doi: 10.1378/chest.108.5.1373. [DOI] [PubMed] [Google Scholar]


