

Abstract
Objective
To identify the neural substrate of self-regulatory control in children and adults with Tourette syndrome (TS).
Method
We used event-related functional magnetic resonance imaging (fMRI) to study the neural correlates of cognitive self-regulation during the Simon task. Forty-two people from The Tic Disorder Specialty Clinic who met the Diagnostic and Statistical Manual of Mental Disorders, Fourth Edition criteria for diagnosis with TS (24 children; 18 adults) were compared with 37 control subjects (19 children; 18 adults). Patients with TS were excluded from participation if they had any Axis I psychiatric disorder other than obsessive–compulsive disorder (OCD) or attention-deficit hyperactivity disorder (ADHD) prior to the onset of TS. Control participants were excluded if they reported a history of tic disorder, OCD, ADHD, or if they met diagnostic criteria for any Axis I disorder at the time of interview.
Results
We detected greater overall fMRI activation in adults than in children across both diagnostic groups, primarily in frontal and striatal regions. In both groups we also detected an age-related shift away from more general cortical activation toward a more specific reliance on frontostriatal activity, a developmental correlate that was exaggerated in the TS group despite behavioural performances similar to those of control subjects. Moreover, the severity of tics correlated positively with frontal activations across age groups.
Conclusion
Frontostriatal circuits support cognitive and behavioural control. These circuits likely contribute both to optimal performance in this self-regulatory task and to the regulation of the severity of tics. Adults with persistent TS likely possess deficient activity in these circuits, attributable to either a failure of prefrontal plasticity or to disturbances in striatal functioning.
Keywords: Tourette syndrome, children, impulse control, cognitive inhibition, anterior cingulate cortex, basal ganglia, neuroimaging, functional magnetic resonance imaging
The symptoms of TS are typically most severe early in the second decade of life.1–4 They improve by young adulthood in about 90% of patients and remit entirely in more than 40%.2,5–7 Therefore, adults who remain symptomatic represent a minority of those who have a lifetime diagnosis of TS.8–10 How brain structure and function differ in people whose symptoms persist from those whose symptoms remit or attenuate throughout adolescence is of utmost importance to understanding the pathophysiology of TS and to improving treatments.
Reduced volumes of the caudate nucleus in childhood are thought to contribute to the genesis of tic symptoms and to determine the long-term outcome of symptom severity.11,12 Anatomical neuroimaging studies have shown that children with TS may compensate for the putative effects of reduced caudate volumes on tic symptoms and cognition through plastic changes of the dorsal prefrontal and parietal cortices, as well as the portions of the corpus callosum that connect these cortices across the cerebral midline, thereby improving the behavioural control of tics.5,13,14 This compensatory process may be impaired in adults who have persistent symptoms.15,16 The degree of activation of frontostriatal circuits, particularly the subcortical components, correlates with and presumably determines the severity of tic symptoms.17
We used the Simon task—a paradigm assessing self-regulatory control and executive attention—in an event-related fMRI study to investigate the differences in performance and neural activation between children and adults with TS. Self-regulation is the ability to govern one’s own emotions, thoughts, or actions on direction from the self or another person. Willful suppression of tics requires self-regulatory control,17 similar to performance of the Simon task; thus both activities likely draw on the same or closely related neural circuits.
Given links between self-regulatory control and activation of frontostriatal circuits in adults,17 and during childhood and adolescence,18 we hypothesized that adults with persistent TS would rely more on frontostriatal processing during performance of the Simon task than would children with TS. We expected that this developmental trajectory of activation would differ in TS subjects, compared with the control subjects, reflecting the particularly impaired regulatory control in symptomatic TS adults. Moreover, we expected the severity of tics in adults with persistent TS to correlate with the magnitude of activation of frontostriatal circuits. Finally, we investigated the influence of maturational processes on performance, both in people with TS and in control subjects.
Methods
Recruitment and Screening
Participants diagnosed with TS were recruited from the Tic Disorder Specialty Clinic at the Yale Child Study Center in New Haven, Connecticut. Control subjects, residing in the same zip codes as people from the TS group, were recruited by phone from a list of 10 000 names purchased from a telemarketing company. Potential control subjects were randomly selected from this list; about 10% of the eligible families contacted agreed to participate. The Yale Medical School Institutional Review Board approved the study and written informed consent was obtained from all participants.
The TS group consisted of 42 participants: 24 children (14 male) and 18 adults (12 male). The control group consisted of 37 participants: 19 children (12 male) and 18 adults (8 male). The recruitment process ensured that age, sex, handedness, IQ, and SES were comparable between diagnostic groups. Datasets from 4 TS subjects (2 children; 2 adults) and 4 control subjects (3 children; 1 adult) were excluded from both the fMRI and behavioural analysis owing to technical problems (for example, excessive motion). Final analyses were performed on the populations shown in Table 1.
Table 1.
Demographic breakdown of subgroups
| Groupa | nb | Years mean (SD) | Age range, years | Male | Right-handed | Tic severityc mean (SD) |
|---|---|---|---|---|---|---|
| TS children | 22 | 13.0 (2.7) | 8.9 to 18.2 | 12 | 21 | 22.9 (15.2) |
| TS adults | 16 | 38.1 (13.5) | 23.9 to 64.6 | 10 | 12 | 19.1 (10.2) |
| Control children | 16 | 12.8 (2.6) | 8.0 to 16.9 | 10 | 13 | 5.4 (6.3) |
| Control adults | 17 | 40.4 (12.4) | 22.8 to 59.2 | 9 | 15 | 4.4 (3.7) |
We divided people with TS and control subjects into children and adults if they were younger or older than 18 years of age, respectively.
n = number of people (one adult with TS had comorbid OCD; one child with TS had comorbid OCD and ADHD)
Tic severity was measured using the Yale Global Tic Severity Scale (YGTSS); 2 adults and 3 children with TS had remitted tic symptoms (that is, YGTSS scores = 5).
Participants with TS met DSM-IV criteria for that diagnosis. Patients with TS were excluded from participation if they had any Axis I psychiatric disorder other than OCD or ADHD prior to the onset of TS. Control participants were excluded if they reported a history of tic disorder, OCD, ADHD, or if they met diagnostic criteria for any Axis I disorder at the time of interview. Additional exclusionary criteria for both groups included a lifetime history of either substance abuse or head trauma, or a full-scale IQ of less than 75. Neuropsychiatric diagnoses were established through clinical evaluation and the administration of STOBS.19 The STOBS includes the Kiddie-Schedule for Affective Disorders and Schizophrenia, epidimiologic version, for diagnoses in children20,21; the Schedule for Affective Disorders and Schizophrenia in adults,22 and more detailed sections on TS and OCD for both age groups. Final clinical diagnoses were determined through a consensus procedure of expert clinicians using all available clinical and investigative materials. Ratings of current and worst-ever severity of tic symptoms were obtained using the Yale Global Tic Severity Scale23 and either the child or adult version of the Yale-Brown Obsessive–Compulsive Scale.24,25 SES and handedness were assessed using the Hollingshead Index of Social Status26 and the Edinburgh Inventory,27 respectively. IQ was measured using the Wechsler Abbreviated Scale of Intelligence.
Simon Task
A series of white arrowheads pointing either left or right was displayed against a black background in 2 symmetrically predetermined positions either to the left or to the right of a white fixation crosshair positioned at the centre of the screen. While most stimuli consisted of congruent arrowheads (that is, pointing in the direction congruous with their location on the screen relative to the central fixation), some stimuli pointed in a direction opposite to their screen position (incongruent trials).
Stimulus duration was 1300 ms and the inter-stimulus interval was 350 ms. Each run consisted of 102 stimuli (lasting 168 s) with 6 to 7 incongruent stimuli interleaved pseudorandomly every 13 to 16 congruent stimuli (21.5 to 26.4 s apart). Each run featured an average of 51 left arrows and 51 right arrows. On average, 51 arrows appeared to the left and 51 appeared to the right of the central fixation. One-half of the incongruent stimuli required the same response as the preceding congruent stimulus and one-half required the opposite response. Although each participant was expected to complete 10 experimental runs, some participants did not complete all 10 (for example, owing to fatigue); however, all completed at least 6.
Stimulus Presentation
Stimuli were back-projected onto a screen positioned in front of the subject at the opening of the magnet’s bore. Subjects viewed the display through a 2-sided mirror mounted above their eyes inside the head coil. Subjects who were nearsighted were fitted with appropriate corrective lenses. All stimuli were presented using the PsyScope software28 running on a Macintosh computer (Apple Computer, Cupertino, CA). A digital interface recorded the acquisition time of each image, enabling synchronization of stimulus presentation with image acquisition (within 20 ms).
Stimuli subtended 1° vertically and 3.92° horizontally in the visual field. Participants were instructed to respond quickly and accurately to the direction the arrow was pointing by using their right hand to depress 1 of 2 buttons on a response box. The index finger and middle finger were used for a left- or right-pointing arrow, respectively. The distance between the 2 response keys was identical to that of 2 adjacent keys on a standard keyboard.
Image Acquisition and Processing
Imaging data were acquired using a General Electric 1.5 Tesla Signa LX scanner (GE, Milwaukee, WI). Head positioning was standardized using the canthomeatal line. A T1-weighted sagittal localizing scan was used to position the axial images. In all subjects, 10 axial T1-weighted slices were acquired to correspond with 10 axial sections of the Talairach coordinate system29 oriented parallel to the AC–PC line. The slices were positioned with 2 slices below, 7 slices above, and 1 slice containing the AC–PC line. Slice thickness was a constant 7 mm, while the skip between slices varied (range = 0.5 to 2 mm) to maintain a strict correspondence with the Talairach coordinate system. Functional images were acquired using a gradient-recalled, single-shot echoplanar pulse sequence, at the same locations as the 10 axial T1-weighted slices, in runs of 1020 images, or 102 per slice. Repetition time = 1650 ms, echo time = 60 ms, flip angle = 60°, acquisition matrix = 128 × 64, field of view = 40 × 20 cm, slice thickness = 7 mm. Therefore, in-plane resolution was 3.12 × 3.12 mm.
Analysis of all neuroimaging data was performed using locally developed software, which has been used in multiple publications.30 The change in fMRI signal associated with the contrast of incongruent and congruent stimuli indexed the neural components that were responsible for responding appropriately in each condition. Only trials with correct responses were included in the analyses.
Preprocessing
Data were visually inspected for artifacts such as ghosting. Datasets that were not rejected were then motion-corrected using Statistical Parametric Mapping 99, with realignment to the middle image of the middle run. Images were discarded if the peak motion estimates from Statistical Parametric Mapping 99 exceeded 1 mm displacement or 2° rotation.31 Drift of baseline image intensity was removed using an eighth order high-pass Butterworth filter, with a frequency cut-off equal to three-quarters of the task’s frequency. The time series were filtered once forward and once backward to ensure no change in phase of the signal in relation to the phase of the task. Low-intensity pixels outside of the brain were removed, and the images were spatially smoothed using a Gaussian filter, with a full width at half maximum of 6.3 mm.
Analyses
Voxel-Wise Analyses of Mean fMRI Signal Changes
We hypothesized that fMRI activations in the frontostriatal circuits would differ across age and diagnostic groups (that is, Age × Diagnosis interaction). We tested this hypothesis using a voxel-wise regression analysis based on the general linear model. First, the T1-weighted axial anatomical images and corresponding echoplanar functional images for each subject were transformed into a common stereotactic space using a piece-wise linear warping to a common bounding box.29 The pixel-wise average change in fMRI signal associated with the presentation of incongruent stimuli was then calculated for each subject. This process was accomplished by first discarding the initial 2 images (spanning 3.3 s) following the presentation of each incongruent stimulus in each subject’s echoplanar time series to account for the hemodynamic time lag. The average signal of the 6 images preceding presentation of the incongruent stimuli was subtracted from the average of the 3 images following the incongruent stimuli at each pixel. A t statistic was calculated, comparing this average signal change across subjects with a value of zero. During calculation of the group composite activation map, a randomization procedure was employed that randomly changed the sign on the maps to create a distribution of false-positive activations. This distribution of false positives was compared with the real map to determine the significance of the real activations. The resulting voxel-based maps, t tested with an uncorrected P < 0.05 and cluster filtered at 9 voxels, showed the results across both diagnosis and age groups (Figure 1). The combined application of a statistical threshold and cluster filter has previously been shown to reduce substantially the false-positive identification of activated pixels at any given threshold.32 Based on an approximation formula,31 the corrected P value accounting for multiple comparisons across all voxels within the volume of brain imaged for this conjoint requirement was less than 0.029.
Figure 1. Group-averaged brain activations and contrasts.
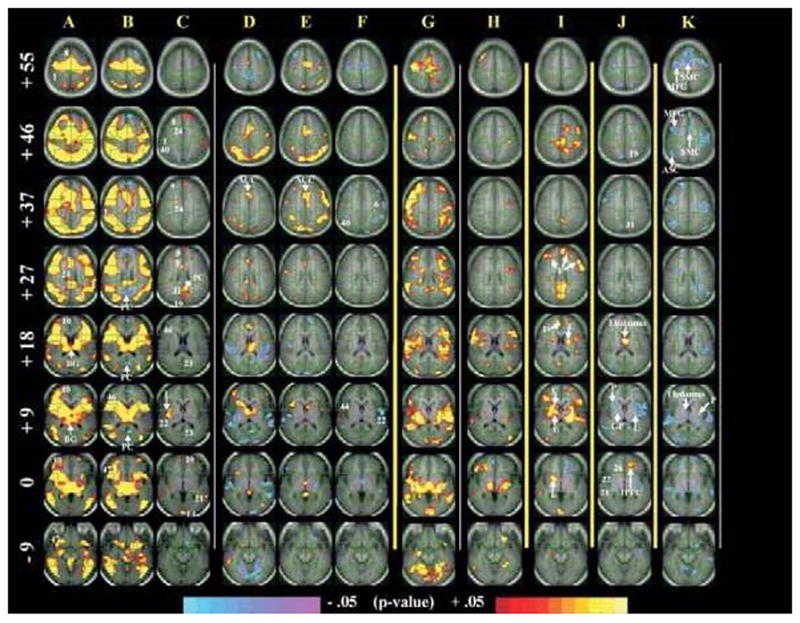
Parallel to the AC–PC plane, 8 sections are shown at the level of the AC–PC (Z = 0), as well as 9 mm below (Z = −9) and above (Z > 0). Images were generated using an uncorrected P < 0.05 and cluster filtered at 9 adjacent voxels (conjoined corrected P value to account for multiple comparisons was P < 0.029). Numbers represent approximate BAs. The numbers (in white) to the left of images in column A represent Z coordinates (in mm) of the Talairach Atlas.
A. TS adults. Massive activations are seen in frontal and parietal areas, as well as in basal ganglia structures.
B. Control adults. In addition to activations of frontal, parietal, and basal ganglia areas, prominent deactivations are also evident (for example, in the posterior cingulate cortex).
C. TS, compared with control adults (the contrast A and B). Adults with TS activate more than control subjects in anterior (that is, prefrontal cortex) and posterior (that is, posterior cingulate cortex) areas but also in subcortical structures (for example, lenticular nucleus).
D. TS children. Children with TS show diffuse deactivations and rely more on cortical (for example, anterior cingulate cortex) than subcortical circuitry for task performance.
E. Control children. Fewer deactivations and even less reliance on subcortical structures is evident.
F. TS, compared with control children (the contrast D and E). Diffuse differences in cortical activation are detected between the 2 groups.
G. TS adults, compared with TS children (the contrast A and D). Activation of corticostriatal areas: adults with TS rely more on corticostriatal circuits than children with TS.
H. Control adults, compared with control children (the contrast B and E). Similar to column G, control subjects show a transition away from cortical activation (column B) toward increased striatal activation. However, in TS adults, this age correlate is exaggerated (column G).
I. The contrast G and H. This centrepiece contrast represents the Age × Diagnosis interaction that tests our a priori hypothesis, illustrating the involvement of prefrontal components, as well as caudate nucleus and lenticular nucleus. Increased frontostriatal activity in adults with persistent TS seems exaggerated, compared with that of control subjects. This activation pattern likely represents an adaptive process aimed at increasing self-regulation.
J. Correlation of fMRI signal with tic severity in people with TS. Increased fMRI activation is associated with fewer tics, including in the right globus pallidus, left lenticular nucleus, and right tail of the putamen; positive correlations with tic severity in the thalamus and left inferior prefrontal regions.
K. Correlation of fMRI signal with Simon conflict (reaction time for incongruent minus congruent trials) in people with TS. Inverse correlations in corticostriatal components are seen in, among other regions, the supplementary motor cortex, middle frontal gyrus, association cortices; and the thalamus, and putamen, subcortical components of cortico-striato-thalamo-cortical circuits. Inverse correlations (blue) indicate that more activation accompanies smaller interference scores (better performance).
Analyses of Activation Time Course
The time course of signal change at each pixel was calculated in relation to onset of each incongruent stimulus. The time series at each voxel was first smoothed with a Gaussian filter having a full-width at half maximum of 1.98 s. Interpolated adjustments were made in the time course data for the variations in the time of acquisition of each slice during each imaging volume. The average of the 6 images (spanning 9.9 s) directly preceding each incongruent stimulus was then subtracted from each of the following 8 images. The resulting t maps were generated using an uncorrected threshold of P < 0.005 and a cluster filter of 9 adjacent voxels. A statistical estimate for a corrected P value for this conjunction of threshold and cluster filters, accounting for multiple statistical comparisons, was less than 0.003.31
Correlation of fMRI Activation With Both Simon Interference and Symptom Severity Scores
Correlations were calculated between fMRI signal changes and Simon interference (incongruent minus congruent latencies) and between fMRI signal changes and the severity of tics as obtained outside of the scanner.
Behavioural Analyses
Incorrect responses and mistrials were excluded from the reaction time data. The remaining reaction time data were subjected to a recursive outlier analysis where latencies falling 2 standard deviations, either above or below the mean score for each subject in each condition, were excluded from further analyses.33 This procedure eliminated 8.1% of the trials (1.4% incorrect responses, 5.8% out-of-range reaction time, and 0.9% mistrials). The remaining reaction time trials and all accuracy data were then analyzed using a mixed linear model.
Results
Imaging Data
Contrast maps of group-average activation compared TS and control children and adults (Figure 1, columns A to H). Greater overall activation, primarily in frontal and striatal regions, was detected in adults, compared with children, across both diagnostic groups (columns G and H). The control subjects pattern of activation displays a shift away from widespread cortical activation in childhood and into more focused frontostriatal activation in adults (columns B, E, and H). This pattern of activation was exaggerated in adults with TS, compared with control subjects (columns A, D, G, and I). Activation in children with TS was less than in control children (column F) within BAs 6, 21, 22, and 40. Activation in adults with TS was greater than in control adults (column C) in BAs 1, 8, 9, 21, 22, 24, 31, 40, and the lingual gyrus. Also, the posterior cingulate did not deactivate in TS adults, although it did in control subjects (columns A and B, BA 23). We found that activations generally increase across development to a greater degree in the TS subjects than in control subjects, especially in frontostriatal systems (column I, that is, Age × Diagnosis). Thus this latter finding confirmed our a priori hypothesis by showing that prefrontal and striatal activations come prominently online with increased age and as a function of diagnosis.
The fMRI signal change (that is, the magnitude of task-related activation) correlated positively with the severity of tics (column J) in the thalamus and left inferior prefrontal regions, and correlated inversely with severity in the left globus pallidus, left inferior frontal gyrus, right lenticular nucleus, and right tail of the putamen. Correlation of fMRI signal change with interference scores (reaction time during incongruent minus congruent trials) in people with TS revealed negative values primarily in frontostriatal areas (column K).
Time Course Analyses
Time course contrast maps compared fMRI activations over time for TS and control children and adults across the 13.2 s following presentation of the incongruent stimulus (that is, 8 times the repetition time of 1650 ms). Whereas a comparison of TS with control children revealed no significant differences (contrast maps for time course not shown), a comparison of TS and control adults revealed early differences in the midfrontal gyrus and later differences in the dorsal tail of the caudate and lenticular nucleus (Figure 2).
Figure 2. Time course of activation for TS, compared with control adults.
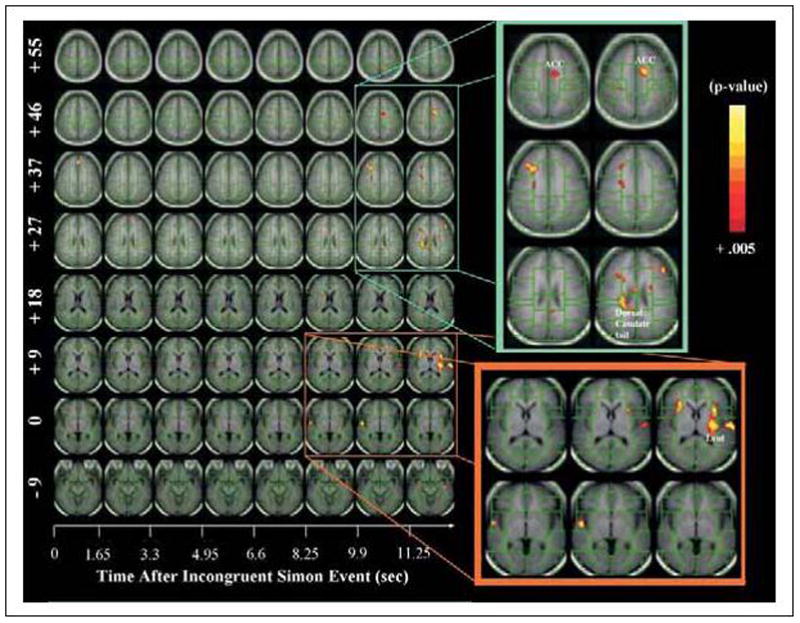
While the y axis, similar to Figure 1, shows brain slices parallel to the AC–PC plane at various Z values, the x axis shows the time (in seconds) following an incongruent trial. TS adults activated frontal and striatal areas (that is, dorsal caudate tail and lenticular nucleus) 10 to 13 s following presentation of the incongruent stimulus. This pronounced and largely delayed activation in adults with TS likely represents a strategic adaptation (for example, motor preparation) in adults with persistent TS and further supports the involvement of frontostriatal pathways in a compensatory response. Images were generated using an uncorrected P < 0.005 and cluster filtered at 9 adjacent voxels (conjoined corrected P value to account for multiple comparisons was P < 0.003).
This time course analysis shows that relative to control adults, TS adults activated frontostriatal systems 10 to 13 s after a correct response to an incongruent stimulus.
Behavioural Data
The full model describing analyses of the behavioural data is available on request. Overall, behavioural performance was comparable and the Age × Diagnosis × Run interaction was not significant (F < 1). All 4 groups (that is, children with TS, adults with TS, control children, and control adults) demonstrated significant interference effects as measured by both reaction time and accuracy. Reaction time for congruent trials were stable across runs within each group, but incongruent latencies decreased across runs. Whereas accuracy on the congruent trials was stable across runs within both the TS and control adult groups, performance variability was evident across runs in both TS and control children.
Discussion
During performance of a self-regulatory task, we detected greater overall fMRI activation in adults than in children across both diagnostic groups, primarily in frontal and striatal regions. However, this pattern of activation was exaggerated in adults with TS, compared with control adults. Moreover, the severity of tics correlated positively with the magnitude of frontal activations during the Simon task. In discussing these findings in more detail, together with those for the time course of fMRI activation and the comparison of behavioural performances across groups, we will suggest that exaggerated activation of frontostriatal circuits represent a compensatory response that enhances self-regulatory control in adults with TS.
Developmental Correlates of fMRI Activation
In both the TS and control groups, children, compared with adults, showed greater activation of association cortices. However, adults activated frontostriatal circuits more than children did. Thus with increasing age, people seemed to move away from reliance on widespread cortical activation toward engagement of frontostriatal circuits when self-regulating during this task (Figure 1). Preferentially engaging frontostriatal circuits may free up cortical resources and permit less effortful cognitive involvement for performance of repetitive tasks (for example, during the frequent occurrence of congruent trials in the Simon task).9 Therefore, greater frontostriatal activation with advancing development may contribute to improved self-regulatory control and increased automaticity.34,35 In people with TS, this developmental shift toward frontostriatal activation appears exaggerated (Figure 1, column I).
Previous studies have reported increased volumes of dorsal prefrontal regions, as well as reduced sizes of the corpus callosum, in children with TS; because the magnitude of these anatomical changes accompany less severe tic symptoms, they have been interpreted as representing activity-dependent neural plasticity in the frontal systems and associated white matter pathways16,36 that subserve self-regulatory control, thereby reducing the severity of tics in children with TS.5,13,36 In symptomatic adults, this neuroplastic compensatory response seems relatively deficient and likely contributes to the persistence of tics.5,16,37
Earlier fMRI findings of intense frontal and striatal activation during willful tic suppression further implicated frontostriatal circuits in the self-regulatory control of these unwanted behaviours.17 Our fMRI findings also implicate engagement of frontostriatal circuits as important in self-regulatory control during performance of the Simon task. Thus both of these self-regulatory demands—the control of tic symptoms and performance on the Simon task—seem to tap the same or closely related neural systems.
Prior reports suggest that suppressing specific thoughts and actions in favour of goal-directed alternatives across differing contexts and time periods defines cognitive control.38 However, the efficiency of self-regulation and cognitive control seems to improve and to engage different neural systems during maturation from childhood to adulthood.39 A normative developmental pattern of increased reliance on frontostriatal circuits into adulthood, together with deficient neuroplasticity in adults with TS and the co-opted recruitment of frontostriatal circuits in contexts of self-regulation (both willful tic suppression and Simon performance), suggest that the frontostriatal activation detected in our study likely represents an additional adaptive process that subserves increased self-regulation in adults with persistent TS.
Default-Mode Processing and Suboptimal Self-Regulatory Control
Our fMRI findings of group differences in regions implicated in default-mode processing suggest that people with TS may work harder (that is, use more effortful control) than healthy controls on self-regulatory tasks. Default-mode processing refers to brain functions in a baseline, or a resting, state (that is, its free associative processing of thoughts and emotions).40 Recent fMRI data from control subjects showed more prominent deactivations in brain areas associated with conflict resolution and nonspecific attentional processing (that is, in posterior cingulate, ventral anterior cingulated cortex, and mesial prefrontal cortices) as a function of increasing age during performance of a comparable self-regulatory task.18 Because these deactivations likely represent more activity in this system during the baseline task in adults, they were interpreted as reflecting the freeing up of attentional resources and more active monitoring of internal states during the easier baseline task (that is, congruent trials). Similarly, as is evident in our control subjects and consistent with numerous other neuroimaging reports,41–45 activity also decreased in a set of regions, including the posterior cingulate gyrus and medial prefrontal cortices (Figure 1, column B). However, we could not detect evidence of default-mode processing in our population of adults with TS (Figure 1, column A). Its apparent absence suggests that even during the easier baseline condition, adults with TS allocate greater attention to task performance. Thus, relative to control subjects, adults with persistent TS likely exert more effortful control to compensate for their suboptimal self-regulatory control, and they seem to exhibit greater attentional allocation to performance of the simpler baseline task.
Time Course Analysis
An analysis of the time course of task-related activation revealed a similar pattern and time course of brain activity in TS and control children. TS adults, compared with control adults, however, activated frontal and striatal areas (that is, dorsal tail of the caudate and the lenticular nucleus) 10 to 13 s following presentation of the incongruent stimulus (Figure 2), accounting for the greater activation of frontostriatal systems detected in our a priori analyses. Given the long interval after presentation of the last incongruent stimuli and the approaching next incongruent stimulus, this exaggerated and delayed activation in TS adults likely represents a strategic adaptation (for example, an alteration of response set and anticipatory preparedness) to which adults with persistent TS may resort, perhaps without conscious awareness. Thus this time course analysis provides additional support for the involvement of frontostriatal pathways in a compensatory response in adults with TS.
Correlations of fMRI Signal With Tic Severity and Behavioural Performance
Our findings indicate that during the exercise of behavioural inhibition when performing the Simon task, people with TS rely on some of the same frontostriatal components that activate when TS subjects willfully suppress their tics.17 Moreover, activation during performance of the Simon task correlated inversely with tic severity (that is, more activation was associated with fewer tics) in the left globus pallidus, left inferior frontal gyrus, right lenticular nucleus, and right tail of the putamen (Figure 1, column J), and it correlated positively with the severity of tics (that is, activation increased with more severe tics) in the thalamus and left inferior prefrontal regions (column J). Moreover, the fMRI signal correlated inversely with measures of behavioural performance largely within corticostriatal pathways (column K), indicating that better performance accompanied stronger activation. In other words, basal ganglia structures seem to activate more when fewer symptoms are present, whereas corticostriatal areas activate more when task performance is better. Thus these findings suggest that a general system of self-regulatory control may subserve both the modulation of tic symptoms and performance on the Simon task.
Behavioural Performance
Analyses of reaction time and accuracy revealed that the overall performance of people with TS closely resembled that of control subjects. TS and control adults demonstrated comparable accuracy on the first run of the Simon task, when the task was still novel. However, healthy control adults seemed to learn the task quickly, experiencing a sharp drop in errors after the first run; in contrast, TS adults demonstrated greater variability in both reaction time and errors over the first several runs, once again supporting the interpretation that the Simon task may have been more difficult for people with TS, compared with control subjects. Because different brain activations between diagnostic groups resulted in overall comparable behavioural performance, this variability in performance likely reflects a compensatory effort to maintain adequate behavioural performance.46
Caveats
Many of the people diagnosed with TS in this sample were either medicated at the time of the scan or had a history of exposure to medication used to control TS symptoms. Although medication may affect brain activity and structure, we did not observe medication effects in the analyses of subgroups of medicated and unmedicated participants. Although our study did not exclude people with multiple diagnoses (that is, ADHD and OCD), we did not detect an influence of comorbid OCD, ADHD, or any interactions of OCD or ADHD on our general findings. Indeed, people with pure TS showed comparable findings to those reported for the entire study group. Similarly, separate analyses revealed that handedness was not a factor in our results.
Conclusions
A transition away from widespread cortical activation in childhood toward greater reliance on activation of frontostriatal circuits in adulthood appears to be a normative feature of human development that supports improved self-regulatory control. This developmental correlate is exaggerated in people with TS. The greater activation in TS adults, compared with that in control subjects may represent an adaptive process aimed at gaining better control. We speculate that this process may occur in lieu of the neuroanatomical plasticity in prefrontal cortices that help to attenuate the severity of tics in children with TS. Replication and future investigation should test whether attention training may increase effective functional compensation and reduce tic symptoms in people with TS.39,47
Supplementary Material
Clinical Implication
Drawing on a large sample of both children and adults with TS, our findings unravel aspects of self-regulatory control in TS across development.
Limitations
Although people with TS may be either medicated at the time of the scan or had a history of exposure to medication, we did not observe medication effects in the analyses of medicated and unmedicated subgroups.
In addition, people with pure TS showed comparable findings with those reported for the entire study group. However, unlike TS that persists into adulthood, which defines a select subgroup of people who have a lifetime diagnosis of TS, children with TS probably more accurately represent the larger population of clinically ascertained children with TS.
Acknowledgments
Funding and Support
This work was supported in part by National Institute of Mental Health grants MH01232, K02–74677, MH59139, and MH068318, a grant from the Tourette Syndrome Association, by support from the Suzanne Crosby Murphy Endowment at Columbia University College of Physicians and Surgeons, and the Thomas D Klingenstein and Nancy D Perlman Family Fund. In addition, the tail end of this project received partial support from the National Alliance for Research on Schizophrenia and Affective Disorders Young Investigator Award to Dr Raz.
We are grateful to Dr James Leckman, Dr Robert King, and Dr Larry Scahill for their referral of subjects for this study. We thank Jason Buhle for his technical assistance.
Abbreviations used in this article
- AC–PC
anterior commissure–posterior commissure
- ADHD
attention-deficit hyperactivity disorder
- BA
Broadmann area
- DSM
Diagnostic and Statistical Manual of Mental Disorders
- fMRI
functional magnetic resonance imaging
- OCD
obsessive–compulsive disorder
- SES
socioeconomic status
- STOBS
Schedule for Tourette Syndrome and Other Behavioural Disorders
- TS
Tourette syndrome
References
- 1.Park S, Como PG, Cui L, et al. The early course of the Tourette’s syndrome clinical spectrum. Neurology. 1993;43:1712–1715. doi: 10.1212/wnl.43.9.1712. [DOI] [PubMed] [Google Scholar]
- 2.Leckman JF, Zhang H, Vitale A, et al. Course of tic severity in Tourette’s syndrome: the first two decades. Pediatrics. 1998;102:14–19. doi: 10.1542/peds.102.1.14. [DOI] [PubMed] [Google Scholar]
- 3.Bruun RD. The natural history of Tourette’s syndrome. In: Cohen DJ, Bruun RD, Leckman JF, editors. Tourette’s syndrome and tic disorders: clinical understanding and treatment. New York (NY): John Wiley & Sons; 1988. pp. 21–39. [Google Scholar]
- 4.Erenberg G, Cruse RP, Rothner AD. The natural history of Tourette syndrome: a follow-up study. Ann Neurol. 1987;22:383–385. doi: 10.1002/ana.410220317. [DOI] [PubMed] [Google Scholar]
- 5.Spessot AL, Plessen KJ, Peterson BS. Neuroimaging of developmental psychopathologies: the importance of self-regulatory and neuroplastic processes in adolescence. Ann N Y Acad Sci. 2004;1021:86–104. doi: 10.1196/annals.1308.010. [DOI] [PubMed] [Google Scholar]
- 6.Peterson BS, Panksepp J. The biological basis of childhood neuropsychiatric disorders. In: Panksepp J, editor. A textbook of biological psychiatry. New York (NY): John Wiley & Sons, Inc; 2003. pp. 393–436. [Google Scholar]
- 7.Burd L, Kerbeshian PJ, Barth A, et al. Long-term follow-up of an epidemiologically defined cohort of patients with Tourette syndrome. J Child Neurol. 2001;16:431–437. doi: 10.1177/088307380101600609. [DOI] [PubMed] [Google Scholar]
- 8.Peterson BS, Riddle MA, Cohen DJ, et al. Reduced basal ganglia volumes in Tourette’s syndrome using three-dimensional reconstruction techniques from magnetic resonance images. Neurology. 1993;43:941–949. doi: 10.1212/wnl.43.5.941. [DOI] [PubMed] [Google Scholar]
- 9.Peterson BS, Staib L, Scahill L, et al. Regional brain and ventricular volumes in Tourette syndrome. Arch Gen Psychiatry. 2001;58:427–440. doi: 10.1001/archpsyc.58.5.427. [DOI] [PubMed] [Google Scholar]
- 10.Peterson BS, Thomas P, Kane MJ, et al. Basal ganglia volumes in patients with Gilles de la Tourette syndrome. Arch Gen Psychiatry. 2003;60:415–424. doi: 10.1001/archpsyc.60.4.415. [DOI] [PubMed] [Google Scholar]
- 11.Peterson BS, Leckman JF, Arnsten A, et al. Neuroanatomical circuitry. In: Leckman JF, Cohen DJ, editors. Tourette’s syndrome—tics, obsessions, compulsions: developmental psychopathology and clinical care. New York (NY): Wiley & Sons, Inc; 1999. pp. 230–259. [Google Scholar]
- 12.Bloch MH, Leckman JF, Zhu H, et al. Caudate volumes in childhood predict symptom severity in adults with Tourette syndrome. Neurology. 2005;65:1253–1258. doi: 10.1212/01.wnl.0000180957.98702.69. [DOI] [PMC free article] [PubMed] [Google Scholar]
- 13.Spessot AL, Peterson BS. Tourette syndrome: a multifactorial, developmental pychopathology. In: Cicchetti D, Cohen DJ, editors. Manual of developmental psychopathology. 2. New York (NY): John Wiley & Sons, Inc; 2004. [Google Scholar]
- 14.Gerard E, Peterson BS. Developmental processes and brain imaging studies in Tourette syndrome. J Psychosom Res. 2003;55:13–22. doi: 10.1016/s0022-3999(02)00581-0. [DOI] [PubMed] [Google Scholar]
- 15.Peterson BS, Staib L, Scahill L, et al. Regional brain and ventricular volumes in Tourette syndrome. Arch Gen Psychiatry. 2001;58:427–440. doi: 10.1001/archpsyc.58.5.427. [DOI] [PubMed] [Google Scholar]
- 16.Plessen KJ, Wentzel-Larsen T, Hugdahl K, et al. Altered interhemispheric connectivity in individuals with Tourette’s disorder. Am J Psychiatry. 2004;161:2028–2037. doi: 10.1176/appi.ajp.161.11.2028. [DOI] [PubMed] [Google Scholar]
- 17.Peterson BS, Skudlarski P, Anderson AW, et al. A functional magnetic resonance imaging study of tic suppression in Tourette syndrome. Arch Gen Psychiatry. 1998;55:326–333. doi: 10.1001/archpsyc.55.4.326. [DOI] [PubMed] [Google Scholar]
- 18.Marsh R, Zhu H, Schultz R, et al. A developmental fMRI study of self-regulatory control. Hum Brain Mapp. 2006;27(11):848–863. doi: 10.1002/hbm.20225. [DOI] [PMC free article] [PubMed] [Google Scholar]
- 19.Pauls DL, Hurst C. Schedule for Tourette and other behavioral syndromes. New Haven (CT): Yale University Child Study Center; 1996. [Google Scholar]
- 20.Kaufman J, Birmaher B, Brent D, et al. Schedule for Affective Disorders and Schizophrenia for School-Aged Children–Present and Lifetime Version (KSADS-PL): initial reliability and validity data. J Am Acad Child Adolesc Psychiatry. 1997;36(7):980–988. doi: 10.1097/00004583-199707000-00021. [DOI] [PubMed] [Google Scholar]
- 21.Ambrosini P, Metz C, Prabucki K, et al. Videotape reliability of the third revised edition of the K-SADS. J Am Acad Child Adolesc Psychiatry. 1989;28(5):723–728. doi: 10.1097/00004583-198909000-00013. [DOI] [PubMed] [Google Scholar]
- 22.Endicott J, Spitzer RL. A diagnostic interview: the Schedule for Affective Disorders and Schizophrenia. Arch Gen Psychiatry. 1978;35(7):837–844. doi: 10.1001/archpsyc.1978.01770310043002. [DOI] [PubMed] [Google Scholar]
- 23.Leckman JF, Riddle MA, Hardin MT, et al. The Yale Global Tic Severity Scale: initial testing of a clinician-rated scale of tic severity. J Am Acad Child Adolesc Psychiatry. 1989;28(4):566–573. doi: 10.1097/00004583-198907000-00015. [DOI] [PubMed] [Google Scholar]
- 24.Goodman WK, Price LH, Rasmussen SA, et al. The Yale-Brown Obsessive Compulsive Scale I: development, use, and reliability. Arch Gen Psychiatry. 1989;46(11):1006–1011. doi: 10.1001/archpsyc.1989.01810110048007. [DOI] [PubMed] [Google Scholar]
- 25.Scahill L, Riddle MA, McSwiggin-Hardin M, et al. Children’s Yale-Brown Obsessive Compulsive Scale: reliability and validity. J Am Acad Child Adolesc Psychiatry. 1997;36(6):844–852. doi: 10.1097/00004583-199706000-00023. [DOI] [PubMed] [Google Scholar]
- 26.Hollingshead AB. Four-factor index of social status. New Haven (CT): Yale University Press; 1975. [Google Scholar]
- 27.Oldfield RC. The assessment and analysis of handedness: the Edinburgh inventory. Neuropsychologia. 1971;9:97–113. doi: 10.1016/0028-3932(71)90067-4. [DOI] [PubMed] [Google Scholar]
- 28.Cohen JD, MacWhinney B, Flatt M, et al. PsyScope: a new graphic interactive environment for designing psychology experiments. Behav Res Method, Instrum Compute. 1993;25:257–271. [Google Scholar]
- 29.Talairach J, Tournoux P. Co-planar steroetactic atlas of the human brain. New York (NY): Thieme Medical Publishers; 1988. [Google Scholar]
- 30.Skudlarski P, Constable R, Gore J. ROC analysis of statistical methods used in functional MRI: individual subjects. NeuroImage. 1999;9:311–329. doi: 10.1006/nimg.1999.0402. [DOI] [PubMed] [Google Scholar]
- 31.Friston KJ, Williams S, Howard R, et al. Movement-related effects in fMRI time-series. Magn Reson Med. 1996;35:346–355. doi: 10.1002/mrm.1910350312. [DOI] [PubMed] [Google Scholar]
- 32.Forman SD, Cohen JD, Fitzgerald M, et al. Improved assessment of significant activation in functional magnetic resonance imaging (fMRI): use of a cluster-size threshold. Magn Reson Med. 1995;33:636– 647. doi: 10.1002/mrm.1910330508. [DOI] [PubMed] [Google Scholar]
- 33.Van Selst M, Jolicoeur P. A solution to the effect of sample size on outlier elimination. Q J Exp Psychol A. 1994;47A:631–650. [Google Scholar]
- 34.Shiffrin RM, Schneider W. Controlled and automatic human information-processing. Perceptual learning, automatic attending, and a general theory. Psychol Rev. 1977;84:127–190. [Google Scholar]
- 35.Spelke E, Hirst W, Neisser U. Skills of divided attention. Cognition. 1976;4:215–230. [Google Scholar]
- 36.Peterson BS, Staib L, Scahill L, et al. Regional brain and ventricular volumes in Tourette syndrome. Arch Gen Psychiatry. 2001;58:427–440. doi: 10.1001/archpsyc.58.5.427. [DOI] [PubMed] [Google Scholar]
- 37.Peterson BS, Thomas P, Kane MJ, et al. Basal ganglia volumes in patients with Gilles de la Tourette syndrome. Arch Gen Psychiatry. 2003;60:415–424. doi: 10.1001/archpsyc.60.4.415. [DOI] [PubMed] [Google Scholar]
- 38.Galvan A, Hare TA, Davidson M, et al. The role of ventral frontostriatal circuitry in reward-based learning in humans. J Neurosci. 2005;25:8650– 8656. doi: 10.1523/JNEUROSCI.2431-05.2005. [DOI] [PMC free article] [PubMed] [Google Scholar]
- 39.Rueda MR, Rothbart MK, McCandliss BD, et al. Training, maturation, and genetic influences on the development of executive attention. Proc Natl Acad Sci U S A. 2005;102:14931–14936. doi: 10.1073/pnas.0506897102. [DOI] [PMC free article] [PubMed] [Google Scholar]
- 40.Fox MD, Snyder AZ, Vincent JL, et al. The human brain is intrinsically organized into dynamic, anticorrelated functional networks. Proc Natl Acad Sci U S A. 2005;102:9673–9678. doi: 10.1073/pnas.0504136102. [DOI] [PMC free article] [PubMed] [Google Scholar]
- 41.McGuire PK, Paulesu E, Frackowiak RS, et al. Brain activity during stimulus independent thought. Neuroreport. 1996;7:2095– 2099. [PubMed] [Google Scholar]
- 42.Shulman GL, Fiez JA, Corbetta M, et al. Common blood flow changes across visual tasks: II. Decreases in cerebral cortex. J Cogn Neurosci. 1997;9:648– 663. doi: 10.1162/jocn.1997.9.5.648. [DOI] [PubMed] [Google Scholar]
- 43.Gusnard DA, Raichle ME. Searching for a baseline: functional imaging and the resting human brain. Nat Rev Neurosci. 2001;2:685–694. doi: 10.1038/35094500. [DOI] [PubMed] [Google Scholar]
- 44.Greicius MD, Menon V. Default-mode activity during a passive sensory task: uncoupled from deactivation but impacting activation. J Cogn Neurosci. 2004;16:1484–1492. doi: 10.1162/0898929042568532. [DOI] [PubMed] [Google Scholar]
- 45.Greicius MD, Krasnow B, Reiss AL, et al. Functional connectivity in the resting brain: a network analysis of the default mode hypothesis. Proc Natl Acad Sci U S A. 2003;100:253–258. doi: 10.1073/pnas.0135058100. [DOI] [PMC free article] [PubMed] [Google Scholar]
- 46.Peterson BS. Conceptual, methodological, and statistical challenges in brain imaging studies of developmentally based psychopathologies. Dev Psychopathol. 2003;15:811–832. doi: 10.1017/s0954579403000385. [DOI] [PubMed] [Google Scholar]
- 47.Raz A, Keller S, Norman K, et al. Elucidating Tourette’s syndrome: perspectives from hypnosis, attention and self-regulation. Am J Clin Hypn. 2007;49:289– 309. doi: 10.1080/00029157.2007.10524506. [DOI] [PubMed] [Google Scholar]
Associated Data
This section collects any data citations, data availability statements, or supplementary materials included in this article.