

Abstract
Associations of collateral vessels and lower extremity plaque with functional decline are unknown. Among people with peripheral artery disease (PAD), we determined whether greater superficial femoral artery (SFA) plaque burden combined with fewer lower extremity collateral vessels was associated with faster functional decline, compared to less plaque and/or more numerous collateral vessels. A total of 226 participants with ankle–brachial index (ABI) <1.00 underwent magnetic resonance imaging of lower extremity collateral vessels and cross-sectional imaging of the proximal SFA. Participants were categorized as follows: Group 1 (best), maximum plaque area < median and collateral vessel number ≥6 (median); Group 2, maximum plaque area < median and collateral vessel number <6; Group 3, maximum plaque area > median and collateral vessel number ≥6; Group 4 (worst), maximum plaque area > median and collateral vessel number <6. Functional measures were performed at baseline and annually for 2 years. Analyses adjust for age, sex, race, comorbidities, and other confounders. Annual changes in usual-paced walking velocity were: Group 1, +0.01 m/s; Group 2, −0.02 m/s; Group 3, −0.01 m/s; Group 4, −0.05 m/s (p-trend=0.008). Group 4 had greater decline than Group 1 (p<0.001), Group 2 (p=0.029), and Group 3 (p=0.010). Similar trends were observed for fastest-paced 4-meter walking velocity (p-trend=0.018). Results were not substantially changed when analyses were repeated with additional adjustment for ABI. However, there were no associations of SFA plaque burden and collateral vessel number with decline in 6-minute walk. In summary, a larger SFA plaque burden combined with fewer collateral vessels is associated with a faster decline in usual and fastest-paced walking velocity in PAD.
Keywords: atherosclerotic plaque, intermittent claudication, peripheral artery disease, physical functioning
Introduction
Collateral vessels provide a mechanism to protect against adverse outcomes associated with atherosclerosis.1–3 For people with lower extremity peripheral artery disease (PAD), collateral vessels are a natural bypass system, protect against critical limb ischemia, and may reduce ischemia-related leg symptoms.3 However, collateral vessels do not restore perfusion to normal.2 Whether collateral vessels protect against functional decline in people with PAD is unknown.
Lower ankle–brachial index (ABI) values, consistent with more severe PAD, are associated with a faster decline in functional performance.4,5 Lower ABI values are also associated with larger and more numerous collateral vessels.6 Among people with PAD, we studied whether greater plaque burden in the superficial femoral artery (SFA) combined with less numerous collateral vessels have faster functional decline, compared to people with PAD who have less plaque burden and/or more numerous collateral vessels. We also studied whether a smaller SFA lumen area combined with less numerous collateral vessels was associated with faster functional decline. We hypothesized that the combination of greater plaque burden (or smaller lumen area) combined with less numerous collateral vessels would be associated with faster functional decline in people with PAD. In separate analyses, we also studied the associations of collateral vessel number, SFA plaque burden, and SFA lumen area, respectively, to rates of functional decline in PAD.
Methods
Subjects
Participants were enrolled in the Walking and Leg Circulation Study (WALCS III) cohort, a longitudinal observational study relating baseline magnetic resonance imaging (MRI)-measured plaque severity to functional impairment and functional decline among individuals with PAD. Recruitment and data collection methods have been reported.7 Participants were identified from among consecutive PAD patients in non-invasive vascular laboratories at Northwestern Memorial Hospital and three other Chicago-area medical centers. Participants were also identified from among lists of consecutive PAD patients in vascular surgery, cardiology, endocrinology, general medicine, and geriatric practices at Northwestern and in the vascular surgery practice at the Jesse Brown VA. Some PAD participants were identified from among consecutive men and women aged 70 years and older in a general medical practice who were screened with the ABI and found to have an ABI <1.00.7 The protocol was Institutional Review Board-approved by all participating sites. Participants gave written informed consent. Participants completed a baseline visit and were asked to return for two annual follow-up visits.
Inclusion criteria
The inclusion criterion was an ABI <1.00. This inclusion criterion was selected because truly normal ABI values are 1.10–1.408–10 and because including participants with an ABI <1.00 ensured a broad range of severity of lower extremity atherosclerosis.
Exclusion criteria
Potential participants with dementia and those with a mini-mental status examination score <2311 were excluded. Nursing home residents, wheelchair-bound patients, and patients with foot or leg amputations were excluded because of severely impaired functioning at baseline. Non-English-speaking patients were excluded because investigators were not fluent in non-English languages. We excluded potential participants who required oxygen therapy, had contraindications to MRI, stopped the 6-minute walk test due to shortness of breath, had undergone recent major surgery, or had severe knee osteoarthritis. Severe arthritis was defined as a radiograph-measured osteoarthritis Kellgren-Lawrence (K/L) score of four among participants who reported pain in or around their knee(s) on most days.12
ABI measurement
After participants had rested supine for 5 minutes, a hand-held Doppler probe (Pocket-Dop II; Nicolet Vascular, Golden, CO, USA) was used to measure systolic pressures in this order: right brachial, dorsalis pedis, and posterior tibial arteries, and left dorsalis pedis, posterior tibial, and brachial arteries. Pressures were repeated in reverse order. The ABI was calculated by dividing average pressures in each leg by the average of the four brachial pressures.13 Average brachial pressures in the arm with the highest pressure were used when one brachial pressure was higher than the opposite brachial pressure in both measurement sets, and the two brachial pressures differed by 10 or more mmHg in at least one measurement set, since in such cases subclavian stenosis was possible.14 Data from undetectable or incompressible dorsalis pedis and posterior tibial arteries were excluded from the ABI calculation.
Magnetic resonance imaging
We imaged the SFA because it is the most common site of lower extremity atherosclerosis15 and because it supplies calf muscle, which is typically symptomatic in PAD. The leg with the lowest ABI was imaged. If the leg with the lowest ABI had an SFA stent, the opposite leg was imaged. MRI data were obtained with a 1.5 Tesla (Siemens Medical Solutions, Erlangen, Germany) platform using four-element phased-array surface coils. Twelve consecutive 2.5 mm cross-sectional images were obtained, moving distally from the most proximal point of the SFA using the common femoral artery bifurcation as a landmark. We used 2-dimensional bright blood time-of-flight and proton-density weighted images. Fat suppression was applied in black-blood sequences to improve image quality.
Two physician reviewers used CASCADE software (Seattle, WA, USA) to trace the outer boundary and the lumen of each SFA cross-sectional image. CASCADE software quantified the plaque area based on the tracings. Plaque measurements were normalized for artery size by dividing the measured maximum plaque area by the median of the outer wall area.7 To normalize the lumen area measures, the minimum lumen area was divided by the outer wall area at each site. Images for each participant were assigned to one primary reviewer, and arterial tracings were reviewed by the second reviewer to ensure accuracy. A 6% subsample of participants returned for a second day for test re-test reliability assessments of MRI measurements. The coefficient of variation percent values for these test re-test reliability assessments were 8.9 for maximum plaque area and 12.9 for minimum percent lumen area.
Magnetic resonance angiography
A 1.5 T Siemens Espree (Siemens Medical Solutions, Erlangen, Germany) MRI scanner was employed for magnetic resonance angiography (MRA) image acquisition using a 12-channel surface array coil (Siemens Medical Solutions). Dynamic MRA images from one station, the groin to the knee, were acquired from both legs, including the common femoral artery, the profunda femoris, the SFA, and the popliteal artery using the TWIST (Time resolved angiography With Interleaved Stochastic Trajectories) pulse sequence.6 Parallel imaging with generalized autocalibrating partially parallel acquisitions (GRAPPA) image reconstruction provided a twofold increase in frame rate. Following a three-plane localizer image, the TWIST sequence was applied in the coronal orientation. A 10 ml bolus of non-diluted gadopentetate dimeglumine (0.05 mmol/kg, Magnevist; Berlex, Montville, NJ, USA) was administered intravenously at 2 ml/s. Imaging parameters were: TR/TE/Flip angle = 3.3 ms/TE, 1.3 ms/25°; rFOV, 246 × 375 mm; matrix, 210 × 320; 88 partitions; voxel size after zero interpolation, 1.2 × 1.2 × 1.2 mm3 (true voxel size, 1.2 × 1.2 × 2.0 mm3); acceleration factor: 2.
MRA image analysis
A single radiologist, blinded to all other participant characteristics, read all MRA images on a workstation using established methods (GE Healthcare, Milwaukee, WI, USA).16,17 Based on prior work,6,18 a collateral vessel was defined based on a subjective impression of the presence of a collateral on an image. We also required that the collateral be visible throughout its length on the image, in order for it to be counted. The median number of collateral vessels per participant in our cohort was 5.9. Thus, we categorized participants according to whether they had 0–5 collateral vessels versus ≥6 collateral vessels.
Functional measures
Functional assessments were obtained at baseline and annually for up to two follow-up visits.
Six-minute walk
After standardized instructions by a certified health interviewer, participants walk up and down a 100-foot hallway for 6 minutes.4,5 Participants are advised to cover as much ground as possible during the 6 minutes. The health interviewer walks slightly behind the participant. The distance walked at the end of 6 minutes is recorded.
Four-meter walking velocity
Walking velocity was measured with a 4-meter walk performed at ‘usual’ and ‘fastest’ pace, based on previous study.4,7,19 For the usual-paced walk, participants are instructed to walk at their usual pace, ‘as if they are walking down the street to go to the store’. For the fastest-paced walk, participants are advised to walk at their fastest pace. Each walk is performed twice. The faster walk in each pair is used in analyses.4,7,19
Comorbidities
Algorithms developed for the Women’s Health and Aging Study and the Cardiovascular Health Study were used to document comorbidities.20 These algorithms combine data from patient report, physical examination, medical record review, medications, laboratory values, and a primary care physician questionnaire.20 The comorbidities assessed were angina, diabetes mellitus, myocardial infarction, stroke, heart failure, pulmonary disease, cancer, spinal stenosis, and disk disease. Criteria from the American College of Rheumatology were used to diagnose knee and hip osteoarthritis.12,21
Other measures
Height and weight were measured at the study visit. Body mass index (BMI) was calculated as weight (kg)/(height (m))2. Cigarette smoking was measured with self-report.
Statistical analyses
The following groups were defined for specific combinations of plaque area and number of collateral vessels: Group 1 (best): maximum plaque area < median and collateral vessel number ≥6 (i.e. least plaque combined with most numerous collateral vessel number); Group 2: maximum plaque area < median and collateral vessel number < 6; Group 3: maximum plaque area > median and collateral vessel number ≥6; Group 4 (worst): maximum plaque area > median and collateral vessel number <6 (i.e. greatest plaque combined with least numerous collateral vessel number). Similar groups were defined for the combination of minimum lumen area with collateral vessel number ≥6 vs <6 (Table 1).
Table 1.
Group definitions for combinations of plaque or lumen area and number of collateral vessels.
| Plaque area above median or lumen area below median | Plaque area below median or lumen area above median | |
|---|---|---|
| Collateral vessel number <6 | Group 4 (worst) | Group 2 |
| Collateral vessel number ≥6 | Group 3 | Group 1 (best) |
Differences in continuous and dichotomous variables were compared across the four groups defined for maximum plaque area and minimum lumen area, respectively, using analyses of variance and chi-squared tests, respectively. Average annual declines in each functional measure were compared across the four groups defined in Table 1 using analyses of covariance, adjusting for age, sex, race, prior year performance, smoking, BMI, and comorbidities. For each group, pairwise comparisons were made between Group 1 (best) and each remaining group. Analyses were repeated with additional adjustment for ABI. Associations of baseline plaque and baseline collateral measures, respectively, with average annual decline in each functional performance measure were also determined adjusting for age, sex, race, BMI, smoking, and comorbidities.
Results
Of 473 participants in the WALCS III cohort with an ABI <1.00, 291 had both plaque and MRA images available at baseline and 167 were not eligible for MRA or refused MRA testing. Of those with both plaque and MRA data at baseline, one had covariate data missing, 12 died and 18 underwent lower extremity revascularization before follow-up testing. An additional 34 participants did not return for follow-up, leaving 226 for longitudinal analyses. Compared to participants eligible for these analyses, those not eligible included a higher proportion of men (70.4% vs 59.9%, p=0.018) and a higher prevalence of prior myocardial infarction (25.9% vs 15.5%, p=0.005). The correlation between SFA plaque area and SFA lumen area was −0.891 (p<0.001). Of the 226 participants, 203 (90%) had an ABI <0.90.
Differences across Groups 1–4 were observed for the prevalence of men and ABI value (Table 2). Participants with the combination of high plaque area and few collateral vessels (Group 4) had lower BMI values than those with low plaque area and more numerous collateral vessels (Group 1).
Table 2.
Baseline characteristics of peripheral artery disease participants according to plaque burden and collateral vessel number.
| Baseline measures | Group 1a n=43 |
Group 2a n=66 |
Group 3a n=70 |
Group 4a n=47 |
p-value |
|---|---|---|---|---|---|
| Groups defined according to maximum plaque area and number of collateral vessels
| |||||
| Age, years | 67.4 (8.7) | 67.7 (10.1) | 70.4 (9.0) | 69.6 (10.3) | 0.237 |
| Male, % | 86.1 | 57.6 | 80.0 | 59.6 | 0.001 |
| African American, % | 48.8 | 31.8 | 34.3 | 25.6 | 0.122 |
| Ankle–brachial index | 0.68 (0.16) | 0.77 (0.16) | 0.59 (0.15) | 0.71 (0.13) | <0.001 |
| Body mass index, kg/m2 | 30.9 (5.8) | 29.7 (6.3) | 28.4 (4.6) | 28.1 (4.8)b | 0.041 |
| Current smoker, % | 27.9 | 28.8 | 20.0 | 34.0 | 0.384 |
| Angina, % | 18.6 | 16.7 | 31.4 | 23.4 | 0.189 |
| Myocardial infarction, % | 11.6 | 15.2 | 17.1 | 17.0 | 0.867 |
| Heart failure, % | 9.3 | 12.1 | 11.4 | 6.4 | 0.761 |
| Diabetes mellitus, % | 46.5 | 45.5 | 31.4 | 36.2 | 0.262 |
| Usual pace 4-meter walking velocity, m/s | 0.88 (0.15) | 0.88 (0.21) | 0.89 (0.17) | 0.87 (0.21) | 0.959 |
| Fast paced 4-meter walking velocity, m/s | 1.27 (0.23) | 1.21 (0.30) | 1.27 (0.28) | 1.17 (0.29) | 0.163 |
| 6-minute walk performance, feet | 1307.9 (343.5) | 1169.9 (483.0) | 1180.0 (393.2) | 1129.9 (354.5) | 0.185 |
|
| |||||
| Groups defined according to minimum lumen area and number of collateral vessels
| |||||
| Group 1a N=36 |
Group 2a N=77 |
Group 3a N=77 |
Group 4a N=37 |
p-value | |
|
| |||||
| Age, years | 67.0 (7.8) | 68.2 (20.3) | 70.3 (9.3) | 69.0 (10.0) | 0.327 |
| Male, % | 80.6 | 54.0 | 83.1 | 67.6 | 0.001 |
| African American, % | 50.0 | 29.0 | 35.1 | 29.7 | 0.155 |
| Ankle–brachial index | 0.67 (0.16) | 0.77 (0.16) | 0.60 (0.15) | 0.70 (0.12) | <0.001 |
| Body mass index, kg/m2 | 30.1 (5.7) | 29.5 (6.4) | 29.1 (5.0) | 28.1 (4.2) | 0.449 |
| Current smoker, % | 33.3 | 31.6 | 18.2 | 29.7 | 0.194 |
| Angina, % | 19.4 | 15.8 | 29.9 | 27.0 | 0.181 |
| Myocardial infarction, % | 5.6 | 15.8 | 19.5 | 16.2 | 0.299 |
| Heart failure, % | 11.1 | 11.8 | 10.4 | 5.4 | 0.755 |
| Diabetes mellitus, % | 50.0 | 43.4 | 31.2 | 37.8 | 0.218 |
| Usual pace 4-meter walking velocity, m/s | 0.91 (0.16) | 0.88 (0.21) | 0.88 (0.16) | 0.88 (0.21) | 0.844 |
| Fast paced 4-meter walking velocity, m/s | 1.31 (0.25) | 1.19 (0.30) | 1.25 (0.26) | 1.19 (0.29) | 0.124 |
| 6-minute walk performance, feet | 1335.9 (382.5) | 1159.5 (465.9) | 1178.4 (368.7) | 1140.3 (361.3) | 0.129 |
Group I: plaque area < median or lumen area > median combined with > 6 collateral vessels; Group 2: Plaque area < median or lumen area > median combined with < 6 collateral vessels; Group 3: plaque area > median or lumen area < median combined with > 6 collateral vessels; Group 4: Plaque area > median or lumen area < median combined with < 6 collateral vessels.
p-value <0.01 as compared to Group 1.
Significant differences in rates of decline in usual-paced 4-meter walking velocity were observed across Groups 1–4 for plaque area and for lumen area, adjusting for age, sex, race, prior year performance, comorbidities, BMI, and smoking (Figure 1). Participants with high plaque area combined with less numerous collateral vessels (Group 4) had faster decline in usual-paced 4-meter walking velocity, compared to participants with low plaque area combined with more numerous collateral vessels (Group 1) (p<0.001) (Figure 1). Similarly, participants with the smallest lumen area combined with less numerous collateral vessels (Group 4) had faster decline in usual-paced 4-meter walking velocity, compared to participants with the largest lumen area combined with more numerous collateral vessels (Group 1) (p<0.001) (Figure 1). Results were not meaningfully changed when analyses were repeated with additional adjustment for the ABI (Figure 1). Similar associations of Groups 1–4 were observed for decline in the fastest-paced 4-meter walking velocity for both maximum plaque area and minimum lumen area, respectively (Figure 2). Again, results were not substantially changed even after additional adjustment for the ABI (Figure 2). There were no significant associations of Groups 1–4 with rates of decline in 6-minute walk performance (Figure 3).
Figure 1.
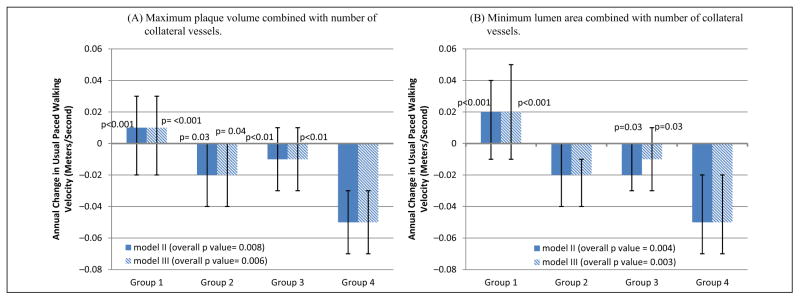
Average annual change in usual-paced 4-meter walking velocity according to baseline plaque area (A) or lumen area (B) combined with collateral vessel number in participants with peripheral artery disease. The p-values shown above the bars represent pairwise statistical comparisons with Group 4. Model II data are adjusted for age, sex, race, body mass index, comorbidities, smoking history, and prior year performance. Model III analyses add adjustment for the ankle–brachial index in Model II. Baseline usual-paced 4-meter walking velocity values for plaque area were Group 1: 0.88 m/s ±0.15; Group 2: 0.88 m/s ±0.21; Group 3: 0.89 m/s ±0.17; Group 4: 0.87 m/s ±0.21. Baseline usual-paced 4-meter walking velocity values for lumen area were Group 1: 0.91 m/s ±0.16; Group 2: 0.87 m/s ±0.21; Group 3: 0.88 m/s ±0.16; Group 4: 0.89 m/s ± 0.22.
Figure 2.
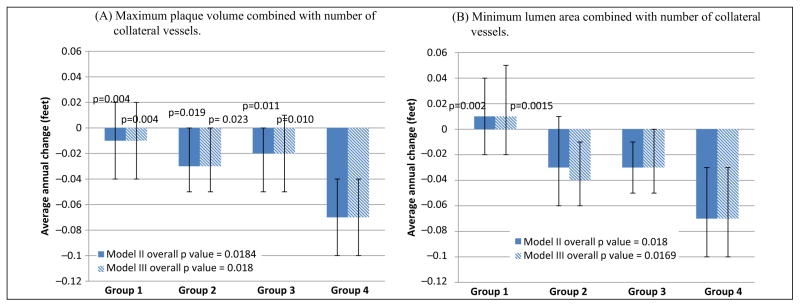
Average annual change in fastest-paced 4-meter walking velocity according to baseline plaque area (A) or lumen area (B) combined with collateral vessel number in participants with peripheral artery disease. The p-values shown above the bars represent pairwise statistical comparisons with Group 4. Model II data are adjusted for age, sex, race, body mass index, comorbidities, smoking history, and prior year performance. Model III analyses add adjustment for the ankle–brachial index in Model II. Baseline fastest-paced 4-meter walking velocity values for plaque area were Group 1: 1.27 m/s ±0.23; Group 2: 1.21 m/s ±0.30; Group 3: 1.27 m/s ±0.28; Group 4: 1.17 m/s ±0.29. Baseline usual-paced 4-meter walking velocity values for lumen area were Group 1: 1.31 m/s ±0.25; Group 2: 1.19 m/s ±0.30; Group 3: 1.25 m/s ±0.26; Group 4: 1.19 m/s ±0.29.
Figure 3.

Average annual change in 6-minute walk performance according to baseline plaque area (A) or lumen area (B) combined with collateral vessel number in participants with peripheral artery disease. Model II data are adjusted for age, sex, race, body mass index, comorbidities, smoking history, and prior year performance. Model III analyses add adjustment for the ankle–brachial index in Model II. Baseline 6-minute walk values for plaque area were Group 1: 1308 feet ±344; Group 2: 1170 feet ±483; Group 3: 1180 feet ±393; Group 4: 1130 feet ±355. Baseline 6-minute walk values for lumen area were Group 1: 1136 feet ±383; Group 2: 1160 feet ±466; Group 3: 1178 feet ±369; Group 4: 1140 feet ±361.
There were no associations of plaque area alone or lumen area alone with decline in usual or fastest-paced 4-meter walking velocity or 6-minute walk performance, adjusting for age, sex, race, comorbidities, smoking, BMI, and prior year performance (Table 3). However, when collateral vessels were categorized according to whether the number of collaterals was equal to or more than the median (≥6 collateral vessels), versus less than the median (<6 collateral vessels), those with fewer collateral vessels had faster decline in the usual and fastest-paced walking velocity, adjusting for age, sex, race, comorbidities, smoking, BMI, and prior year performance (Table 3).
Table 3.
Associations of plaque area and lumen area with functional decline in peripheral artery disease.a
| Associations of maximum plaque area with average annual decline
| |||
|---|---|---|---|
| Above median | Below median | p-value | |
| 6-minute walk (feet) | −42.2 | −28.3 | 0.331 |
| Usual-paced 4-meter walking velocity (m/s) | −0.02 | −0.01 | 0.121 |
| Fastest-paced 4-meter walking velocity (m/s) | −0.03 | −0.02 | 0.123 |
| Associations of minimum lumen area with average annual decline
| |||
|---|---|---|---|
| Above median | Below median | p-value | |
| 6-minute walk (feet) | −28.0 | −42.9 | 0.291 |
| Usual-paced 4-meter walking velocity (m/s) | −0.01 | −0.02 | 0.158 |
| Fastest-paced 4-meter walking velocity (m/s) | 0.02 | −0.03 | 0.126 |
| Associations of number of collateral vessels with average annual decline
| |||
|---|---|---|---|
| ≥Median number of collateral vessels | < Median number of collateral vessels | p-value | |
| 6-minute walk (feet) | −32.9 | −40.6 | 0.668 |
| Usual-paced 4-meter walking velocity (m/s) | −0.0 | −0.03 | 0.006 |
| Fastest-paced 4-meter walking velocity (m/s) | −0.02 | −0.05 | 0.040 |
Data are adjusted for age, sex, race, comorbidities, smoking, BMI, prior year functioning, and patterns of missing data.
Discussion
Among 226 people with an ABI <1.00, the combination of greater plaque burden with less numerous collateral vessels was associated with a significantly faster annual decline in usual-paced and fastest-paced 4-meter walking velocity. Similarly, smaller lumen area combined with less numerous collateral vessels was associated with a faster decline in usual-paced and fastest-paced walking velocity. Differences in rates of decline between Group 1 and Group 4 for plaque area and for lumen area were consistent with a clinically meaningful decline in walking velocity.22 Specifically, previous study demonstrates that a small meaningful difference in walking velocity is a change of 0.50 meters/second because this magnitude of difference in decline in walking velocity has been linked with changes in mobility disability.22 Thus, differences in change in 4-meter walking velocity between Groups 1 and 4 were consistent with small meaningful differences.
In contrast, the combination of plaque and collateral characteristics, defined by Groups 1–4, was not associated with the degree of decline in 6-minute walk performance. Usual and fastest-paced 4-meter walking velocity are distinct measures as compared to the 6-minute walk, since 4-meter walking velocity relies more on Type 2 muscle fiber performance, while the 6-minute walk measures walking endurance and relies on Type 1 muscle fibers. Our results suggest that characteristics associated with a decline in walking endurance measures, such as the 6-minute walk, may differ from those associated with a decline in shorter walking performance measures, such as the 4-meter walking velocity. For example, calf muscle density, mitochondrial metabolism, walking efficiency, and cardiopulmonary fitness may be more important determinants of decline in the 6-minute walk than superficial femoral artery plaque burden or collateral vessels.23,24 Prior work shows that usual-paced and fastest-paced 4-meter walking velocity predict all-cause mortality, cardiovascular disease mortality, and mobility loss in people with PAD.25,26 Thus, usual and fastest-paced 4-meter walking velocity are important outcomes in people with PAD.
Collaterals develop from pre-existing arterioles that enlarge in response to sheer stress forces precipitated by arterial stenosis and activation of mechanosensors. Animal evidence suggests that following arterial occlusion, vessels first increase rapidly in number and later enlarge in diameter.27 These collateral vessels serve as a natural bypass system and are thought to protect against critical limb ischemia. Significant resources have been invested in identifying interventions to increase collateral vessel number or size to improve walking performance in people with PAD.28,29 To our knowledge, no prior studies have assessed associations of plaque burden, collateral vessels, or their combination with functional decline in people with PAD. We did not find consistent, statistically significant associations of plaque burden or lumen area alone with rates of decline in any walking performance measure in people with PAD. However, PAD participants with less than the median number of collateral vessels had significantly faster decline in usual and fastest-paced 4-meter walking velocity than those with greater numbers of collateral vessels. The combination of greatest plaque burden or smallest lumen area PAD with less numerous collaterals was associated with faster functional decline compared to other PAD participants. Prior clinical trials using pharmacologic therapy to increase angiogenesis and arteriogenesis in people with PAD have not demonstrated that these medications can improve functional performance in PAD.30,31 Our findings suggest that these therapies may be most effective in PAD patients with the most severe lower extremity atherosclerosis. Our findings also suggest that the combination of greatest lower extremity plaque burden or smallest lumen area combined with fewer collateral vessels is associated with a faster decline in walking velocity but not walking endurance. Together, this information may be helpful for future trials attempting to improve walking performance by increasing angiogenesis in people with PAD.
This study has limitations. First, we imaged a short segment of the SFA. We did not image atherosclerotic plaque in the aorto-iliac or femoro-popliteal arterial segments. Associations of plaque burden and lumen area with functional decline may have been more robust if we had imaged additional segments of the lower extremity arterial tree. Second, our collateral vessel data are limited to those who were eligible for and consented to MRA. Our findings regarding collateral vessels may not be generalizable to individuals who did not undergo MRA. Third, MRA has lower spatial resolution than computed tomographic angiography or digital subtraction angiography. Some collateral vessels may be too small for identification on MRA.32 Fourth, we did not measure step length or cadence during the 4-meter walk or 6-minute walk. Fifth, we cannot rule out the possibility that severity of leg symptoms, exercise behavior, physical activity, or other unmeasured confounders may explain associations reported here. However, additionally adjusting our analyses for leg symptoms and physical activity did not significantly alter our findings.
In conclusion, PAD participants with greater plaque burden or smaller lumen area in the superficial femoral artery combined with less numerous collateral vessels or lower collateral grade have faster rates of decline in usual and fastest-paced 4-meter walking velocity. Further study is needed to identify whether interventions that simultaneously reduce plaque burden and increase collateral vessel number and size can prevent functional decline or improve functional performance in people with PAD.
Acknowledgments
Funding
Supported by R01-HL083064 and R01-HL109244.
Footnotes
Declaration of conflicting interest
Dr Chun Yuan receives research support from Philips Medical and VP Diagnostics and serves as a consultant for ImagePace LLC (through 6/2013), Bristol Myers Squibb Medical Imaging, and Boehringer Ingelheim. Dr Christopher Kramer receives research support from Siemens Healthcare and Novartis. Dr Kibbe serves on the Critical Limb Ischemia Advisory Committee for Baxter Company.
References
- 1.Schoop W. Limb collaterals. In: Schaper W, Schaper J, editors. Collateral Circulation: Heart, Brain, Kidneys, Limbs. Boston, MA: Kluwer Academic Publishers; 1993. pp. 317–327. [Google Scholar]
- 2.Ziegler MA, Distasi MR, Bills RG, et al. Marvels, mysteries, and misconceptions of vascular compensation to peripheral artery occlusion. Microcirculation. 2010;17:3–20. doi: 10.1111/j.1549-8719.2010.00008.x. [DOI] [PMC free article] [PubMed] [Google Scholar]
- 3.Prior BM, Lloyd PG, Ren J, Li H, Laughlin MH, Terjung RL. Time course of changes in collateral blood flow and isolated vessel size and gene expression after femoral artery occlusion in rats. Am J Physiol Heart Circ Physiol. 2004;287:H2434–H2447. doi: 10.1152/ajpheart.00398.2004. [DOI] [PubMed] [Google Scholar]
- 4.McDermott MM, Liu K, Greenland P, et al. Functional decline in peripheral arterial disease: associations with the ankle brachial index and leg symptoms. JAMA. 2004;292:453–461. doi: 10.1001/jama.292.4.453. [DOI] [PubMed] [Google Scholar]
- 5.McDermott MM, Guralnik JM, Tian L, et al. Associations of borderline and low normal ankle–brachial index values with functional decline at 5-year follow-up: the WALCS (Walking and Leg Circulation Study) J Am Coll Cardiol. 2009;53:1056–1062. doi: 10.1016/j.jacc.2008.09.063. [DOI] [PMC free article] [PubMed] [Google Scholar]
- 6.Keeling AN, Carroll TJ, McDermott MM, et al. Clinical correlates of size and number of collateral vessels in peripheral arterial disease. Vasc Med. 2012;17:223–230. doi: 10.1177/1358863X12446213. [DOI] [PMC free article] [PubMed] [Google Scholar]
- 7.McDermott MM, Liu K, Carr J, et al. Superficial femoral artery plaque, the ankle–brachial index, and leg symptoms in peripheral arterial disease: The Walking and Leg Circulation study (WALCS) III. Circ Cardiovasc Imaging. 2011;4:246–252. doi: 10.1161/CIRCIMAGING.110.962183. [DOI] [PMC free article] [PubMed] [Google Scholar]
- 8.Yao ST, Hobbs JT, Irvine WT. Ankle systolic pressure measurements in arterial disease affecting the lower extremities. Br J Surg. 1969;56:676–679. doi: 10.1002/bjs.1800560910. [DOI] [PubMed] [Google Scholar]
- 9.McDermott MM, Liu K, Criqui MH, et al. Ankle–brachial index and subclinical cardiac and carotid disease: the multi-ethnic study of atherosclerosis. Am J Epidemiol. 2005;162:33–41. doi: 10.1093/aje/kwi167. [DOI] [PubMed] [Google Scholar]
- 10.Fowkes FG, Murray GD, Butcher I, et al. Ankle brachial index combined with Framingham Risk Score to predict cardiovascular events and mortality: A meta-analysis. JAMA. 2008;300:197–208. doi: 10.1001/jama.300.2.197. [DOI] [PMC free article] [PubMed] [Google Scholar]
- 11.Heun R, Papassotiropoulos A, Jennssen F. The validity of psychometric instruments for detection of dementia in the elderly general population. Int J Geriatr Psychiatry. 1998;13:368–380. doi: 10.1002/(sici)1099-1166(199806)13:6<368::aid-gps775>3.0.co;2-9. [DOI] [PubMed] [Google Scholar]
- 12.Altman R, Ashe E, Bloch D, et al. Development of criteria for the classification and reporting of osteoarthritis: classification of osteoarthritis of the knee. Arthritis Rheum. 1986;29:1039–1049. doi: 10.1002/art.1780290816. [DOI] [PubMed] [Google Scholar]
- 13.McDermott MM, Criqui MH, Liu K, et al. Lower ankle/brachial index, as calculated by averaging the dorsalis pedis and posterior tibial arterial pressures, and association with leg functioning in peripheral arterial disease. J Vasc Surg. 2000;32:1164–1171. doi: 10.1067/mva.2000.108640. [DOI] [PubMed] [Google Scholar]
- 14.Shadman R, Criqui MH, Bundens WP, et al. Subclavian artery stenosis: prevalence, risk factors, and association with cardiovascular diseases. J Am Coll Cardiol. 2004;44:618–623. doi: 10.1016/j.jacc.2004.04.044. [DOI] [PubMed] [Google Scholar]
- 15.Lindbom A. Arteriosclerosis and arterial thrombosis in the lower limb: A roentgenological study. Acta Radiol Suppl. 1950;80:1–80. [PubMed] [Google Scholar]
- 16.Lim RP, Shapiro M, Wang EY, et al. 3D time-resolved MR angiography (MRA) of the carotid arteries with time-resolved imaging with stochastic trajectories: comparison with 3D contrast-enhanced Bolus-Chase MRA and 3D time-of-flight MRA. AJNR Am J Neuroradiol. 2008;29:1847–1854. doi: 10.3174/ajnr.A1252. [DOI] [PMC free article] [PubMed] [Google Scholar]
- 17.Griswold MA, Jakob PM, Heidemann RM, et al. Generalized autocalibrating partially parallel acquisitions (GRAPPA) Magn Reson Med. 2002;47:1202–1210. doi: 10.1002/mrm.10171. [DOI] [PubMed] [Google Scholar]
- 18.Baumgartner I, Thoeny HC, Kummer O, et al. Leg ischemia: assessment with MR angiography and spectroscopy. Radiology. 2005;234:833–841. doi: 10.1148/radiol.2343031440. [DOI] [PubMed] [Google Scholar]
- 19.Guralnik JM, Ferrucci L, Simonsick E, Salive ME, Wallace RB. Lower extremity function in persons over 70 years as a predictor of subsequent disability. N Engl J Med. 1995;332:556–561. doi: 10.1056/NEJM199503023320902. [DOI] [PMC free article] [PubMed] [Google Scholar]
- 20.Guralnik JM, Fried LP, Simonsick EM, Kasper JD, Lafferty ME. The Women’s Health and Aging Study: Health and social characteristics of older women with disability. Bethesda, MD: National Institute on Aging; 1995. NIH publication No. 95–4009, Appendix E. [Google Scholar]
- 21.Altman R, Alarcon G, Appelrouth D, et al. The American College of Rheumatology criteria for the classification and reporting of osteoarthritis of the hip. Arthritis Rheum. 1991;34:505–514. doi: 10.1002/art.1780340502. [DOI] [PubMed] [Google Scholar]
- 22.Perera S, Mody S, Woodman RC, Studenski SA. Meaningful change and responsiveness in common physical performance measures in older adults. J Am Geriatr Soc. 2006;54:743–749. doi: 10.1111/j.1532-5415.2006.00701.x. [DOI] [PubMed] [Google Scholar]
- 23.McDermott MM, Ferrucci L, Guralnik J, et al. Pathophysiological changes in calf muscle predict mobility loss at 2-year follow-up in men and women with peripheral arterial disease. Circulation. 2009;120:1048–1055. doi: 10.1161/CIRCULATIONAHA.108.842328. [DOI] [PMC free article] [PubMed] [Google Scholar]
- 24.Pipinos II, Judge AR, Zhu Z, et al. Mitochondrial defects and oxidative damage in patients with peripheral arterial disease. Free Radic Biol Med. 2006;41:262–269. doi: 10.1016/j.freeradbiomed.2006.04.003. [DOI] [PubMed] [Google Scholar]
- 25.McDermott MM, Guralnik JM, Tian L, et al. Baseline functional performance predicts the rate of mobility loss in persons with peripheral arterial disease. J Am Coll Cardiol. 2007;50:974–982. doi: 10.1016/j.jacc.2007.05.030. [DOI] [PMC free article] [PubMed] [Google Scholar]
- 26.McDermott MM, Tian L, Liu K, et al. Prognostic value of functional performance for mortality in patients with peripheral artery disease. J Am Coll Cardiol. 2008;51:1482–1489. doi: 10.1016/j.jacc.2007.12.034. [DOI] [PMC free article] [PubMed] [Google Scholar]
- 27.Palmer-Kazen U, Wahlberg E. Arteriogenesis in peripheral arterial disease. Endothelium. 2003;10:225–232. doi: 10.1080/10623320390246360. [DOI] [PubMed] [Google Scholar]
- 28.Rajagopalan S, Olin JW, Young S, et al. Design of the Del-1 for therapeutic angiogenesis trial (DELTA-1), a phase II multicenter, double-blind, placebo-controlled trial of VLTS-589 in subjects with intermittent claudication secondary to peripheral arterial disease. Hum Gene Ther. 2004;15:619–624. doi: 10.1089/104303404323142060. [DOI] [PubMed] [Google Scholar]
- 29.Lederman RJ, Mendelsohn FO, Anderson RD, et al. TRAFFIC Investigators. Therapeutic angiogenesis with recombinant fibroblast growth factor-2 for intermittent claudication (the TRAFFIC study): a randomized trial. Lancet. 2002;359:2053–2058. doi: 10.1016/s0140-6736(02)08937-7. [DOI] [PubMed] [Google Scholar]
- 30.Rajagopalan S, Mohler ER, 3rd, Lederman RJ, et al. Regional angiogenesis with vascular endothelial growth factor in peripheral arterial disease: a phase II randomized, double-blind, controlled study of adenoviral delivery of vascular endothelial growth factor 121 in patients with disabling intermittent claudication. Circulation. 2003;108:1933–1938. doi: 10.1161/01.CIR.0000093398.16124.29. [DOI] [PubMed] [Google Scholar]
- 31.Grossman PM, Mendelsohn F, Henry TD, et al. Results from a phase II multicenter, double-blind placebo-controlled study of Del-1 (VLTS-589) for intermittent claudication in subjects with peripheral arterial disease. Am Heart J. 2007;153:874–880. doi: 10.1016/j.ahj.2007.01.038. [DOI] [PubMed] [Google Scholar]
- 32.Takeshita S, Isshiki T, Mori H, et al. Use of synchrotron radiation microangiography to assess development of small collateral arteries in a rat model of hindlimb ischemia. Circulation. 1997;95:805–808. doi: 10.1161/01.cir.95.4.805. [DOI] [PubMed] [Google Scholar]