Abstract
To explore the potential therapeutic effects of angiotensin(1–7) (Ang(1–7)), an endogenous ligand of the Mas receptor, on streptozotocin-induced diabetic nephropathy, male Wistar rats were randomly divided into two groups: a control group and a diabetic model group. After 12 weeks, the diabetic rats were divided into subgroups for 4-week treatments consisting of no-treatment group, small-, moderate-, and large-dose Ang(1–7) groups, a valsartan group, a large-dose Ang(1–7) plus valsartan group, and an A779 (antagonist of the Mas receptor) group, each with 15 rats. Ang(1–7) improved renal function, attenuated glomeruli sclerosis, oxidative stress, and cell proliferation, decreased the expression of collagen IV, TGF-β1, VEGF, NOX4, p47phox, PKCα, and PKCβ1, and the phosphorylation of Smad3. In the rat mesangial HBZY-1 cell line, Ang(1–7) decreased high-glucose-induced oxidative stress, the proliferation and expression of NOX4, p47phox, and TGF-β1, the phosphorylation of Smad3, collagen IV, and VEGF, and the membrane translocation of PKCα and PKCβ1. A779 blocked the effects of Ang(1–7) both in vivo and in vitro. The effects of large-dose Ang(1–7) alone and in combination with valsartan were superior to valsartan alone, but the combination had no significant synergistic effect compared with Ang(1–7) alone. Thus, Ang(1–7) ameliorated streptozotocin-induced diabetic renal injury. Large-dose treatment was superior to valsartan in reducing oxidative stress and inhibiting TGFβ1/Smad3- and VEGF-mediated pathways.
Keywords: angiotensin(1–7), angiotensin receptor blocker, diabetic nephropathy, extracellular matrix
Diabetic nephropathy (DN) has become the most common cause of end-stage renal disease, and it represents an increasing global public health problem.1, 2 A wealth of evidence indicates that the renin–angiotensin system has a key role in the pathogenesis of DN, and a galaxy of clinical trials have proven that angiotensin-converting enzyme inhibitors and type 1 angiotensin receptor antagonists are effective in attenuating the development of DN.3, 4 These protective effects were originally thought to result from blocking angiotensin II–dependent pathways. However, the recent discovery of a homolog of angiotensin-converting enzyme, ACE2, revealed a new pathway for angiotensin peptide metabolism.5, 6 ACE2 generates angiotensin(1–7) (Ang(1–7)) from angiotensin II5 and has a protective role against DN.7, 8 However, the effect of Ang(1–7), the primary product of ACE2, on DN remains poorly understood.
Ang(1–7) as a heptapeptide is mainly derived from the degradation of angiotensin II by ACE2 in the kidney.9 The concentration of Ang(1–7) was six times higher in the kidney than in plasma,9 suggesting an intrarenal production of Ang(1–7). Consistent with its site of synthesis, Ang(1–7) exerts important effects on renal homeostasis. In proximal tubular cells, Ang(1–7) activates tyrosine phosphatase and inhibits high-glucose-stimulated p38 MAPK, thereby suppressing high-glucose-induced protein synthesis.10 Ang(1–7) attenuates renal vascular dysfunction by alleviating nicotinamide adenine dinucleotide phosphate oxidase (NOX)–mediated oxidative stress in diabetic and hypertensive rats.11 However, a recent study using a moderate dose of Ang(1–7) to treat DN reported no benefit of Ang(1–7) treatment in reducing the levels of serum creatinine and creatinine clearance, or the ratio of kidney weight/body weight (%).12 In another study, an injection of a moderate dose of Ang(1–7) paradoxically accelerated streptozotocin (STZ)-induced diabetic renal injury.13 So far, several important issues remain unsolved. First, whether Ang(1–7) treatment is beneficial or harmful to DN is controversial. Second, the effect of different doses of Ang(1–7) on DN is to be defined. Third, it is unclear whether combined treatment with Ang(1–7) and an angiotensin receptor blocker is superior to either treatment alone for DN. Finally, the possible mechanisms underlying the effect of Ang(1–7) on DN are only poorly understood. To address these critical issues, we hypothesize that Ang(1–7) may ameliorate STZ-induced diabetic renal injury, and the effect of large-dose Ang(1–7) treatment was superior to that of valsartan by reducing oxidative stress induced by nicotinamide adenine dinucleotide phosphate oxidase and protein kinase C (PKC), and by inhibiting tumor growth factor-β1 (TGFβ1)/Smad3 and vascular endothelial growth factor (VEGF) signaling. A number of in vivo and in vitro experiments were designed and performed to validate this hypothesis in this study.
RESULTS
Serum and urine levels of Ang(1–7)
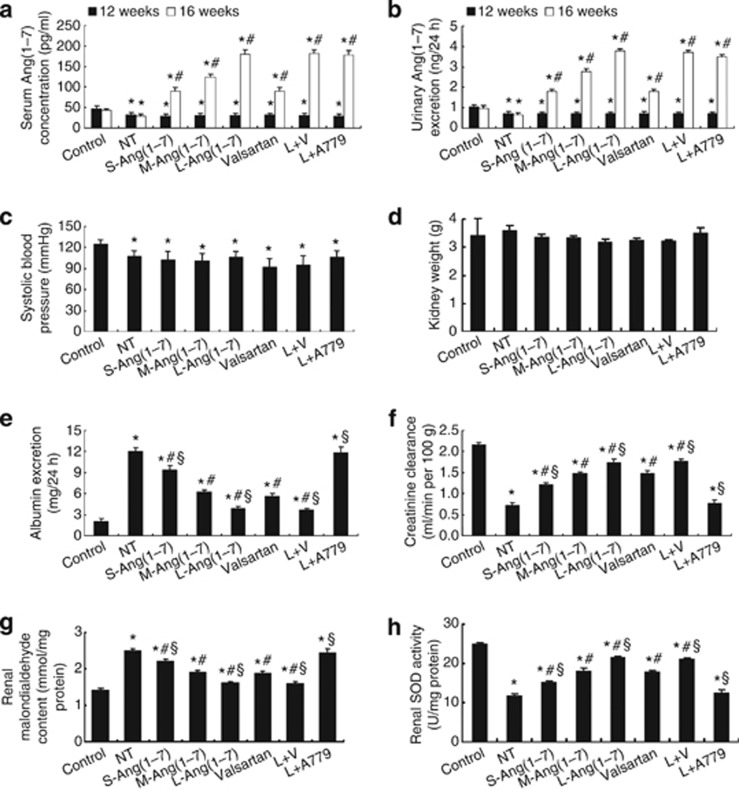
The serum and urinary levels of Ang(1–7) in seven diabetic groups were significantly lower than in the control group before Ang(1–7) treatment, but they were significantly increased in the six treatment groups after treatment (Figure 1a and b).
Figure 1.
Ang(1–7) levels, blood pressure, and renal function in eight groups of rats. (a) Serum levels of Ang(1–7) (n=5 per group). (b) Urinary levels of Ang(1–7) (n=5 per group); *P<0.05 vs. control group at the same time point; #P<0.05 vs. the same group at the end of week 12. (c) Systolic blood pressure. (d) Kidney weight. (e) 24-h urinary albumin. (f) Creatinine clearance. (g) Malondialdehyde content. (h) Superoxide dismutase (SOD) activity. *P<0.05 vs. the control group; #P<0.05 vs. the no-treatment group; §P<0.05 vs. the valsartan group. NT: no treatment; S-Ang(1–7): small-dose Ang(1–7); M-Ang(1–7): moderate-dose Ang(1–7); L-Ang(1–7): large-dose Ang(1–7); L+V: large-dose Ang(1–7)+Valsartan; L+A779: large-dose Ang(1–7)+ A779.
Blood pressure and glucose levels
At the end of the experiment, systolic blood pressure (SBP) was significantly lower in all seven groups of diabetic rats than in the control group of rats, but there was no significant difference in SBP among seven groups of diabetic rats (Figure 1c). The blood glucose levels in all seven diabetic groups were markedly higher than in the control group, but they did not differ among seven diabetic groups (Table 1).
Table 1. Biochemical and pathological measurements in eight groups of rats.
| Groups (n=15 per group) | Blood glucose (mmol/l) | Body weight (g) | KW/BW (mg/g) | 24-h UV (ml) | Plasma creatinine level (μmol/l) |
|---|---|---|---|---|---|
| Control | 3.91±0.90 | 533.20±14.31 | 6.41±1.20 | 33.00±3.00 | 24.00±2.58 |
| NT | 22.43±2.60a | 246.25±6.70a | 14.39±0.81a | 156.33±10.69a | 62.80±2.17a |
| S-Ang(1–7) | 22.96±1.94a | 256.25±4.35a,b,c | 13.11±0.20a,b,c | 108.00±5.29a,b,c | 54.75±2.06a,b,c |
| M-Ang(1–7) | 22.35±1.97a | 276.75±5.38a,b | 12.02±0.12a,b | 78.67±3.51a,b | 46.67±1.53a,b |
| L-Ang(1–7) | 21.76±2.54a | 310.00±7.12a,b,c | 10.25±0.24a,b,c | 56.33±5.03a,b,c | 36.50±2.89a,b,c |
| Valsartan | 22.44±2.55a | 288.43±6.11a,b | 11.12±0.22a,b | 77.67±3.51a,b | 45.75±2.87a,b |
| L+V | 23.23±3.18a | 309.25±10.24a,b,c | 10.49±0.30a,b,c | 56.00±5.29a,b,c | 38.20±2.68a,b,c |
| L+A779 | 23.19±3.12a | 247.00±6.48a,c | 14.18±0.53a,c | 152.00±8.00a,c | 60.40±2.88a,c |
Abbreviations: KW/BW, kidney weight/body weight; L+A779, large-dose Ang(1–7)+A779; L-Ang(1–7), large-dose Ang(1–7); L+V, large-dose Ang(1–7)+valsartan; M-Ang(1–7), moderate-dose Ang(1–7); NT, no treatment; S-Ang(1–7), small-dose Ang(1–7); UV, urinary volume.
P<0.05 vs. the control group.
P<0.05 vs. the no-treatment group.
P<0.05 vs. the valsartan group.
Ang(1–7) dose-dependently ameliorated renal function
At the end of the experiment, kidneys in DM rats without treatment were heavier than those in other groups, but the difference was not statistically significant (Figure 1d). Body weight and creatinine clearance were significantly lower in seven groups of diabetic rats than those in the control group of rats. However, these parameters were dose-dependently increased in all treatment groups of diabetic rats except for the large-dose Ang(1–7)+ A779 group, in which the body weight and creatinine clearance were similar to those in the no-treatment group (Table 1; Figure 1f). The ratio of kidney weight to body weight, 24-h urinary volume, plasma creatinine level, and 24-h urinary albumin excretion were all significantly higher in seven groups of diabetic rats than in the control group of rats (all P<0.05, Table 1; Figure 1e). These values were decreased dose-dependently in all treatment groups of diabetic rats except for the large-dose Ang(1–7)+ A779 group, in which these values returned to the level of the no-treatment group (Table 1, Figure 1e). Compared with the valsartan treatment group, the ratio of kidney weight to body weight, 24-h urinary volume, plasma creatinine level, and 24-h urinary albumin excretion were all significantly decreased, whereas creatinine clearance was significantly increased in the large-dose Ang(1–7) treatment and large-dose Ang(1–7)+ valsartan treatment groups, but these parameters did not differ between the two treatment groups (Table 1; Figure 1e and f).
Ang(1–7) reduced mesangial matrix expansion
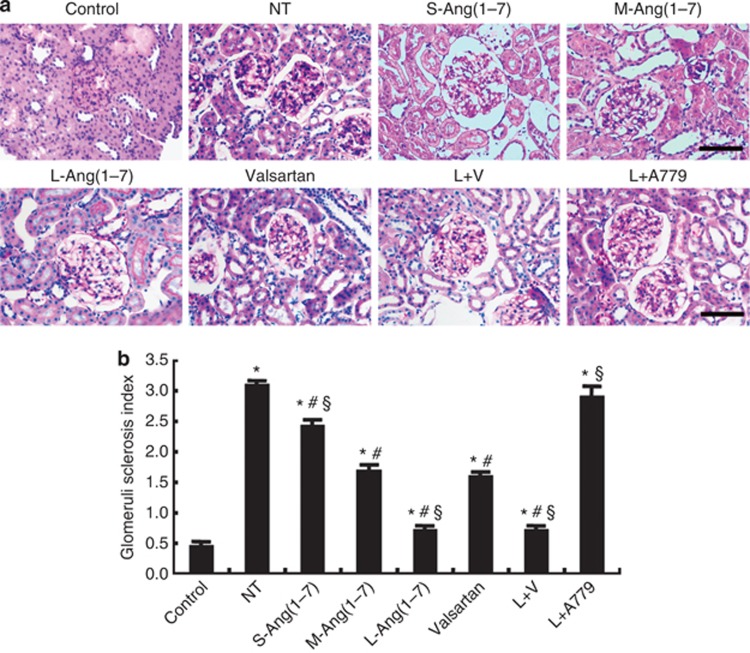
Extracellular matrix deposition was detected by periodic acid–Schiff staining, and glomeruli sclerosis index (GSI) was calculated. GSI was significantly higher in the seven diabetic groups than in the control group (P<0.05, Figure 2). Compared with the no-treatment group, GSI was significantly decreased in the small-, moderate-, and large-dose Ang(1–7) groups, the valsartan group, and the large-dose Ang(1–7)+valsartan group, and the effect of Ang(1–7) on GSI was dose dependent and blocked by A779 treatment (Figure 2). The effect on GSI was similar in the large-dose Ang(1–7) and large-dose Ang(1–7)+valsartan treatment groups, but was greater in these two groups than in the valsartan group (P<0.05, Figure 2).
Figure 2.
Effect of Ang(1–7) and valsartan treatment on mesangial matrix expansion in eight groups of rats. (a) Representative light micrographs of periodic acid–Schiff (PAS) staining. (b) Quantification of glomeruli sclerosis index based on the amount of PAS-positive staining. Bar=50 μm. *P<0.05 vs. the control group; #P<0.05 vs. the no-treatment group; §P<0.05 vs. the valsartan group. NT: no treatment; S-Ang(1–7): small-dose Ang(1–7); M-Ang(1–7): moderate-dose Ang(1–7); L-Ang(1–7): large-dose Ang(1–7); L+V: large-dose Ang(1–7)+valsartan; L+A779: large-dose Ang(1–7)+ A779.
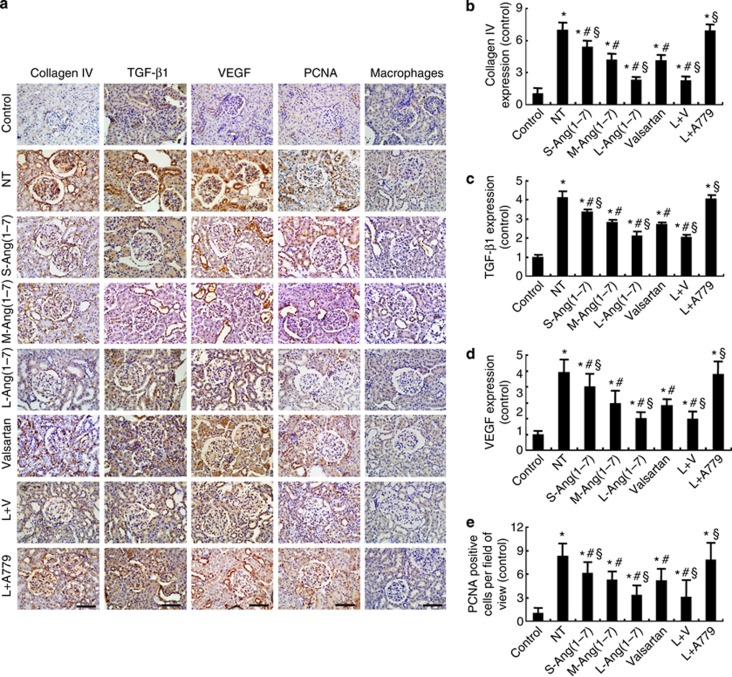
Immunohistochemical staining revealed an increased expression of collagen IV, TGF-β1, VEGF, and proliferating cell nuclear antigen in the glomeruli of the seven diabetic groups (all P<0.05, Figure 3), relative to the control group. However, in comparison with the no-treatment group, the expression levels of collagen IV, TGF-β1, VEGF, and proliferating cell nuclear antigen were substantially decreased in the small-, moderate-, and large-dose Ang(1–7) groups, which was dose dependent and offset by A779 treatment, as well as in the valsartan group and the large-dose Ang(1–7)+valsartan group (Figure 3). These beneficial effects in the large-dose Ang(1–7) group were similar to those in the large-dose Ang(1–7)+valsartan group, but were superior to those in the valsartan group (Figure 3). On the other hand, macrophage infiltration in kidneys, a measure of inflammation, did not differ significantly among the control and seven diabetic groups of rats (P>0.05, Figure 3a).
Figure 3.
Effect of Ang(1–7) and valsartan treatment on the expression of collagen and cytokines in eight groups of rats. (a) Representative immunostaining of collagen IV, tumor growth factor-β1 (TGF-β1), vascular endothelial growth factor (VEGF), proliferating cell nuclear antigen (PCNA), and macrophages. (b) Quantitative analysis of collagen IV expression. (c) Quantitative analysis of TGF-β1 expression. (d) Quantitative analysis of VEGF expression. (e) Quantitative analysis of PCNA staining. Bar=50 μm. *P<0.05 vs. the control group; #P<0.05 vs. the no-treatment group; §P<0.05 vs. the valsartan group. NT: no treatment; S-Ang(1–7): small-dose Ang(1–7); M-Ang(1–7): moderate-dose Ang(1–7); L-Ang(1–7): large-dose Ang(1–7); L+V: large-dose Ang(1–7)+valsartan; L+A779: large-dose Ang(1–7)+ A779.
Ang(1–7) attenuated oxidative stress in DN rats and mesangial cells
To evaluate the effects of Ang(1–7) on oxidative stress in DN, we detected malondialdehyde (MDA) content and superoxide dismutase (SOD) activity in glomeruli. Compared with the control group, MDA content was significantly higher, whereas total SOD activity was significantly lower, in the no-treatment group (P<0.05, Figure 1g and h). In contrast, the level of MDA was markedly lowered, whereas the activity of SOD increased in the small-, moderate-, and large-dose Ang(1–7) groups, large-dose Ang(1–7)+ valsartan group, and valsartan group in comparison with the no-treatment group, with the superior effects being observed in the large-dose Ang(1–7) and large-dose Ang(1–7)+valsartan groups relative to the valsartan group (Figure 1g and h). Again, the salutary effects obtained by large-dose Ang(1–7) treatment were largely blocked by the combined A779 treatment (Figure 1g and h).
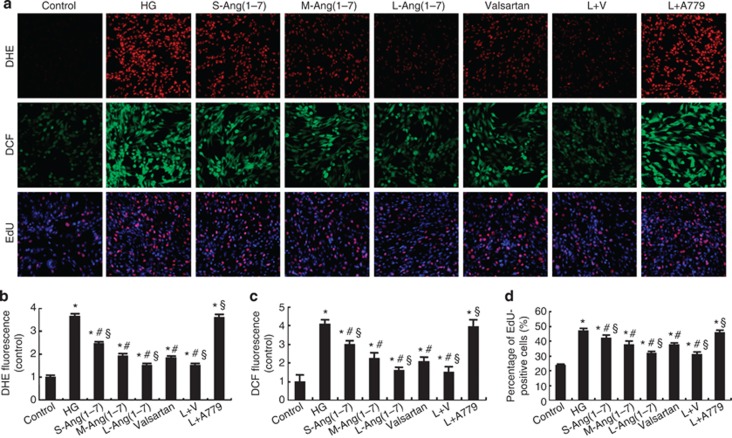
The level of reactive oxygen species (ROS) in glomerular mesangial HBZY-1 cells, as determined by dihydroethidium and dichlorofluorescein staining, was significantly increased after high glucose stimulation (P<0.05, Figure 4a–c). The content of ROS was dose-dependently attenuated by Ang(1–7) treatment, but this effect was virtually offset by combined A779 treatment (P>0.05, Figure 4a–c). Similar to the in vivo effects, large-dose Ang(1–7) treatment alone or in combination with valsartan reduced ROS content to a greater extent than valsartan treatment alone (P<0.05, Figure 4a–c).
Figure 4.
Effect of Ang(1–7) and valsartan treatment on oxidative stress and cell proliferation in HBZY-1 cells. (a) Representative dihydroethidium (DHE), dichlorofluorescein (DCF), and 5-ethynyl-2′-deoxyuridine (EdU) staining in HBZY-1 cells. (b) Quantitative analysis of DHE staining. (c) Quantitative analysis of DCF staining. (d) Quantitative analysis of EdU staining. *P<0.05 vs. the control group; #P<0.05 vs. the high-glucose group; §P<0.05 vs. the valsartan group. HG: high glucose (25 mmol/l); S-Ang(1–7): small-dose Ang(1–7) (50 nmol/l); M-Ang(1–7): moderate-dose Ang(1–7) (100 nmol/l); L-Ang(1–7): large-dose Ang(1–7) (200 nmol/l); valsartan: 10−6 mol/l valsartan; L+V, large-dose Ang(1–7)+valsartan; L+A779, large-dose Ang(1–7)+A779 (200 nmol/l).
Ang(1–7) decreased NOX and PKC expression in DN rats and mesangial cells
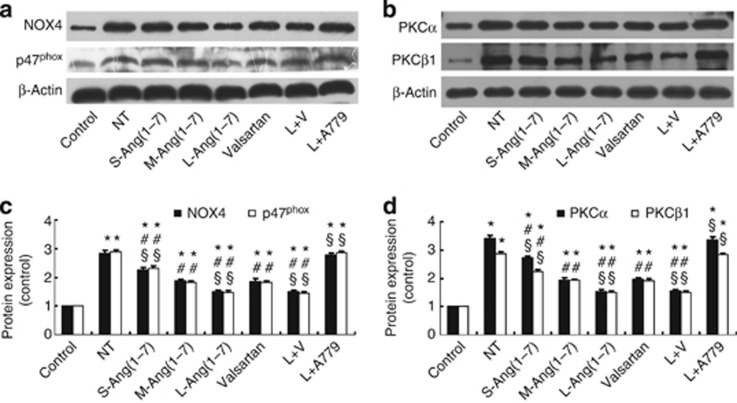
Increased NOX activity and activation of the PKC system in renal tissues have a key role in the development of DN,14 and thus we detected the effect of Ang(1–7) on the protein expression of NOX subunits NOX4 and p47phox and PKC isoforms PKCα and PKCβ1 in glomeruli. The expression of these factors in the no-treatment group was higher than that in the control group, but it was remarkably lower in the small-, moderate-, and large-dose Ang(1–7) groups, the large-dose Ang(1–7)+ valsartan group, and the valsartan group than that in the no-treatment group (all P<0.05, Figure 5). The therapeutic effect of Ang(1–7) was dose dependent and similar in the large-dose Ang(1–7) and large-dose Ang(1–7)+valsartan groups, but it was superior in these two treatment groups to that in the valsartan group (Figure 5). Again, the beneficial effects accomplished by large-dose Ang(1–7) treatment were largely canceled by the combined A779 treatment (Figure 5).
Figure 5.
Effect of Ang(1–7) and valsartan treatment on the expression of nicotinamide adenine dinucleotide phosphate oxidase (NOX) subunits and protein kinase C (PKC) isoforms in eight groups of rats. (a) Western blot analysis of protein expression of NOX4 and p47phox. (b) Western blot analysis of protein expression of PKCα and PKCβ1. (c) Quantitative analysis of a. (d) Quantitative analysis of b. *P<0.05 vs. the control group; #P<0.05 vs. the no-treatment group; §P<0.05 vs. the valsartan group. NT: no treatment; S-Ang(1–7): small-dose Ang(1–7); M-Ang(1–7): moderate-dose Ang(1–7); L-Ang(1–7): large-dose Ang(1–7); L+V: large-dose Ang(1–7)+valsartan; L+A779: large-dose Ang(1–7)+ A779.
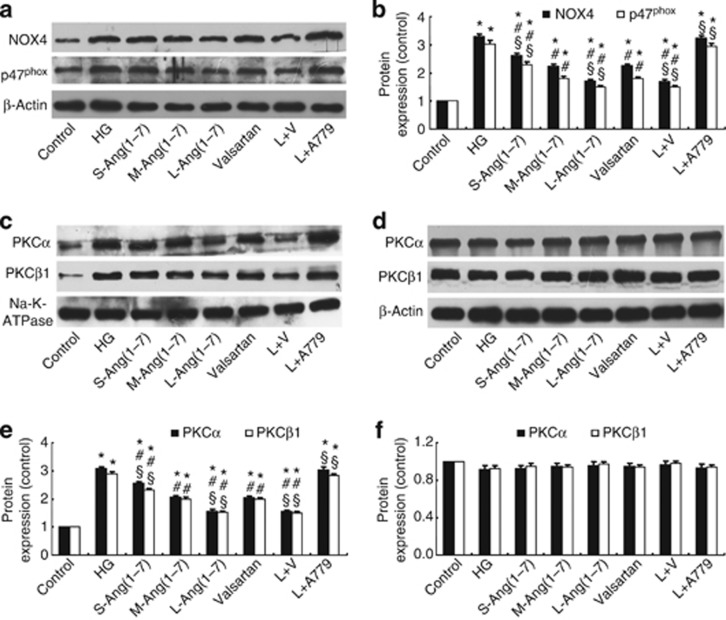
Ang(1–7) dose-dependently attenuated the upregulated expression of NOX4 and p47phox after high glucose stimulation in HBZY-1 cells, and the effect of large-dose Ang(1–7) was similar to the combined treatment with large-dose Ang(1–7) and valsartan but was more prominent than treatment with valsartan alone (Figure 6a and b). In contrast, A779 treatment prevented the effect of Ang (1–7) on the expression of these factors (Figure 6a and b). As membrane translocation of PKCs is an important indicator of PKC activation,15 we measured the protein expression levels of PKCα and PKCβ1 in membrane and cytosolic fractions of HBZY-1 cells. We found that high-concentration glucose stimulation significantly increased the protein levels of PKCα and PKCβ1 in the membrane fraction, which was attenuated by treatment with the small-, moderate-, and large-dose Ang(1–7), valsartan, or large-dose Ang(1–7)+valsartan, and the effect of large-dose Ang(1–7) treatment and combined treatment was similar but was significantly greater than that of valsartan treatment alone (Figure 6c and e). In contrast, A779 treatment prevented the effect of Ang (1–7) on the expression of both factors in the membrane fraction (Figure 6c and e). However, the expression levels of PKCα and PKCβ1 in the cytosolic fraction were not significantly different among eight groups of cells (P>0.05, Figure 6d and f).
Figure 6.
Effect of Ang(1–7) and valsartan treatment on the expression of nicotinamide adenine dinucleotide phosphate oxidase (NOX) subunits and the membrane translocation of protein kinase C (PKC) isoforms in HBZY-1 cells. (a) Western blot analysis of the protein expression of NOX4 and p47phox. (b) Quantitative analysis of a. (c) Western blot analysis of the protein expression of PKCα and PKCβ1 in the membrane fraction. (d) Western blot analysis of the protein expression of PKCα and PKCβ1 in the cytosolic fraction. (e) Quantitative analysis of c. (f) Quantitative analysis of d. *P<0.05 vs. the control group; #P<0.05 vs. the high-concentration glucose group; §P<0.05 vs. the valsartan group. HG: high glucose (25 mmol/l); S-Ang(1–7): small-dose Ang(1–7) (50 nmol/l); M-Ang(1–7): moderate-dose Ang(1–7) (100 nmol/l); L-Ang(1–7): large-dose Ang(1–7) (200 nmol/l); valsartan: 10−6 mol/l valsartan; L+V, large-dose Ang(1–7)+valsartan; L+A779, large-dose Ang(1–7)+A779 (200 nmol/l).
Ang(1–7) inhibited the TGF-β1/Smad3 and VEGF signal pathway and the expression of collagen IV in DN rats and mesangial cells
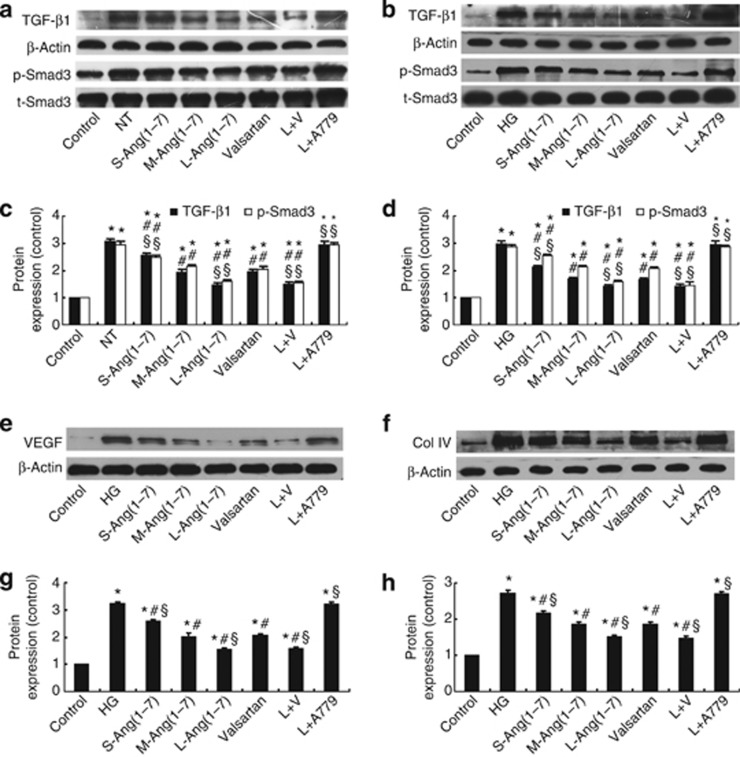
The TGF-β1/Smad3 signal pathway regulates the hypertrophic and prosclerotic changes in diabetic renal injury.16 Large-dose Ang(1–7) treatment alone and in combination with valsartan significantly decreased the expression of TGF-β1 and the phosphorylation levels of Smad3 (p-Smad3) in the glomeruli of DN rats and HBZY-1 cells stimulated by high glucose, and the effect of large-dose Ang(1–7) and large-dose Ang(1–7)+valsartan treatments was superior to that of valsartan treatment alone (all P<0.05, Figure 7a–d). We also examined the effect of Ang(1–7) treatment on the expression of collagen IV and VEGF in DN rats (Figure 3a, b and d) and mesangial cells (Figure 7e–h), which showed similar changes as TGF-β1. Once again, A779 treatment blocked the salutary effect of Ang(1–7) in vivo and in vitro (Figure 3 and 6).
Figure 7.
Effect of Ang(1–7) and valsartan treatment on the expression of collagen and cytokines in rats and HBZY-1 cells. (a) Western blot analysis of the protein expression of tumor growth factor-β1 (TGF-β1) and p-Smad3 in glomeruli. (b) Western blot analysis of the protein expression of TGF-β1 and p-Smad3 in HBZY-1 cells. (c) Quantitative analysis of a. (d) Quantitative analysis of b. (e) Western blot analysis of the protein expression of vascular endothelial growth factor (VEGF) in HBZY-1 cells. (f) Western blot analysis of the protein expression of collagen IV in HBZY-1 cells. (g) Quantitative analysis of e. (h) Quantitative analysis of f. *P<0.05 vs. the control group in vivo or in vitro; #P<0.05 vs. the no-treatment group in vivo or the high-glucose group in vitro; §P<0.05 vs. the valsartan group in vivo or in vitro. Col IV, collagen IV; NT, no treatment; HG, high glucose (25 mmol/l); S-Ang(1–7), small-dose Ang(1–7); M-Ang(1–7), moderate-dose Ang(1–7); L-Ang(1–7), large-dose Ang(1–7); L+V, large-dose Ang(1–7)+valsartan; L+A779, large-dose Ang(1–7)+A779.
Proliferation of glomerular mesangial cells
Mesangial cell proliferation has an essential role in the progression of DN.17 We found that high glucose significantly increased the proliferation of HBZY-1 cells, as detected by 5-ethynyl-2′-deoxyuridine incorporation, whereas treatment with small-, moderate-, and large-dose Ang(1–7), valsartan, and large-dose Ang(1–7)+valsartan markedly decreased the number of proliferating cells. Large-dose Ang(1–7) or large-dose Ang(1–7)+valsartan was more effective than valsartan treatment alone, whereas A779 treatment reversed the inhibitive effect of Ang(1–7) on the proliferation of HBZY-1 cells (Figure 4a and d).
DISCUSSION
In this study, we demonstrated for the first time that in a rat model of DN, Ang(1–7) dose-dependently attenuated the progression of DN, as exhibited by increased creatinine clearance and reduced ratio of kidney weight to body weight, 24-h urinary volume, 24-h urinary albumin excretion, plasma creatinine level, and GSI. In addition, we found that large-dose Ang(1–7) (800 ng/kg min) treatment was more effective in ameliorating renal morphology and function than valsartan treatment, and combined treatment with Ang(1–7) and valsartan provided no more benefits than large-dose Ang(1–7) treatment alone. The mechanism of the Ang(1–7)-mediated effect likely involved attenuated NOX and PKC expression and inhibited TGF-β1/Smad3 and VEGF signaling. Importantly, the beneficial effect of Ang (1–7) treatment was essentially offset by combined A779 treatment, suggesting that the effect of Ang(1–7) treatment was mediated mostly by Mas receptor in the kidney.
In this study, a rat model of diabetes was induced by an intraperitoneal injection of STZ that has been widely used to create diabetes models in rodents with pathological features similar to human diabetes.18 Our results showed that diabetic rats presented with severe hyperglycemia and renal dysfunction manifested as increased plasma creatinine level and 24-h urinary albumin excretion and decreased creatinine clearance, indicating that a DN animal model was successfully established. Interestingly, the kidney weight was similar in diabetic rats without treatment and in normal rats, and the reason may be that at the end of the experiment the mean body weight of the normal rats was more than twofold of that of the diabetic rats without treatment, and thus the kidney weight of normal rats increased accordingly, leading to a similar kidney weight in the two groups. However, the ratio of kidney weight/body weight in diabetic rats without treatment was significantly increased compared with that in normal rats, substantiating the presence of renal hypertrophy in diabetic rats. Previous studies have shown that renin–angiotensin system has a key role in the development of DN,19 and ACE2 overexpression may ameliorate glomerular injury and reduce the progression of DN.8 These studies suggested that the effect of ACE2 on DN may be partly due to increased Ang(1–7) levels, but the direct evidence was lacking to support this notion. Although one study showed the potential of Ang(1–7) to attenuate STZ-induced nephropathy in rats,12 another study reported opposite results.13 Thus, the exact effect of Ang(1–7) on DN remains unclear. Using the current animal model, we found that before treatment the serum and urine levels of Ang(1–7) were lower in all seven groups of diabetic rats than those in the control group of rats, whereas Ang(1–7) treatment dose-dependently increased the serum and urinary levels of Ang(1–7) in these treatment groups of diabetic rats, demonstrating the efficacy of our drug-delivery approach. It is noteworthy that SBP measured at the end of the experiment was significantly lower in all seven groups of diabetic rats than in the control group of rats, which was consistent with our previous study showing that 16 weeks after diabetes was induced in rats the cardiac function was impaired leading to reduced left ventricular ejection fraction and lowered SBP.20 However, there was no significant difference in SBP among seven groups of diabetic rats. A possible explanation was that the impaired cardiac function may lead to a low SBP in diabetic rats, which may blunt the antihypertensive effect of valsartan in these animals. In addition, previous studies found that in animal models of DN, Ang(1–7) and its antagonist A779 exerted no significant effect on blood pressure,21, 22 which was consistent with our findings. These results suggested that the renoprotective effects of Ang(1–7) and valsartan were probably beyond their effects on SBP.23 Furthermore, we found that Ang(1–7) and valsartan treatment had no effect on increased blood glucose levels in diabetic rats, which suggested that the renoprotective effects of Ang(1–7) and valsartan were probably independent of glycemic control and lent support to previous studies.13, 24
Glomerular hypertrophy and mesangial matrix expansion are typical pathological features of DN. We found significantly increased extracellular matrix in the glomeruli of the diabetic rats without treatment as compared with rats of the control group. Consequently, GSI as a measure of glomerular sclerosis and the levels of collagen IV and the number of proliferating cell nuclear antigen-positive cells in the glomeruli were substantially increased in diabetic rats. On the other hand, the enhanced extracellular matrix deposition in glomeruli was dose-dependently attenuated after Ang(1–7) treatment, suggesting that a large dose of Ang(1–7) (800 ng/kg min) is preferable in the treatment of DN. This finding raised questions about previous studies that used much less doses of Ang(1–7) in the treatment of DN.12, 13 It has been shown that renal NOX activity and PKC activation were classic pathways mediating extracellular matrix expansion in DN.14 A previous study reported that ACE2 decreased NOX activity and PKC expression possibly by increasing renal Ang-(1–7) level.7 In addition, Ang(1–7) could attenuate Ang II–mediated NOX activation in vivo and in vitro.11, 21 In our study, the levels of NOX4, p47phox, PKCα, and PKCβ1 were significantly increased in the glomeruli of diabetic rats without treatment relative to the control group of rats. Accordingly, the content of MDA, a product of ROS, was significantly increased, whereas total SOD activity was substantially decreased in the kidney of diabetic rats without treatment. All these changes were attenuated after Ang(1–7) treatment. A previous study reported a downregulation of the renal SOD activity by NOXs,25 which may explain why the renal SOD activity was declined in the no-treatment group and why it was largely normalized in the large-dose Ang 1–7 group. In the in vitro experiment, the level of ROS and proliferation of HBZY-1 cells were significantly increased after high-concentration glucose stimulation, but they were markedly decreased after Ang(1–7) treatment. The expression levels of NOX subunits in vitro showed similar changes after Ang(1–7) treatment. In addition, we examined the membrane translocation of PKCα and PKCβ1 as a marker of their activation.15 We found that high-concentration glucose stimulation significantly increased the translocation of PKCα and PKCβ1, and Ang(1–7) dose-dependently suppressed this effect. Thus, a major mechanism underlying Ang(1–7)-induced therapeutic effect on DN may involve suppressed oxidative stress regulated by NOX and PKC signaling.
Increasing evidence indicates that TGF-β1 promotes the progression of renal fibrosis and acts as a major mediator of the hypertrophic and prosclerotic changes in DN.26 Smad3 is a critical downstream mediator of TGF-β1 in the process of renal fibrosis,27 and VEGF participates in the development of podocytopathy and albuminuria in DN.28 The effect of Ang-(1–7) on TGF-β1/Smad3 and VEGF signaling in kidney remains in dispute.10, 13 In the current study, we examined the changes of TGF-β1/Smad3 and VEGF expression in DN rats and HBZY-1 cells. In both in vivo and in vitro experiments, the expression levels of TGF-β1, VEGF, and the phosphorylation levels of Smad3 were increased in DN rats and high-glucose-stimulated cells, which were suppressed by Ang(1–7) treatment. These results were in accordance with previous reports of the effects of Ang(1–7) on the same signaling pathways in other disease statuses.29, 30 Thus, suppressed TGF-β1/Smad3 and VEGF signal pathway may underscore another mechanism of Ang(1–7)-mediated effects on renal fibrosis and albuminura in DN.
To clarify the working receptor through which Ang(1–7) takes effect, we used combined treatment with Ang(1–7) and A779, a specific antagonist of Mas receptor, and found that A779 almost completely blocked the effect of Ang(1–7) both in vivo and in vitro, suggesting that the therapeutic effect of Ang(1–7) was via its Mas receptor. This finding was in accordance with a previous study that used Mas-knockout mice to study the effect of the Mas receptor on renal morphology and function.31
An important finding of this study was that after treatment for 4 weeks, Ang(1–7) dose-dependently ameliorated the renal morphology and function in diabetic rats, and the therapeutic effect of large-dose (800 ng/kg min) Ang(1–7) was superior to that of valsartan treatment. In line with these therapeutic effects, Ang(1–7) treatment attenuated NOX and PKC expression and inhibited TGF-β1/Smad3 and VEGF signaling more effectively than valsartan treatment. In addition, no detrimental effects of Ang(1–7) treatment on the major organs of our diabetic rats were observed. However, the combination of large-dose Ang(1–7) and valsartan treatment did not provide additional benefit. These results suggest that large-dose Ang(1–7) may offer a more potent therapeutic armament than angiotensin receptor blocker, whereas combined treatment of Ang(1–7) and an angiotensin receptor blocker provides no additive or synergistic effects.
In conclusion, Ang(1–7) dose-dependently ameliorated STZ-induced diabetic renal injury, and the renoprotective effect of large-dose Ang(1–7) treatment was superior to valsartan treatment. The combined treatment of Ang(1–7) and valsartan had no additive or synergistic effects. The possible mechanisms of Ang(1–7)-mediated effects involved reduced renal oxidative stress regulated by NOXs and PKCs, and inhibited TGF-β1/Smad3 and VEGF signaling.
MATERIALS AND METHODS
Experimental animals and protocol
Male Wistar rats (10 weeks old, 200–250 g) were purchased from the Animal Center of the Shandong University School of Medicine and had free access to standard rat chow and water throughout the study. All procedures were in accordance with the Guide for Care and Use of Laboratory Animals of Shandong University (Jinan, China). After acclimatization to the environment for 5 days, 120 rats were randomly divided into two groups: a control group (n=15) that received an intraperitoneal injection of normal saline, and a diabetic group (n=105) that received intraperitoneal injection of 65 mg/kg STZ dissolved in sodium citrate buffer (pH 4.5). The status of diabetes in rats was confirmed by a tail-blood glucose level higher than 16.7 mmol/l 48 h after STZ injection.32 All diabetic rats received an intraperitoneal injection of insulin (2–3 U) every 3 days to maintain blood glucose levels between 16.7 and 25 mmol/l in order to prevent rat death induced by excessively high blood glucose levels. Twelve weeks after STZ injection, diabetic rats were further randomly divided into seven treatment groups (n=15 per group): no-treatment group; large-dose, moderate-dose, and small-dose Ang(1–7) groups that received a subcutaneous injection of 800, 400, and 200 ng/kg min of Ang(1–7), respectively, by an embedded mini-osmotic pump; valsartan group that received an intragastric valsartan at a dose of 30 mg/kg per day; large-dose Ang(1–7)+valsartan (30 mg/kg per day) group; and large-dose Ang(1–7)+A779 (800 ng/kg min) group. After treatment for 4 weeks, all rats were killed.
Serum and urinary levels of Ang(1–7)
The levels of Ang-(1–7) in serum and urine were assayed by enzyme-linked immunosorbent assay (see Supplementary Materials online for details).
Biochemical and blood pressure measurements
Blood glucose, SBP, kidney and body weight, 24-h urine volume, creatinine, and creatinine clearance, as well as 24-h urinary albumin, were determined in all rats (see Supplementary Materials online for details).
Renal MDA content and SOD activity levels
The level of MDA and the activity of SOD in glomeruli were measured in all rat groups (see Supplementary Materials online for details).
Tissue preparation and histology
Periodic acid–Schiff staining was performed and GSI was calculated in all rats (see Supplementary Materials online for details).
Immunohistochemistry
Immumohistochemical staining was performed to detect the expression of collagen IV, TGFβ1, VEGF, proliferating cell nuclear antigen, and macrophages in glomeruli (see Supplementary Materials online for details).
Cell culture and treatment
Rat glomerular mesangial HBZY-1 cells were purchased from the China Center for Type Culture Collection and cultured in Dulbecco's modified Eagle's medium supplemented with 10% fetal bovine serum, 100 U/ml penicillin, and 100 μg/ml streptomycin at 37 °C in 95% air and 5% CO2. Cells plated on 60-mm dishes were cultured to 90% confluence and divided into eight groups: control group, in which cells were incubated in 5 mmol/l D-glucose DMEM, and 20 mmol/l D-mannitol was added to the medium in order to take into the account of the effect of high osmolarity in other cell groups; no-treatment group, in which cells were stimulated with a high concentration of glucose (25 mmol/l) only for 24 h; small-, moderate-, and large-dose Ang(1–7) groups, in which cells were pretreated with 50, 100, and 200 nmol/l Ang(1–7) for 1 h, respectively; valsartan group, in which cells were pretreated with 10−6 mol/l valsartan for 1 h; large-dose Ang(1–7)+ valsartan group, in which cells were pretreated with 200 nmol/l Ang(1–7)+10−6 mol/l valsartan for 1 h; and large-dose Ang(1–7)+ A779 group, in which cells were pretreated with 200 nmol/l A779 for 30 min and then with 200 nmol/l Ang(1–7) for 1 h. All cells in the six treatment groups received stimulation with a high concentration of glucose (25 mmol/l) for 24 h after treatment. Finally, cell protein was extracted for western blot analysis, and primary antibodies used were the same as those in experiments in vivo except for mouse monoclonal anti-VEGF and rabbit polyclonal anti-collagen IV (both 1:1000, Abcam, Cambridge, UK).
Dihydroethidium and dichlorofluorescein staining and the 5-ethynyl-2′-deoxyuridine proliferation assay
Dihydroethidium staining, dichlorofluorescein staining, and the 5-ethynyl-2′-deoxyuridine proliferation assay were performed in all rats (see Supplementary Materials online for details).
Membrane and cytosolic extraction in HBZY-1 cells
Membrane and cytosolic fractions were extracted from cells using the membrane protein extraction kit (Thermoscientific, Rockford, IL, USA) (see Supplementary Materials online for details).
Western blot analysis
Western blot analysis was performed to detect the expression levels of NOX2, p47phox, PKCα, PKCβ1, Na+-K+-ATPase, TGF-β1, p-Smad3, t-Smad3, VEGF, and collagen IV (see Supplementary Materials online for details).
Statistical analysis
Statistical analysis involved SPSS for Windows v13.0 (SPSS, Chicago, IL, USA). Data are expressed as mean±s.d. Differences were compared by one-way analysis of variance P<0.05 was considered statistically significant.
Acknowledgments
This work was supported by research grants from National 973 Basic Research Program (No. 2011CB503906, 2012CB518603, 2013CB530703), National High-tech Research and Development Program of China (No. 2012AA02A510), Program of Introducing Talents of Discipline to Universities (No. B07035), the State Program of National Natural Science Foundation of China for Innovative Research Group (No. 81321061), International Collaboration and Exchange Program of China (No. 81320108004) and the State Key Program of National Natural Science of China (No. 61331001), and grants of the National Natural Science Foundation of China (No. 81100207, 81173251, 81100102, 81270350, 81000126, 81000127, 81300234).
All the authors declared no competing interests.
Footnotes
SUPPLEMENTARY MATERIAL
Figure S1. Magnification of representative light micrographs of periodic acid-Schiff (PAS) staining in Figure 2.
Figure S2. Magnification of representative immunohistochemical staining of collagen IV, TGF-β1, VEGF, PCNA and macrophages in Figure 3.
Supplementary material is linked to the online version of the paper at http://www.nature.com/ki
Supplementary Material
References
- Caramori ML, Mauer M. Diabetes and nephropathy. Curr Opin Nephrol Hypertens. 2003;12:273–282. doi: 10.1097/00041552-200305000-00008. [DOI] [PubMed] [Google Scholar]
- Levey AS, Atkins R, Coresh J, et al. Chronic kidney disease as a global public health problem: approaches and initiatives—a position statement from Kidney Disease Improving Global Outcomes. Kidney Int. 2007;72:247–259. doi: 10.1038/sj.ki.5002343. [DOI] [PubMed] [Google Scholar]
- Lewis EJ, Hunsicker LG, Bain RP, et al. The effect of angiotensin-converting-enzyme inhibition on diabetic nephropathy. The Collaborative Study Group. N Engl J Med. 1993;329:1456–1462. doi: 10.1056/NEJM199311113292004. [DOI] [PubMed] [Google Scholar]
- Hollenberg NK, Raij L. Angiotensin-converting enzyme inhibition and renal protection. An assessment of implications for therapy. Arch Intern Med. 1993;153:2426–2435. [PubMed] [Google Scholar]
- Burrell LM, Johnston CI, Tikellis C, et al. ACE2, a new regulator of the renin-angiotensin system. Trends Endocrinol Metab. 2004;15:166–169. doi: 10.1016/j.tem.2004.03.001. [DOI] [PMC free article] [PubMed] [Google Scholar]
- Hamming I, Cooper ME, Haagmans BL, et al. The emerging role of ACE2 in physiology and disease. J Pathol. 2007;212:1–11. doi: 10.1002/path.2162. [DOI] [PMC free article] [PubMed] [Google Scholar]
- Oudit GY, Liu GC, Zhong J, et al. Human recombinant ACE2 reduces the progression of diabetic nephropathy. Diabetes. 2010;59:529–538. doi: 10.2337/db09-1218. [DOI] [PMC free article] [PubMed] [Google Scholar]
- Liu CX, Hu Q, Wang Y, et al. Angiotensin-converting enzyme (ACE) 2 overexpression ameliorates glomerular injury in a rat model of diabetic nephropathy: a comparison with ACE inhibition. Mol Med. 2011;17:59–69. doi: 10.2119/molmed.2010.00111. [DOI] [PMC free article] [PubMed] [Google Scholar]
- Campbell DJ, Lawrence AC, Towrie A, et al. Differential regulation of angiotensin peptide levels in plasma and kidney of the rat. Hypertension. 1991;18:763–773. doi: 10.1161/01.hyp.18.6.763. [DOI] [PubMed] [Google Scholar]
- Gava E, Samad-Zadeh A, Zimpelmann J, et al. Angiotensin-(1-7) activates a tyrosine phosphatase and inhibits glucose-induced signalling in proximal tubular cells. Nephrol Dial Transplant. 2009;24:1766–1773. doi: 10.1093/ndt/gfn736. [DOI] [PMC free article] [PubMed] [Google Scholar]
- Benter IF, Yousif MH, Dhaunsi GS, et al. Angiotensin-(1-7) prevents activation of NADPH oxidase and renal vascular dysfunction in diabetic hypertensive rats. Am J Nephrol. 2008;28:25–33. doi: 10.1159/000108758. [DOI] [PubMed] [Google Scholar]
- Singh T, Singh K, Sharma PL. Ameliorative potential of angiotensin1-7/Mas receptor axis in streptozotocin-induced diabetic nephropathy in rats. Methods Find Exp Clin Pharmacol. 2010;32:19–25. doi: 10.1358/mf.2010.32.1.1434160. [DOI] [PubMed] [Google Scholar]
- Shao Y, He M, Zhou L, et al. Chronic angiotensin (1-7) injection accelerates STZ-induced diabetic renal injury. Acta Pharmacol Sin. 2008;29:829–837. doi: 10.1111/j.1745-7254.2008.00812.x. [DOI] [PubMed] [Google Scholar]
- Thallas-Bonke V, Thorpe SR, Coughlan MT, et al. Inhibition of NADPH oxidase prevents advanced glycation end product-mediated damage in diabetic nephropathy through a protein kinase C-alpha-dependent pathway. Diabetes. 2008;57:460–469. doi: 10.2337/db07-1119. [DOI] [PubMed] [Google Scholar]
- Kraft AS, Anderson WB. Phorbol esters increase the amount of Ca2+, phospholipid-dependent protein kinase associated with plasma membrane. Nature. 1983;301:621–623. doi: 10.1038/301621a0. [DOI] [PubMed] [Google Scholar]
- Lan HY, Chung AC. TGF-beta/Smad signaling in kidney disease. Semin Nephrol. 2012;32:236–243. doi: 10.1016/j.semnephrol.2012.04.002. [DOI] [PubMed] [Google Scholar]
- Cove-Smith A, Hendry BM. The regulation of mesangial cell proliferation. Nephron Exp Nephrol. 2008;108:e74–e79. doi: 10.1159/000127359. [DOI] [PubMed] [Google Scholar]
- Tesch GH, Allen TJ. Rodent models of streptozotocin-induced diabetic nephropathy. Nephrology (Carlton) 2007;12:261–266. doi: 10.1111/j.1440-1797.2007.00796.x. [DOI] [PubMed] [Google Scholar]
- Cooper ME. Pathogenesis, prevention, and treatment of diabetic nephropathy. Lancet. 1998;352:213–219. doi: 10.1016/S0140-6736(98)01346-4. [DOI] [PubMed] [Google Scholar]
- Dong B, Yu QT, Dai HY, et al. Angiotensin-converting enzyme-2 overexpression improves left ventricular remodeling and function in a rat model of diabetic cardiomyopathy. J Am Coll Cardiol. 2012;59:739–747. doi: 10.1016/j.jacc.2011.09.071. [DOI] [PubMed] [Google Scholar]
- Moon JY, Tanimoto M, Gohda T, et al. Attenuating effect of angiotensin-(1-7) on angiotensin II-mediated NAD(P)H oxidase activation in type 2 diabetic nephropathy of KK-A(y)/Ta mice. Am J Physiol Renal Physiol. 2011;300:F1271–F1282. doi: 10.1152/ajprenal.00065.2010. [DOI] [PubMed] [Google Scholar]
- Dhaunsi GS, Yousif MH, Akhtar S, et al. Angiotensin-(1-7) prevents diabetes-induced attenuation in PPAR-gamma and catalase activities. Eur J Pharmacol. 2010;638:108–114. doi: 10.1016/j.ejphar.2010.04.030. [DOI] [PMC free article] [PubMed] [Google Scholar]
- Lewis EJ, Lewis JB. Treatment of diabetic nephropathy with angiotensin II receptor antagonist. Clin Exp Nephrol. 2003;7:1–8. doi: 10.1007/s101570300000. [DOI] [PubMed] [Google Scholar]
- Cheng ZJ, Vaskonen T, Tikkanen I, et al. Endothelial dysfunction and salt-sensitive hypertension in spontaneously diabetic Goto-Kakizaki rats. Hypertension. 2001;37:433–439. doi: 10.1161/01.hyp.37.2.433. [DOI] [PubMed] [Google Scholar]
- Fujita H, Fujishima H, Morii T, et al. Modulation of renal superoxide dismutase by telmisartan therapy in C57BL/6-Ins2(Akita) diabetic mice. Hypertens Res. 2012;35:213–220. doi: 10.1038/hr.2011.176. [DOI] [PMC free article] [PubMed] [Google Scholar]
- Bottinger EP. TGF-beta in renal injury and disease. Semin Nephrol. 2007;27:309–320. doi: 10.1016/j.semnephrol.2007.02.009. [DOI] [PubMed] [Google Scholar]
- Isono M, Chen S, Hong SW, et al. Smad pathway is activated in the diabetic mouse kidney and Smad3 mediates TGF-beta-induced fibronectin in mesangial cells. Biochem Biophys Res Commun. 2002;296:1356–1365. doi: 10.1016/s0006-291x(02)02084-3. [DOI] [PubMed] [Google Scholar]
- Wolf G, Chen S, Ziyadeh FN. From the periphery of the glomerular capillary wall toward the center of disease: podocyte injury comes of age in diabetic nephropathy. Diabetes. 2005;54:1626–1634. doi: 10.2337/diabetes.54.6.1626. [DOI] [PubMed] [Google Scholar]
- Lubel JS, Herath CB, Tchongue J, et al. Angiotensin-(1-7), an alternative metabolite of the renin-angiotensin system, is up-regulated in human liver disease and has antifibrotic activity in the bile-duct-ligated rat. Clin Sci (Lond) 2009;117:375–386. doi: 10.1042/CS20080647. [DOI] [PubMed] [Google Scholar]
- Soto-Pantoja DR, Menon J, Gallagher PE, et al. Angiotensin-(1-7) inhibits tumor angiogenesis in human lung cancer xenografts with a reduction in vascular endothelial growth factor. Mol Cancer Ther. 2009;8:1676–1683. doi: 10.1158/1535-7163.MCT-09-0161. [DOI] [PMC free article] [PubMed] [Google Scholar]
- Pinheiro SV, Ferreira AJ, Kitten GT, et al. Genetic deletion of the angiotensin-(1-7) receptor Mas leads to glomerular hyperfiltration and microalbuminuria. Kidney Int. 2009;75:1184–1193. doi: 10.1038/ki.2009.61. [DOI] [PubMed] [Google Scholar]
- Zheng M, Ye S, Zhai Z, et al. Rosiglitazone protects diabetic rats against kidney disease through the suppression of renal moncyte chemoattractant protein-1 expression. J Diabetes Complications. 2009;23:124–129. doi: 10.1016/j.jdiacomp.2007.11.012. [DOI] [PubMed] [Google Scholar]
Associated Data
This section collects any data citations, data availability statements, or supplementary materials included in this article.


