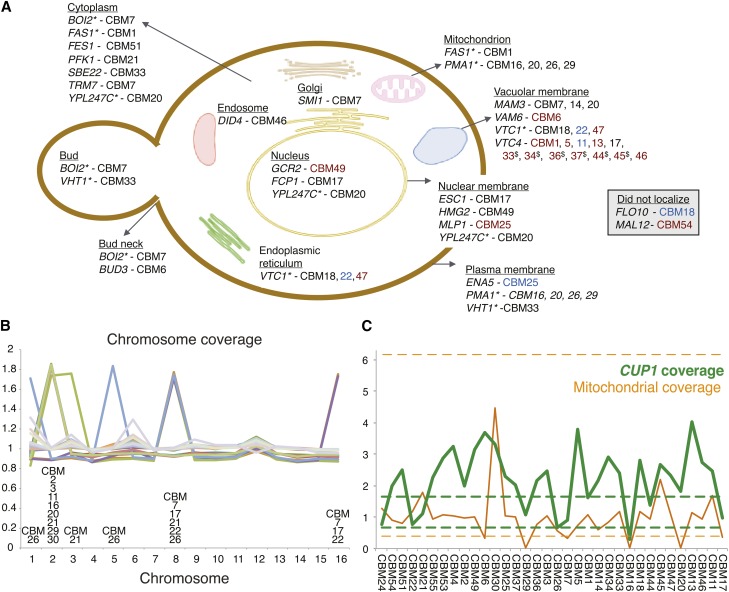
Figure 1.
Observed mutations in copper-adaptation lines. (A) Genes mutated within the CBM lines (see Table 1 for specific mutations) illustrated based on previous localization studies of the genes involved (based on cellular component information curated at the Yeast Resource Center, http://www.yeastrc.org). The color of line names reflects the type of mutation: black for a nonsynonymous amino acid change, red for a premature stop codon, and blue for an indel or rearrangement (synonymous changes and RNA genes not shown). Genes that localized to more than one location are listed multiply and identified by “*.” CBM lines 33, 34, 36, 37, and 45 contained the same VTC4 mutation, indicated by “$.” (B) Chromosomal coverage. Aneuploidy was prevalent, appearing in 12 of 34 lines. Coverage is determined by the average number of reads across the chromosome, compared to the reference strain. (C) CUP1 copy number (green line) and mitochondrial coverage (orange line) for each CBM line. CUP1 copy number is measured relative to the average level observed in our parallel nystatin study, which showed negligible variation in copy number (range of the 35 BMN lines shown as dashed green lines). Mitochondrial depth of coverage in the CBM lines was divided by 10 and is presented relative to the average depth of coverage from mapped nuclear DNA (the equivalent range for the 35 BMN lines shown as dashed orange lines). Lines are ordered according to increasing copper tolerance (Figure 2).

