

Abstract
Background
We have recently investigated effects of hormone replacement therapy on the serum proteome, and found a high proportion of proteins with altered levels associated with oral estrogen and/or estrogen + progesterone treatment. Given this finding, we have investigated the extent to which exposure to hormone replacement therapy (HRT) may have a confounding effect in the assessment of circulating proteins as cancer biomarkers.
Methods
We utilize mass spectrometry data collected from the HRT serum proteome studies to estimate the overall effect of post-menopausal hormone therapy on candidate ovarian cancer biomarkers that have been previously reported.
Results
Levels of approximately half of the proteins reported as potential ovarian cancer biomarkers were found to be affected by HRT. The impact of HRT on levels of insulin-like growth factor and inhibin protein families was found to be substantial.
Conclusions
We conclude that the potential confounding effect of HRT and other types of exposures should be taken into consideration in cancer biomarker study design.
Impact
Hormone replacement therapy significantly affects the serum proteome and should be taken into account as part of biomarker study design and data analysis.
Introduction
The serum/plasma proteome is a major compartment for diagnostics that informs about the state of health of most tissues and organs through biomarker interrogation. However, there are numerous challenges associated with studying alterations in the serum/plasma proteome in relation to diseases such as cancer, in part due to exogenous factors that can alter protein levels even if issues related to sample collection, processing, and storage that can affect protein stability and levels are minimized. Recently we applied in-depth quantitative proteomics to determine the effects of post-menopausal hormone replacement therapy with estrogen and estrogen + progesterone on the serum proteome (1, 2). Using serum collections from the Women’s Health Initiative (WHI) randomized trials, large scale proteomic analyses were performed to compare proteins levels in serum collected from women at baseline and one year after HRT. Ten experiments were performed comparing the serum proteome of women at baseline and one year after the administration of oral estrogen or estrogen plus progesterone therapy (1, 2). Baseline to one year post HRT ratios and associated p-values were computed for 382 proteins. 144 proteins had p-value < 0.05, compared to approximately 19 expected by chance. Thus, 44% of quantified proteins showed evidence of change in concentration between baseline and one year of treatment with estrogen and/or estrogen plus progesterone. Given the profound effect of HRT on the serum proteome, we investigated the potential for a confounding effect of this single exposure on candidate cancer markers. Specifically, we examined the extent to which potential ovarian cancer markers previously described may be affected by HRT.
Results
We compiled a list of proteins reported in the literature since 2007 that have been suggested as potential markers for ovarian cancer and that have been assayed in blood (3-19). More than 60 such proteins have been reported as potentially useful for ovarian cancer detection. However no single candidate marker has matched the performance of CA125. Data was available for 40 candidate ovarian cancer biomarkers with respect to effects of postmenopausal hormone therapy on their circulating levels (Table 1). 90% of the proteins in Table 1 are secreted, whereas ALCAM, CD14, VASN, and VCAM1 are membrane-associated proteins that may be released into the circulation through shedding. The effect of HRT was computed from ten experiments comparing levels of circulating proteins at baseline and one year after the administration of HRT (1, 2). The p-values in Table 1 were calculated using a t-test across the ten experiments to determine statistical significance of change in protein level with HRT. 52.5% (21/40) of the proteins with HRT data showed significant (p<0.05) changes in their serum concentration with HRT. Nine exhibited increased levels and ten proteins exhibited decreased levels with HRT. Interestingly, four proteins (GRN, LCN2, MMP2, and VCAM1) contained palindromic estrogen response elements in their gene sequence that are conserved between mouse and human (20). However, none of these four proteins had significantly altered serum levels with HRT, suggesting that most of the changes in protein levels observed were as a result of secondary effects of HRT as previously noted for most of the proteins affected by HRT in our initial studies (1, 2).
Table 1.
Proteins in the literature (since 2007) that have been assayed in plasma/serum from ovarian cancer patients and have known ratios of one year hormone therapy compared to baseline.
| Protein | Log2 Ratio (1-Year HT/Baseline) | P-Value | Reference(s) |
|---|---|---|---|
| AFM | 0.13 | 0.0032 | (5, 7) |
| ALCAM | 0.02 | 0.50 | (12) |
| Cathepsin L | -0.39 (CTSL1) | 0.20 (CTSL1) | (19) |
| CCL18 | -1.62 | 0.060 | (18) |
| CD14 | -0.029 | 0.41 | (12) |
| CLU | 0.087 | 0.00094 | (6) |
| CST3 | 0.059 | 0.012 | (6) |
| FBLN1 | -0.032 | 1.00 | (19) |
| Fibrinogen | 0.34 (FGA) | 0.00056 (FGA) | (19) |
| 0.24 (FGB) | 0.06 (FGB) | ||
| FN1 | -0.28 | 0.0031 | (19) |
| GRN | 0.068 | 0.42 | (12) |
| Hemoglobin | 0.34 (HBA) | 0.45 (HBA) | (19) |
| 0.11 (HBB) | 0.60 (HBB) | ||
| 0.021 (HBD) | 0.55 (HBD) | ||
| IGF1 | -0.36 | 4.81E-05 | (13) |
| IGF2 | -0.035 | 0.36 | (9, 11, 16, 19) |
| IGFBP1 | 0.92 | 0.00023 | (3, 10) |
| IGFBP2 | -0.34 | 0.025 | (12) |
| IGFBP3 | -0.070 | 0.038 | (13, 17) |
| IGFBP4 | 0.35 | 0.010 | (6, 17) |
| IGFBP5 | -0.074 | 0.036 | (6, 17) |
| IGFBP6 | 0.15 | 0.033 | (6) |
| IGFBP7 | -0.20 | 0.0021 | (6) |
| Inhibin (total) | 0.25 (INHBC) | 0.036 (INHBC) | (15, 19) |
| 0.38 (INHBE) | 0.0083 (INHBE) | ||
| ITIH4 | 0.42 | 0.00018 | (19) |
| LCN2 | 0.18 | 0.15 | (11, 12) |
| MIF | -0.041 | 0.73 | (11, 16) |
| MMP2 | -0.59 | 0.41 | (10, 17) |
| NOV | -0.49 | 0.0053 | (12) |
| PI3 | 0.24 | 0.082 | (12) |
| PPBP | 0.13 | 0.014 | (12) |
| RARRES2 | 0.15 | 0.039 | (12) |
| TGFB1 | -0.015 | 0.43 | (12) |
| THBS1 | 0.23 | 0.24 | (12) |
| TIMP1 | -0.29 | 0.019 | |
| TIMP2 | -0.0090 | 0.86 | |
| TNFRSF21 | -0.11 | 0.26 | (12) |
| VASN | -0.39 | 0.0044 | (6) |
| VCAM1 | -0.084 | 0.17 | (10, 12) |
| VEGF | -0.81 (VEGFC) | 0.082 (VEGFC) | (14) |
| VWF | -0.039 | 0.44 | (12) |
| WFDC2 (HE4) | -0.055 | 0.97 | (4, 11, 19) |
Remarkably, ten members of the insulin-like growth factor pathway (IGF1, IGF2, IGFBP1, IGFBP2, IGFBP3, IGFBP4, IGFBP5, IGFBP6, IGFBP7, and NOV) have been reported as potential ovarian cancer biomarkers (3, 6, 9-13, 16, 17, 19). Of these ten proteins, nine are affected by HRT (p<0.05) (Table 1), with associated increased circulating levels of IGFBP1, IGFBP4, and IGFBP6, and decreased levels of IGF1, IGFBP2, IGFBP3, IGFBP5, IGFBP7, and NOV, and no change in IGF2. To determine whether the effect of HRT is related to particular forms of these proteins that may result from alternative splicing or other types of processes, we searched the data for peptide sequence coverage for these proteins (Figure 1). Intact protein fractionation prior to tryptic digestion and mass spectrometry resulted in the separation of two different forms of IGF1. A mature form was down-regulated following HRT. Another form that represented the propeptide was also identified but lacked quantification. IGF2 was also identified as an intact form that encompassed the propeptide. No quantitative differences were observed in relation to HRT. The IGFBPs (including NOV) each were represented with a cleaved signal peptide, and with peptide coverage across most of the protein sequence.
Figure 1.
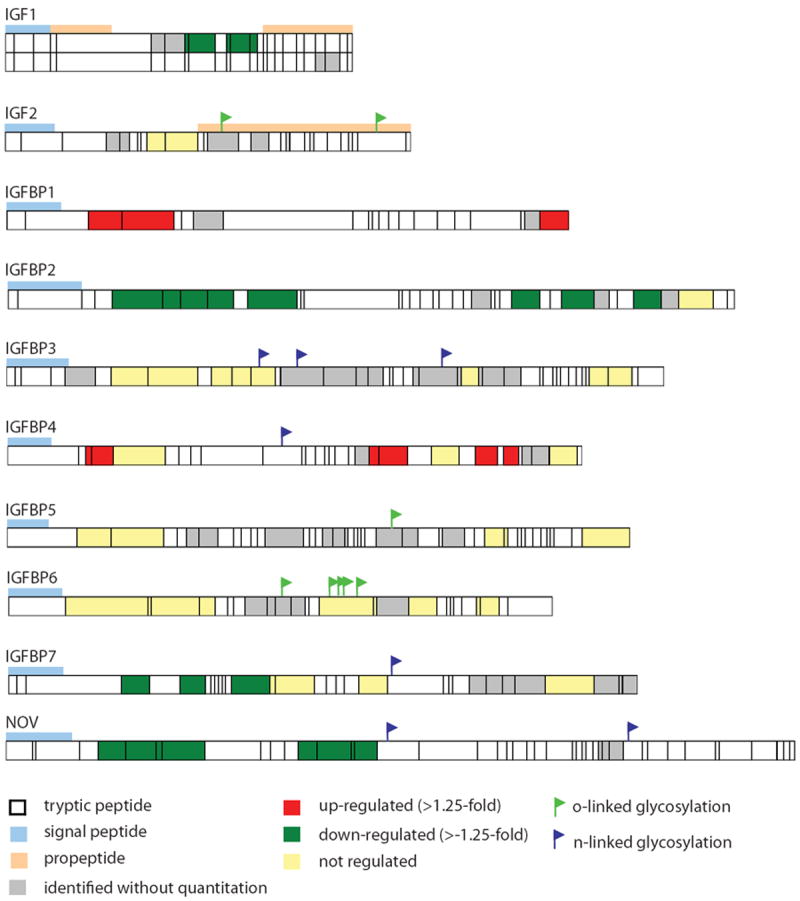
Peptide sequence coverage of members of the insulin-like growth factor protein family.
Total inhibin, consisting of the dimeric and free α-subunits, has been reported as a potential ovarian cancer biomarker (15, 19). In our studies, quantitative information was available for inhibin beta E and C (INHBE, INHBC), both of which were up-regulated with HRT. Figure 2 displays the peptide coverage for INHBC. Two forms of INHBC are observed, the cleaved propeptide and the mature processed protein. The propeptide exhibited increased levels with HRT, whereas the mature protein was unchanged with HRT. Figure 3 displays the individual peptide measurements for peptides corresponding to the propeptide and mature form. The average (log2) ratio is 0.70 for the propeptide and -0.13 for the mature form.
Figure 2.
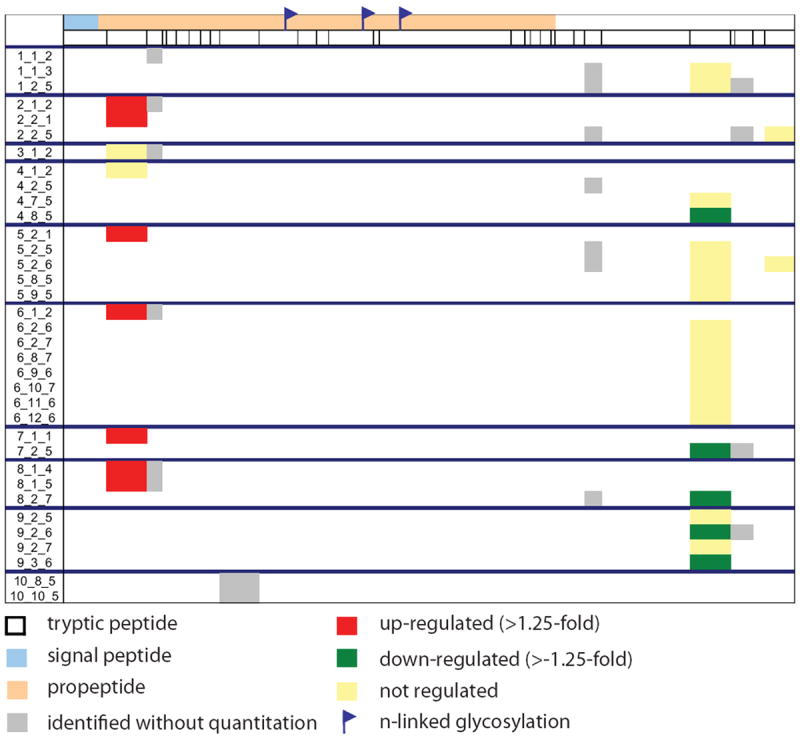
Peptide sequence coverage of inhibin beta C. Numbers in the left column refer to Experiment_Anion Exchange Fraction_Reversed-Phase Fraction.
Figure 3.
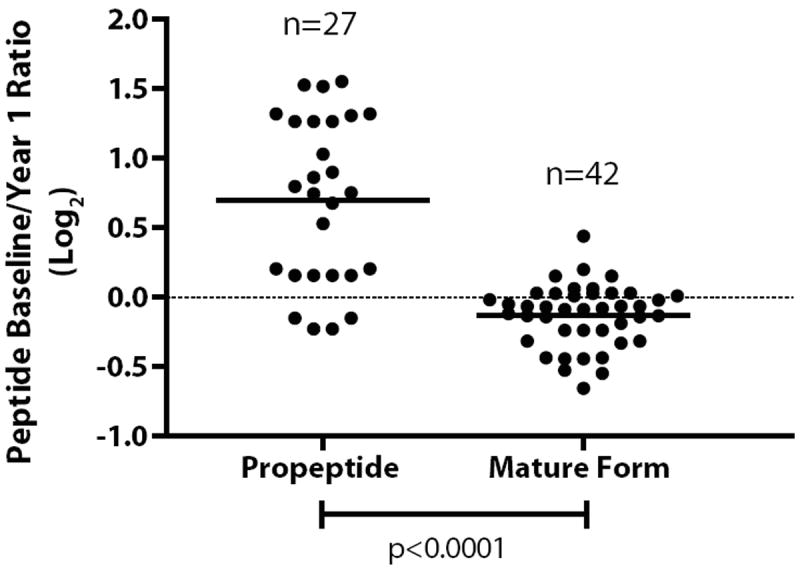
Peptide ratios for baseline/1 year hormone therapy for inhibin beta C. Ratios for peptides from the propeptide and mature form are shown.
In addition to proteins that have been assayed in the blood as potential ovarian cancer biomarkers, we investigated proteins that were recently described as potential markers by Kulasingam et al (21) based on their proteomic identification in ovarian cancer cell lines (6, 22), ascites (23, 24), and tumor tissue (25), and oligonucleotide microarray experiments (26). Table 2 presents proteins that were identified in at least 3 of 6 ovarian cancer proteomic and/or transcriptomic studies for which data for the effects of HRT on their levels was available. Levels of 11 of 20 proteins presented in Table 2 were found to be affected by HRT (p<0.05), with eight proteins having increased levels and three proteins having decreased levels.
Table 2.
Proteins identified in at least three ovarian cancer studies as reported by Kulasingam, Pavlou, and Diamandis (21) and have known ratios of one year hormone therapy compared to baseline.
| Protein | Log2 Ratio (1-Year HT/Baseline) | P-Value |
|---|---|---|
| A2M | 0.07 | 0.13 |
| C3 | 0.13 | 0.0011 |
| CFB | 0.18 | 2.86E-05 |
| CFI | 0.092 | 0.0059 |
| CLU | 0.087 | 0.00094 |
| COL1A1 | -0.77 | 6.80E-05 |
| FBLN1 | -0.032 | 1.00 |
| GRN | 0.068 | 0.42 |
| IGFBP2 | -0.34 | 0.025 |
| IGFBP4 | 0.35 | 0.010 |
| LGALS1 | 0.21 | 0.09 |
| LTBP1 | -0.10 | 0.16 |
| NPC2 | 0.03 | 0.29 |
| PROS1 | -0.11 | 0.07 |
| SERPING1 | 0.47 | 0.012 |
| TGFBI | 0.31 | 0.0035 |
| THBS1 | 0.23 | 0.24 |
| VASN | -0.39 | 0.0044 |
| VTN | 0.67 | 8.31E-09 |
| WFDC2 | -0.055 | 0.97 |
Discussion
In previous studies (1, 2), we have described the substantial effect of hormone therapy on circulating protein levels. Here we examine the implications of these findings further by looking at the explicit effect of HRT on potential biomarkers reported for ovarian cancer. Hormone therapy affects a significant portion of the serum proteome and hence has the potential to confound studies aimed at assessing circulating proteins as potential biomarkers for diseases that affect older women. The analysis presented here pertains to post-menopausal hormone replacement therapy. Given the widespread effect of oral estrogen treatment on the serum proteome, it is feasible that pre-menopausal oral contraceptive use could cause significant alterations in the serum proteome. For example, circulating levels of SHBG, which have shown to be elevated with HRT (1, 27), are also elevated with oral contraceptive use in pre-menopausal women (28). Analyses presented here pertaining to potential candidate markers for ovarian cancer demonstrate that circulating levels of a substantial number of these candidates are affected by HRT. This effect and potentially effects resulting from other environmental exposures and/or drugs may confound biomarker studies and should be taken into account as part of the study design and data analysis. Subjects in discovery studies may need to be stratified based on such exposures. Samples were matched by age for several studies in Table 1 (3, 4, 11, 13, 15, 16), however only two studies accounted for post-menopausal hormone therapy use in study design. One study included only age-matched samples from post-menopausal women who were not using oral contraceptives or menopausal estrogens at blood draw (13), and a second study matched cases and controls by hormone replacement therapy use in addition to age (3). The interpretation of protein changes with disease state should be approached with caution, as confounding factors, unrelated to the disease state, as illustrated here with HRT, may affect circulating levels. Validation studies may also need to incorporate common medications and dietary supplements as covariates that may impact biomarker levels.
It should be noted that our analysis of hormonal effects is based on oral administration. In contrast to transdermal administration, orally administered hormone therapy is known to affect production of a large number of proteins by the liver, which itself is a major source of circulating proteins. In this respect, the proteins listed in Table 2 are not associated specifically with the liver. They are produced by cancer cells and are found in proximal fluids, and over half have circulating levels that are affected by HRT. Estrogen receptors, which regulate gene expression, are widely expressed in a many tissue types. Hence, increased exposure to estrogen of a variety of tissues could result in altered levels of expression of proteins secreted into the blood.
In addition to the study presented here, growth hormones and sex steroids have been previously reported to affect circulating levels of proteins belonging to the insulin-like growth factor (IGF) binding protein family and complement system (29-31). Previously we described the overall quantitative changes of protein levels of IGF family proteins with HRT. Here, we examine in greater depth the quantitative changes of particular protein isoforms by assessment of mass spectrometry sequence coverage, which can provide further insight into how particular protein forms may be influenced by HRT. The peptide coverage for IGF1 and IGF2 in Figure 1 indicates two different isoforms of IGF1, and one form of IGF2. The mature form and the cleaved propeptide of IGF1 are observed, whereas the propeptide is still attached to the mature form of IGF2. The down-regulation of IGF1 levels may be related to the activated form, whereas the non-processed form of IGF2 accounts for unchanged levels with HRT.
Inhibins are proteins known to regulate the pituitary hormone, FSH and play a role in reproduction (32). Although inhbin beta C was found to have overall increased circulating levels with HRT, closer inspection of peptides observed reveals two isoforms of INHBC. The separation of the propeptide and mature form, which elute in separate fractions during the intact protein separation prior to tryptic digestion and mass spectrometry analysis, suggests that the protein has undergone processing. The propeptide is up-regulated with hormone therapy, whereas the mature form of the protein is not changed. Although propeptides are typically inactive, they can be turned into active forms by post-translational modification. The propeptide of inhibin beta C has three known N-linked glycosylation sites. No tryptic peptides containing glycosites are identified in these studies, suggesting that the propeptide is likely glycosylated.
The serum proteome has great potential for disease diagnostics, however the complexity caused by confounding effects, as demonstrated here for HRT, should be considered in biomarker discovery study design and validation studies.
References
- 1.Katayama H, Paczesny S, Prentice R, Aragaki A, Faca VM, Pitteri SJ, et al. Application of serum proteomics to the Women’s Health Initiative conjugated equine estrogens trial reveals a multitude of effects relevant to clinical findings. Genome Med. 2009;1:47. doi: 10.1186/gm47. [DOI] [PMC free article] [PubMed] [Google Scholar]
- 2.Pitteri SJ, Hanash SM, Aragaki A, Amon LM, Chen L, Busald Buson T, et al. Postmenopausal estrogen and progestin effects on the serum proteome. Genome Med. 2009;1:121. doi: 10.1186/gm121. [DOI] [PMC free article] [PubMed] [Google Scholar]
- 3.Amon LM, Law W, Fitzgibbon MP, Gross JA, O’Briant K, Peterson A, et al. Integrative Proteomic Analysis of Serum and Peritoneal Fluids Helps Identify Proteins that Are Up-Regulated in Serum of Women with Ovarian Cancer. PLoS One. 2010;5:e11137. doi: 10.1371/journal.pone.0011137. [DOI] [PMC free article] [PubMed] [Google Scholar]
- 4.Anderson GL, McIntosh M, Wu L, Barnett M, Goodman G, Thorpe JD, et al. Assessing lead time of selected ovarian cancer biomarkers: a nested case-control study. J Natl Cancer Inst. 2010;102:26–38. doi: 10.1093/jnci/djp438. [DOI] [PMC free article] [PubMed] [Google Scholar]
- 5.Dieplinger H, Ankerst DP, Burges A, Lenhard M, Lingenhel A, Fineder L, et al. Afamin and apolipoprotein A-IV: novel protein markers for ovarian cancer. Cancer Epidemiol Biomarkers Prev. 2009;18:1127–33. doi: 10.1158/1055-9965.EPI-08-0653. [DOI] [PubMed] [Google Scholar]
- 6.Gunawardana CG, Kuk C, Smith CR, Batruch I, Soosaipillai A, Diamandis EP. Comprehensive analysis of conditioned media from ovarian cancer cell lines identifies novel candidate markers of epithelial ovarian cancer. J Proteome Res. 2009;8:4705–13. doi: 10.1021/pr900411g. [DOI] [PubMed] [Google Scholar]
- 7.Jackson D, Craven RA, Hutson RC, Graze I, Lueth P, Tonge RP, et al. Proteomic profiling identifies afamin as a potential biomarker for ovarian cancer. Clin Cancer Res. 2007;13:7370–9. doi: 10.1158/1078-0432.CCR-07-0747. [DOI] [PubMed] [Google Scholar]
- 8.Maatta M, Talvensaari-Mattila A, Turpeenniemi-Hujanen T, Santala M. Matrix metalloproteinase-2 (MMP-2) and-9 (MMP-9) and their tissue inhibitors (TIMP-1 and TIMP-2) in differential diagnosis between low malignant potential (LMP) and malignant ovarian tumours. Anticancer Res. 2007;27:2753–8. [PubMed] [Google Scholar]
- 9.Mrochem J, Sodowski K, Deja R, Walaszek-Gruszka A, Wojcieszek A, Kolosza Z, et al. Evaluation of selected serum protein markers as early detectors of ovarian cancer. Ginekol Pol. 2008;79:271–5. [PubMed] [Google Scholar]
- 10.Nolen B, Marrangoni A, Velikokhatnaya L, Prosser D, Winans M, Gorelik E, et al. A serum based analysis of ovarian epithelial tumorigenesis. Gynecol Oncol. 2009;112:47–54. doi: 10.1016/j.ygyno.2008.09.043. [DOI] [PMC free article] [PubMed] [Google Scholar]
- 11.Palmer C, Duan X, Hawley S, Scholler N, Thorpe JD, Sahota RA, et al. Systematic evaluation of candidate blood markers for detecting ovarian cancer. PLoS One. 2008;3:e2633. doi: 10.1371/journal.pone.0002633. [DOI] [PMC free article] [PubMed] [Google Scholar]
- 12.Pitteri SJ, JeBailey L, Faca VM, Thorpe JD, Silva MA, Ireton RC, et al. Integrated proteomic analysis of human cancer cells and plasma from tumor bearing mice for ovarian cancer biomarker discovery. PLoS One. 2009;4:e7916. doi: 10.1371/journal.pone.0007916. [DOI] [PMC free article] [PubMed] [Google Scholar]
- 13.Serin IS, Tanriverdi F, Yilmaz MO, Ozcelik B, Unluhizarci K. Serum insulin-like growth factor (IGF)-I, IGF binding protein (IGFBP)-3, leptin concentrations and insulin resistance in benign and malignant epithelial ovarian tumors in postmenopausal women. Gynecol Endocrinol. 2008;24:117–21. doi: 10.1080/09513590801895559. [DOI] [PubMed] [Google Scholar]
- 14.Tan XJ, Lang JH, Shen K, Wang L, Wu M, Xu XY. Correlation of preoperative serum vascular endothelial growth factor level with CA125 level in patients with epithelial ovarian cancer and its prognostic value. Zhonghua Fu Chan Ke Za Zhi. 2008;43:9–12. [PubMed] [Google Scholar]
- 15.Tsigkou A, Marrelli D, Reis FM, Luisi S, Silva-Filho AL, Roviello F, et al. Total inhibin is a potential serum marker for epithelial ovarian cancer. J Clin Endocrinol Metab. 2007;92:2526–31. doi: 10.1210/jc.2007-0235. [DOI] [PubMed] [Google Scholar]
- 16.Visintin I, Feng Z, Longton G, Ward DC, Alvero AB, Lai Y, et al. Diagnostic markers for early detection of ovarian cancer. Clin Cancer Res. 2008;14:1065–72. doi: 10.1158/1078-0432.CCR-07-1569. [DOI] [PubMed] [Google Scholar]
- 17.Walker G, MacLeod K, Williams AR, Cameron DA, Smyth JF, Langdon SP. Insulin-like growth factor binding proteins IGFBP3, IGFBP4, and IGFBP5 predict endocrine responsiveness in patients with ovarian cancer. Clin Cancer Res. 2007;13:1438–44. doi: 10.1158/1078-0432.CCR-06-2245. [DOI] [PubMed] [Google Scholar]
- 18.Wang Q, Zhang W, Li DR, Li L. Identification of two potential serum biomarkers for ovarian cancer and clinical validation thereof. Zhonghua Yi Xue Za Zhi. 2008;88:1012–6. [PubMed] [Google Scholar]
- 19.Williams TI, Toups KL, Saggese DA, Kalli KR, Cliby WA, Muddiman DC. Epithelial ovarian cancer: disease etiology, treatment, detection, and investigational gene, metabolite, and protein biomarkers. J Proteome Res. 2007;6:2936–62. doi: 10.1021/pr070041v. [DOI] [PubMed] [Google Scholar]
- 20.Bourdeau V, Deschenes J, Metivier R, Nagai Y, Nguyen D, Bretschneider N, et al. Genome-wide identification of high-affinity estrogen response elements in human and mouse. Mol Endocrinol. 2004;18:1411–27. doi: 10.1210/me.2003-0441. [DOI] [PubMed] [Google Scholar]
- 21.Kulasingam V, Pavlou MP, Diamandis EP. Integrating high-throughput technologies in the quest for effective biomarkers for ovarian cancer. Nat Rev Cancer. 2010;10:371–8. doi: 10.1038/nrc2831. [DOI] [PubMed] [Google Scholar]
- 22.Faca VM, Ventura AP, Fitzgibbon MP, Pereira-Faca SR, Pitteri SJ, Green AE, et al. Proteomic analysis of ovarian cancer cells reveals dynamic processes of protein secretion and shedding of extra-cellular domains. PLoS One. 2008;3:e2425. doi: 10.1371/journal.pone.0002425. [DOI] [PMC free article] [PubMed] [Google Scholar]
- 23.Gortzak-Uzan L, Ignatchenko A, Evangelou AI, Agochiya M, Brown KA, St Onge P, et al. A proteome resource of ovarian cancer ascites: integrated proteomic and bioinformatic analyses to identify putative biomarkers. J Proteome Res. 2008;7:339–51. doi: 10.1021/pr0703223. [DOI] [PubMed] [Google Scholar]
- 24.Kuk C, Kulasingam V, Gunawardana CG, Smith CR, Batruch I, Diamandis EP. Mining the ovarian cancer ascites proteome for potential ovarian cancer biomarkers. Mol Cell Proteomics. 2009;8:661–9. doi: 10.1074/mcp.M800313-MCP200. [DOI] [PMC free article] [PubMed] [Google Scholar]
- 25.Bengtsson S, Krogh M, Szigyarto CA, Uhlen M, Schedvins K, Silfversward C, et al. Large-scale proteomics analysis of human ovarian cancer for biomarkers. J Proteome Res. 2007;6:1440–50. doi: 10.1021/pr060593y. [DOI] [PubMed] [Google Scholar]
- 26.Meinhold-Heerlein I, Bauerschlag D, Zhou Y, Sapinoso LM, Ching K, Frierson H, Jr, et al. An integrated clinical-genomics approach identifies a candidate multi-analyte blood test for serous ovarian carcinoma. Clin Cancer Res. 2007;13:458–66. doi: 10.1158/1078-0432.CCR-06-0691. [DOI] [PubMed] [Google Scholar]
- 27.Helgason S, Damber JE, Damber MG, von Schoultz B, Selstam G, Sodergard R. A comparative longitudinal study on sex hormone binding globulin capacity during estrogen replacement therapy. Acta Obstet Gynecol Scand. 1982;61:97–100. doi: 10.3109/00016348209156536. [DOI] [PubMed] [Google Scholar]
- 28.White T, Ozel B, Jain JK, Stanczyk FZ. Effects of transdermal and oral contraceptives on estrogen-sensitive hepatic proteins. Contraception. 2006;74:293–6. doi: 10.1016/j.contraception.2006.04.005. [DOI] [PubMed] [Google Scholar]
- 29.Heald A, Kaushal K, Anderson S, Redpath M, Durrington PN, Selby PL, et al. Effects of hormone replacement therapy on insulin-like growth factor (IGF)-I, IGF-II and IGF binding protein (IGFBP)-1 to IGFBP-4: implications for cardiovascular risk. Gynecol Endocrinol. 2005;20:176–82. doi: 10.1080/09513590400027406. [DOI] [PubMed] [Google Scholar]
- 30.Munzer T, Rosen CJ, Harman SM, Pabst KM, St Clair C, Sorkin JD, et al. Effects of GH and/or sex steroids on circulating IGF-I and IGFBPs in healthy, aged women and men. Am J Physiol Endocrinol Metab. 2006;290:E1006–13. doi: 10.1152/ajpendo.00166.2005. [DOI] [PubMed] [Google Scholar]
- 31.Yilmazer M, Fenkci V, Fenkci S, Aktepe O, Sonmezer M, Kurtay G. Association of serum complement (C3, C4) and immunoglobulin (IgG, IgM) levels with hormone replacement therapy in healthy post-menopausal women. Hum Reprod. 2003;18:1531–5. doi: 10.1093/humrep/deg292. [DOI] [PubMed] [Google Scholar]
- 32.de Kretser DM, Hedger MP, Loveland KL, Phillips DJ. Inhibins, activins and follistatin in reproduction. Hum Reprod Update. 2002;8:529–41. doi: 10.1093/humupd/8.6.529. [DOI] [PubMed] [Google Scholar]