

Abstract
Many studies have demonstrated that microRNA-210 (miR-210) expression is intensively upregulated in hypoxic states and differentially regulated in most types of cancer cells. However, the clinical significance of miR-210 and its effects on the response of leukemic cells to chemotherapeutic drugs in childhood acute lymphoblastic leukemia (ALL) remain unknown. In the current study, using real-time qRT-PCR to detect miR-210 expression in bone marrow samples from 114 children at initial diagnosis of ALL, we investigated the prognostic significance of miR-210 and determined its associations with common clinical characteristics and treatment outcome. We further examined its effect on the response to chemotherapeutic drugs in the Reh and RS4;11 cell lines. Results showed that miR-210 expression was significantly lower in patients suffering from relapse and induction failure than in other patients (P < 0.001). Using the receiver operating characteristic curve, 3.8243 was selected as the cut-off value of miR-210 expression in our test cohort (38 cases). A significantly poorer treatment outcome (P < 0.05) was found in the low-expression group and verified in the validation cohort (76 cases, P < 0.05). Patients with low expression of miR-210 and positive minimal residual disease at the end of induction had a much higher rate of relapse or induction failure (P = 0.001). Increasing/decreasing miR-210 expression using agomir/antagomir could enhance or reduce the response of Reh cells and RS4;11 cells to daunorubicin/dexamethasone/L-asparaginase and daunorubicin/dexamethasone/vincristine, respectively. In conclusion, miR-210 may be a good prognostic factor and a useful predictor of drug sensitivity, and is a potential therapeutic target for pediatric ALL.
Keywords: Chemotherapy, child, lymphoblastic leukemia, MicroRNA, minimal residual disease
Acute lymphoblastic leukemia (ALL) is the most common pediatric cancer, accounting for nearly one-quarter of all malignancies diagnosed among children aged <15 years.(1) Although the outcome of childhood ALL has improved in recent ten years, 15–20% of patients relapse, and recurrent ALL remains the most formidable challenge in pediatric leukemia treatment.(2) Because the outcomes of patients who relapse are dismal, the logical next step is to find more useful leukemic markers to identify those patients at high risk of relapse as early as possible.(3)
Recently, many studies have indicated that microRNA-210 (miR-210; coding sequence located at 11p15.5) is consistently upregulated in hypoxic states.(4) Functioning as a hypoxamir (i.e. a microRNA whose expression is upregulated by hypoxia), miR-210 targets many genes involved in a wide range of physiological processes, such as cell survival/proliferation, mitochondrial metabolism, protein modification/transport, DNA damage repair and angiogenesis.(5,6) Clinical studies have demonstrated that miR-210 is often differentially expressed in certain types of cancer, and always associated with prognosis.(7–14) Mi et al. demonstrate that miR-210 can be used to discriminate between ALL and acute myeloid leukemia (AML).(15) However, it is not clear whether miR-210 correlates with treatment outcome or plays a role in the treatment response to chemotherapeutic drugs in childhood ALL. In the present study, we investigated the clinical significance of miR-210 in pediatric ALL and further explored its impact on the process of the chemotherapeutic drug resistance.
Materials and Methods
Patients, bone marrow samples and cell lines
From April 2008 to October 2009, a total of 226 pediatric ALL patients were admitted to our hospital and treated according to the Chinese Children's Leukemia Group 2008 protocol. The detailed treatment and risk stratification protocols were described previously.(16,17) To ensure that the results reflected the leukemic cell populations in these patients, only cases with bone marrow (BM) samples containing ≥70% leukemic cells were enrolled in this study (n = 114).(18) During April 2008 to January 2009, 38 cases were used as a test cohort for evaluation of miR-210 expression as a prognostic marker, including 34 cases with B cell precursor ALL (BCP-ALL) and 4 cases with T cell ALL (T-ALL). The median follow-up time was 61 months (range: 1.0–68.0). Eight of these patients suffered from BM relapse or induction failure, and all died 2–13 months after relapse or induction failure; the other 30 patients were in continuous complete remission (CCR). From January 2009 to October 2009, the remaining patients (76 cases) were used as a validation cohort to confirm the prognostic significance of miR-210 expression, including 66 cases with BCP-ALL and 10 cases with T-ALL. The median follow-up time was 48 months (range: 1.0–59.0). Among them, seven suffered from BM relapse or induction failure, one died of severe infection during treatment, and 68 were in CCR. Another five patients in CCR for more than 5 years were chosen as the control group.
The TEL/AML1+ Reh cell line and the MLL/AF4+ RS4;11 cell line (Cell Bank of the Chinese Academy of Sciences, Shanghai, China) were cultured in RPMI-1640 medium (GIBCO, Grand Island, NY, USA) supplemented with 10% FBS (Biochrom, Berlin, Germany), 1% L-glutamine, 100 U/mL penicillin and 100 μg/mL streptomycin under standard culture conditions (at 37°C in 5% CO2).
Informed consent was obtained from the guardians of the patients prior to their participation in the current study.
miRNA isolation, cDNA synthesis and determination of miR-210 expression
Total miRNA was extracted using the mirVana miRNA Isolation Kit according to the manufacturer's instructions (Ambion, Austin, TX, USA). MiRNA were reverse-transcribed into cDNA using the TaqMan MicroRNA Reverse Transcription Kit containing a stem-loop-like RT primer, according to the manufacturer's instructions (Applied Biosystems, Carlsbad, CA, USA).
To determine miR-210 expression, qRT-PCR was performed using the TaqMan MicroRNA Assay (Ambion, Austin, TX, USA) containing miRNA-specific PCR primers, and the Molecular Beacon probe according to the manufacturer's instructions. Endogenous U6 RNA was used as an internal control. The average Ct value of the BM samples obtained from the 5 ALL patients in CCR for more than 5 years (control group) was used as a calibrator.(19) The expression levels of miR-210 in diagnostic samples were calculated using the 2–ΔΔCt method, and are presented as fold changes compared with that of the control group.(20)
Cell transfection and treatments
MiR-210 antagomir and agomir were synthesized by Ribobio (Guangzhou, China). Mismatched miR-210 antagomir and agomir were also synthesized for use as negative controls (antagomir-NC and agomir-NC).
MiR-210 antagomir (100 nM), agomir (50 nM), antagomir-NC or agomir-NC was transfected into the two leukemic cell lines, respectively, using FuGENE HD transfection reagent (Roche Diagnostics, Penzberg, Germany) according to the manufacturer's instructions. Forty-eight hours after transfection, total miRNA was isolated using the mirVana miRNA isolation kit, and the expression level of miR-210 was quantified using the relative quantification method (2–ΔΔCt) and U6 snRNA as an internal control, as described above.
In vitro drug sensitivity assay
The in vitro drug sensitivity of the transfected leukemic cell lines was determined by CellTiter 96 Aqueous One Solution cell proliferation assay (Promega, Madison, WI, USA) according to the manufacturer's instructions. Briefly, 24 h after transfection, approximately 1 × 10⁵ cells were plated in each well of a 96-well plate in RPMI-1640 medium with 10% FBS. The cells were treated with four common chemotherapeutic drugs or four-drug combinations (dexamethasone [DEX], vincristine [VCR], daunorubicin [DNR] and L-asparaginase [L-ASP] with or without [control] gradient concentrations; concentration ranges are listed in Table 1) for 48 h and then with 20 μL of MTS solution reagent per well at 37°C for 4 h. Optical density (OD) at 490 nm was measured using a 96-well plate reader (Thermo, Waltham, MA, USA). All samples were tested in triplicate, and each experiment was repeated at least three times. The following equation was used to calculate leukemic cell survival (LCS) at each drug concentration: LCS = (OD of drug exposed well)/(OD of negative control well) × 100 (%). The 50% inhibitory concentration (IC50) was used as the measure of cellular resistance to each drug or drug mixture.
Table 1.
Concentrations of the four drugs used for in vitro drug sensitivity tests in Reh and RS4;11 cells
| Drug (abbreviation) | Tested range (μg/mL) Minimum–Maximum |
|---|---|
| Daunorubicin (DNR) | 0.001–1 |
| L-asparaginase (L-ASP) | 0.001–10† |
| Vincristine (VCR) | 0.001–5 |
| Dexamethasone (Dex) | 0.100–250 |
International units per milliliter.
Statistical analysis
Leukemia-free survival (LFS) was defined from the date of diagnosis to the date of relapse or induction failure, whichever came first. Event-free survival (EFS) was defined from the date of diagnosis to the date of relapse, induction failure, second malignancy, and death from any cause, whichever came first. The last follow up was carried out on May 2013.
The receiver operating characteristic (ROC) curve was used to assess the ability of miR-210 to predict relapse or induction failure. The differences in clinical characteristics between high or low expression of miR-210 were determined using the two-sample Kolmogorov–Smirnov test. The χ2-test was used to determine the associations of miR-210 with minimal residual disease (MRD), outcome and other clinicobiological characteristics. Kaplan–Meier survival analysis was used to determine the significance of the differences in LFS, EFS and overall survival (OS) between the high-miR-210 expression and low-miR-210 expression groups. The Mann–Whitney U-test was used to analyze the differences in IC50 of each drug or drug mixture. A P-value <0.05 was considered significant and all analyses were performed using spss 16.0 for Microsoft Windows software (SPSS Inc., Chicago, IL, USA).
Results
Prognostic significance of miR-210 expression
There were 112 patients excluded from this study because not enough BM was available to extract RNA or the diagnostic BM sample contained <70% blasts. No statistical differences were observed between the included and excluded patients in age (P = 0.812), sex (P = 0.213), immunophenotype (P = 0.071), TEL-AML1 (P = 0.243), BCR-ABL (P = 0.875), E2A-PBX1 (P = 0.888), MLL rearrangements (P = 0.996) and central nervous system (CNS) involvement (P = 0.105).
In the 114 patients enrolled in this study, the expression level of miR-210 had a skewed distribution, with a median of 4.55 (range: 0.54–69.33), and was significantly lower in patients who suffered relapse or induction failure (15 cases) than in other patients (99 cases, P < 0.001).
Good prognostic significance of miR-210 expression for relapse at any site and induction failure was shown by ROC curve analysis in the test cohort (38 cases) (Fig. 1, AUC = 0.871, P = 0.001). The optimal cut-off value of miR-210 expression identified by ROC curve analysis was 3.8243 and had acceptable sensitivity and specificity (0.700 and 0.750, respectively). Using this cut-off value, the test cohort was separated into low-expression and high-expression groups (15 and 23 cases, respectively). The incidence of relapse or induction failure was significantly higher (40 vs 8.6%, respectively; P = 0.039), and the 5-year LFS (log-rank: P = 0.017; Fig. 2a), EFS (log-rank: P = 0.017; Fig. 2b) and OS (log-rank: P = 0.016; Fig. 2c) were significantly poorer in the low-expression group.
Fig. 1.
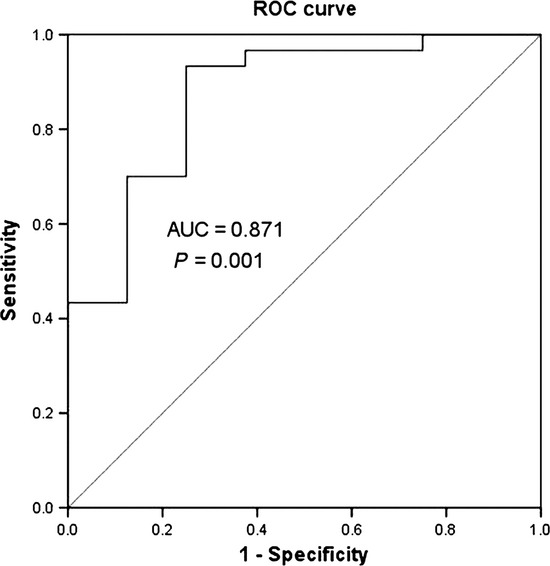
The receiver operating characteristic (ROC) curve of miR-210 expression to predict relapse and induction failure in the test cohort (38 patients).
Fig. 2.
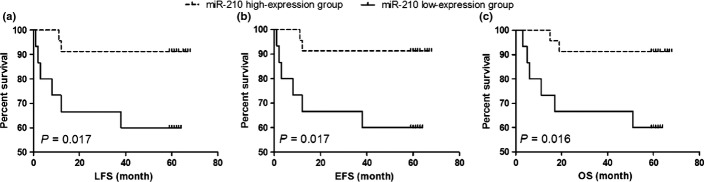
The prognostic significance of miR-210 in the test cohort (38 patients). The dashed line and solid line were derived from miR-210 high-expression or low-expression group, respectively. There were significant lower LFS (a), EFS (b) and OS (c) in low-expression group of miR-210.
In the validation cohort (n = 76), with median follow-up time of 48.0 months, the poor treatment outcome in the low-expression group was confirmed. Using the above cut-off value, these patients were separated into low-expression and high-expression groups (32 and 44 cases, respectively). During the follow-up period, six patients with low expression of miR-210 and only 1 with high expression suffered from BM relapse or induction failure. The rate of relapse and induction failure was significantly higher (P = 0.037) and the 4-year LFS (log rank: P = 0.014; Fig. 3a), EFS (log-rank: P = 0.046; Fig. 3b) and OS (log rank: P = 0.033; Fig. 3c) were significantly poorer in the low-expression group.
Fig. 3.
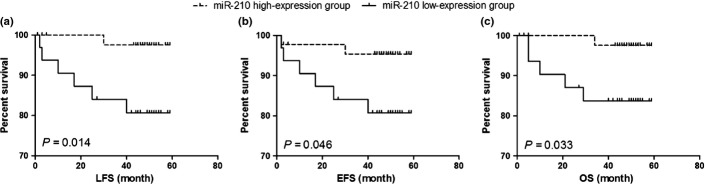
The prognostic significance of miR-210 in the validation cohort (76 patients). The dashed line and solid line were derived from miR-210 high-expression or low-expression group, respectively. There were significant lower leukemia-free survival (LFS) (a), event-free survival (EFS) (b) and overall survival (OS) (c) in the low-expression group of miR-210.
Expression of miR-210 was significantly associated with some clinical characteristics and was obviously lower in boys, patients older than 10 years, and patients with T-ALL (Table S1). Furthermore, miR-210 expression, regarded as a categorical variable, was an independent prognostic factor (P = 0.002) (Table S2) in a Cox proportional hazards model adjusted for other common clinical characteristics, including age, peripheral white blood cell count at diagnosis, MRD at the end of induction of remission (day 33), immunophenotype, prednisone response, CNS involvement and fusion genes. These findings indicated that the expression of miR-210 at diagnosis could be a useful predictor of treatment outcome.
Utility of the combination of miR-210 expression and minimal residual disease at day 33
Some patients with positive MRD at day 33 (one of the most powerful predictors of relapse) remained in CCR while others with negative MRD relapsed. Therefore, the utility of the combination in predicting relapse and induction failure was investigated. Among the 66 patients with positive MRD at day 33, 11 of 27 patients with low expression of miR-210 and only 3 of 39 patients with high expression of miR-210 experienced relapse or induction failure (χ2 = 10.427, P = 0.001), indicating that the patients with positive MRD and low expression of miR-210 were more likely to relapse or experience induction failure. In contrast, among the 48 patients with negative MRD at day 33, only 1 of 20 patients with low expression of miR-210 relapsed, while 28 patients with high-expression of miR-210 remained in CCR.
On the basis of the expression of miR-210 and MRD at day 33, we divided the 114 patients into three risk groups: a Low-risk group (miR-210 high-expression and MRD negative), a middle-risk group (miR-210 high-expression, MRD positive or miR-210 low-expression, MRD negative) and a high-risk group (miR-210 low-expression and MRD positive). ROC curve analysis shows that the AUC of miR-210-MRD is 0.898 (Fig. S1c), which is higher than the AUC of miR-210 (Fig. S1a) or MRD (Fig. S1b). The rate of relapse and induction failure in the low-risk group (1/45), the middle-risk group (3/49) and the high-risk group (11/20) is 2.2, 6.1 and 55%, respectively (P < 0.001). Kaplan–Meier survival analysis demonstrated that the EFS (Fig. S2a) and the OS (Fig. S2b) of the high-risk group were significantly lower than those of the low-risk and middle-risk groups (P < 0.001). Thus, combining miR-210 expression with MRD at day 33 would help to identify the patients at greater risk of relapse or induction failure.
In addition, as no correlation was found between miR-210 and MRD (χ2 = 0.007, P = 0.935, Table S1), miR-210 expression could be regarded as a promising predictor of relapse and induction failure independent of MRD.
Effect of alteration in miR-210 expression on drug sensitivity
To confirm the effect of miR-210 on cellular sensitivity to chemotherapeutic drugs, the intracellular level of miR-210 was changed by transfecting Reh cells and RS4;11 cells with miR-210 agomir and antagomir. Our qRT-PCR analysis of the intracellular level of miR-210 revealed that miR-210 agomir and antagomir produced a nearly 30-fold increase and an approximately 80% decrease, respectively, compared to agomir-NC and antagomir-NC (Fig. S3).
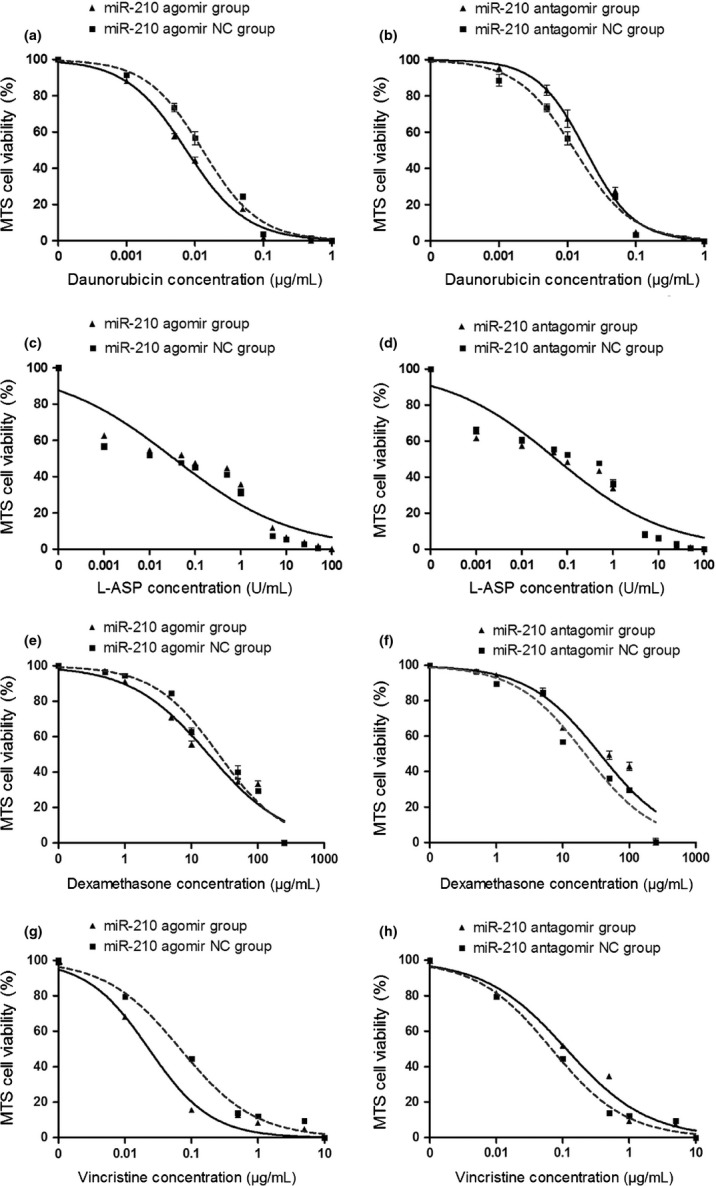
In Reh cells transfected with miR-210 agomir or antagomir, the IC50s of DNR, L-ASP, and DEX were significantly decreased or increased compared with that in cells transfected with agomir-NC or antagomir-NC, respectively (Fig. 4a–f). However, miR-210 agomir and antagomir had no effect on the IC50 of VCR (Fig. 4g–h).
Fig. 4.
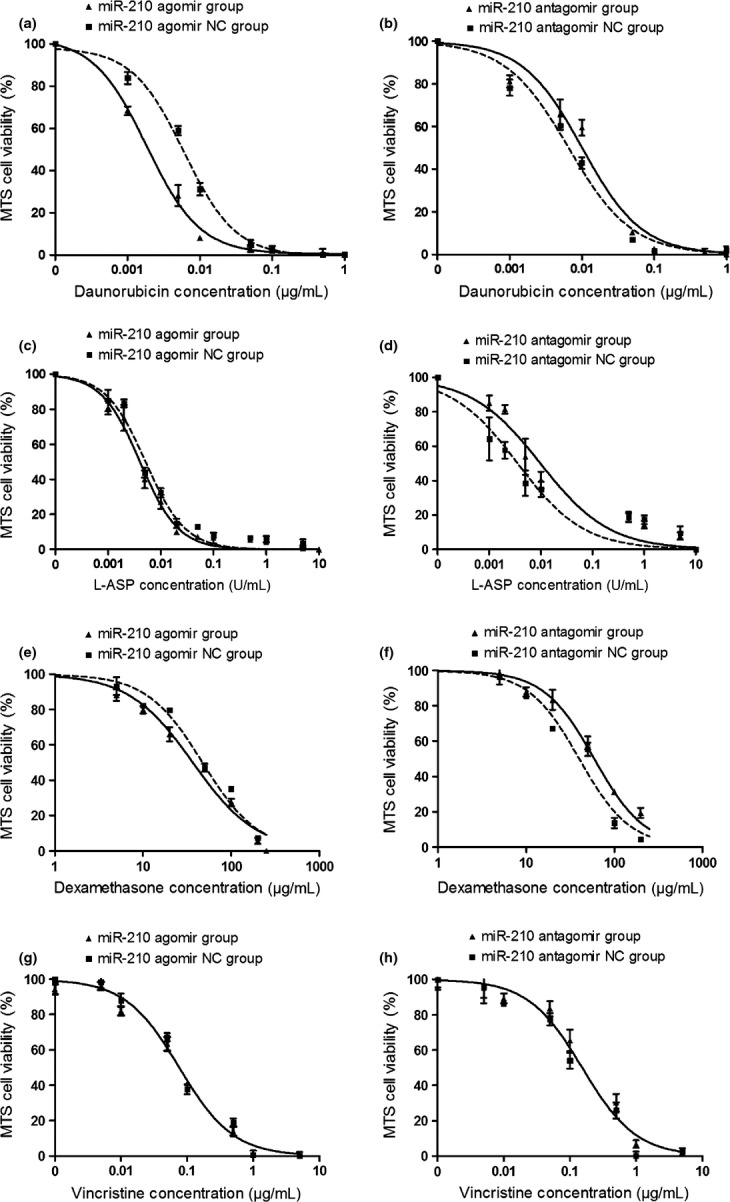
Change in drug sensitivity of Reh cells determined by MTS assay. The cells were transfected with miR-210 agomir, antagomir and controls, respectively. The drug response to DNR (a,b), L-ASP (c, d), DEX (e, f) and VCR (g, h) are shown.
Similar results were obtained in RS4;11 cells: the IC50s of DNR, DEX and VCR (but not L-ASP) were decreased or increased by miR-210 agomir and antagomir, respectively (Fig. 5).
Fig. 5.
Change in drug sensitivity of RS4;11 cells determined by MTS assay. The cells were transfected with miR-210 agomir, antagomir, and controls respectively. The drug response to daunorubicin (DNR) (a,b), L-asparaginase (L-ASP) (c,d), dexamethasone (DEX) (e,f), vincristine (VCR) (g,h) were shown.
As combinations of the four drugs were administered in chemotherapy, the effects of changing the intracellular level of miR-210 on the response of the two cell lines to multidrug treatment were examined. The two cell lines after transfection with miR-210 agomir or antagomir were treated with mixtures of the four drugs at five concentrations (IC5, IC25, IC50, IC75 and IC95). miR-210 agomir and antagomir significantly decreased or increased the viability of cells treated with the four drugs, respectively, at concentrations of IC5 through IC75 (Figs 6a–h, 7a–h) but had no effect on the viability of cells treated with the four drugs at a concentration of IC95 (Figs 6i–j, 7i–j). At high concentration, the drug combination probably overcomes the resistance attributable to low expression of miR-210.
Fig. 6.
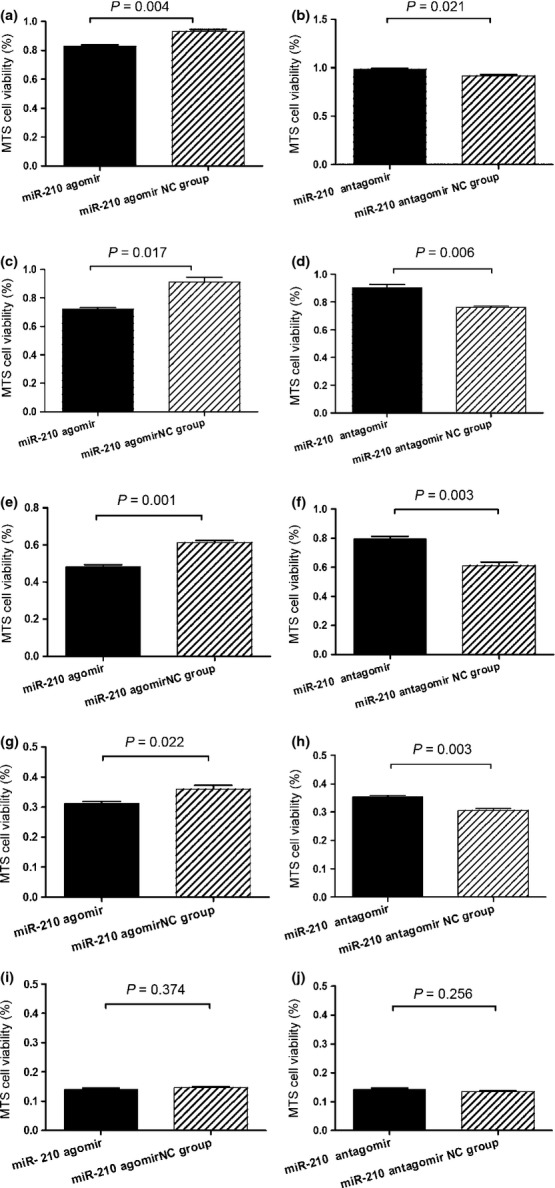
Change in drug sensitivity of Reh cells determined by MTS assay. The cells were transfected with miR-210 agomir, antagomir and controls, respectively. The cell viability after treated with drug mixture at concentrations of IC5 (a,b), IC25 (c,d), IC50 (e,f) IC75 (g,h), and IC95 (i,j) were shown. Data are shown as means ± SE.
Fig. 7.
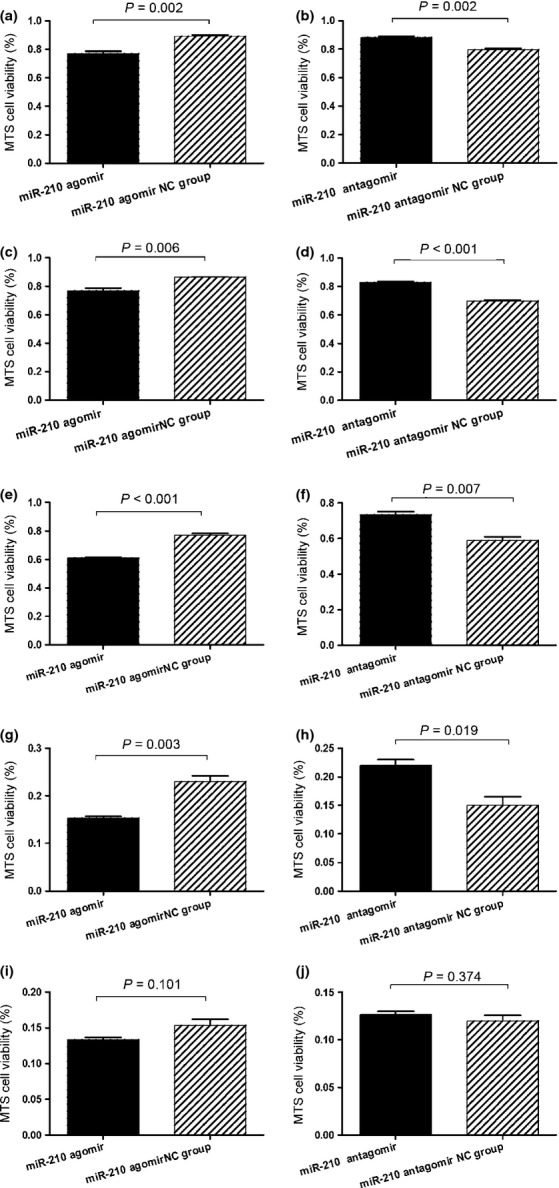
Change in drug sensitivity of RS4;11 cells determined by MTS assay. The cells were transfected with miR-210 agomir, antagomir and controls, respectively. The cell viability after treatment with drug mixture at concentrations of IC5 (a,b), IC25 (c,d), IC50 (e,f), IC75 (g,h) and IC95 (i,j) are shown. Data are shown as means ± SE.
Taken together, these results indicate that increased intracellular level of miR-210 enhances the sensitivity of leukemic cells to common chemotherapeutic drugs and decreases their viability. This may explain, at least in part, the good prognosis of patients with high expression of miR-210.
Discussion
Over decades, great progress has been made in the treatment of newly diagnosed childhood ALL. However, relapse and recurrent ALL remains one of the biggest treatment challenges in 15–20% patients with childhood leukemia.(2) New biomarkers are needed to predict treatment outcome early and precisely. In the current study, low expression of miR-210 (<3.8243) at diagnosis was an independent prognostic factor and was related to poor survival. Patients with positive MRD at the end of induction and low expression of miR-210 had a much higher risk of relapse and induction failure, indicating that miR-210 could be a useful predictor of treatment outcome in pediatric ALL. Recently, many groups have been investigating the prognostic value of miR-210 expression in different types of cancer. In accordance with our study, studies on soft-tissue sarcoma(10) or clear cell renal cancer(14) have found an association of high-expression of miR-210 with favorable prognosis. However, studies on pancreatic ductal adenocarcinomas,(8) breast cancer(9) and glioblastoma multiforme(11) have reached the opposite conclusion (i.e. that high-expression of miR-210 is associated with disease recurrence, poor survival or metastasis). The differences in miR-210 effect on prognosis of different types of cancer reflects the complexity of the regulatory network consisting of miR-210 and its target genes in different types of cells and tissues and can be explained by the tissue-type specific expression of miR-210 target genes (e.g. CASP8AP2, FGFRL1 and MNT), as described in previous reports.(21–23)
Several studies demonstrate that changes in miRNA expression levels can alter drug resistance.(24–26) Because miR-210 expression was associated with treatment outcome, we speculated that alteration of miR-210 expression could affect the response of leukemic cells to chemotherapeutic drugs. To test this speculation, we chose the remission induction protocol involving the use of four drugs (DNR, L-ASP, VCR and DEX) and demonstrated that treatment with miR-210 agomir (increasing miR-210 expression) could enhance the response of Reh cells and RS4;11 cells to DNR/DEX/L-ASP and DNR/DEX/VCR, respectively, while treatment with miR-210 antagomir (decreasing miR-210 expression) led to the opposite response. These results were also in accordance with clinical findings. Up to now, the involvement of miR-210 in multidrug resistance of ALL cells has been unclear. MiR-210 targets more than 35 genes.(6,27) However, the expression of many target genes, such as BCL-2, RAD52 and cyclin F, is undetectable in some subtypes of childhood ALL.(28) These results strongly suggest that the participation of these genes in miR-210-mediated drug resistance is unlikely. In addition, as described above, miR-210 may target different genes in different types of tumors.(21–23) Thus, to clarify the mechanism of miR-210-mediated drug resistance, the “real” target genes regulated by miR-210 in pediatric ALL cells have to be identified.
Comparative analysis of adult ALL miRNAs and profiling of mRNA expression, using correlation coefficient of −0.65 to −0.85 as a screening criteria, indicated that only SAR1B (Saccharomyces cerevisiae SAR1 homolog B) and HINT1 (histidine triad nucleotide binding protein 1) gene expression levels are associated with miR-210 expression, and the correlation coefficients were −0.69 and −0.71, respectively.(29) SAR1B is a small GTP enzyme, functioning as a homodimer. It can be activated by the guanosine exchange factor PREB and involved in protein transport from the endoplasmic reticulum to the Golgi complex.(30) It is also a component of the type II envelope protein complex, playing an indispensable role in the regulation of chylomicron transport from the mitochondria to the Golgi complex. SAR1B deficiency can cause chylomicron retention disease (also known as Anderson disease).(31,32) HINT1 can hydrolyze substrates such as AMP-morpholidate and AMP-N-alanine methyl ester. It can interact with these substrates through a histidine triad motif. HINT1 has been regarded as a tumor suppressor gene. Mutations in HINT1 cause axonal neuropathy with neuromyotonia.(33,34) Interestingly, binding sites of miR-210 were not found in the SAR1B or HINT1 sequence by bioinformatics analysis. How does miR-210 affect SAR1B and HINT1 expression? Are the functions of SAR1B or HINT1 related to the drug resistance of leukemic cells? Both issues are worthy of further exploration. Furthermore, miR-210 must regulate other genes in ALL. Identification of these genes should prove to be of great interest.
However, why did miR-210 agomir and antagomir have no effect on the sensitivity of Reh and RS4;11 cells to VCR and L-ASP respectively? As the Reh and RS4;11 cell line is TEL/AML1+, MLL/AF4+, respectively, and may be the drug resistance mechanism that miR-210-mediated vary in cell lines with specific fusion genes. Comparison of the mRNA profile of the Reh or RS4;11 cell lines after miR-210 treatment would shed some light on this problem.
Recently, independent studies have demonstrated that endogenous miR can be silenced by injection of specific antagomirs.(35) Injection of miR-17-5p antagomirs successfully reduced tumor growth in vivo.(36) Interestingly, it has been demonstrated that miR-210 mimic treatment can improve cardiac function and may serve as a therapeutic approach in ischemic heart disease.(37) These studies suggest that apart from its prognostic value, miR-210 may also have therapeutic value. In pediatric ALL, further reinforcement of the current chemotherapy regimens is unlikely to improve the cure rate because of increased toxicity.(38) Therefore, novel anti-ALL agents are needed to overcome chemotherapy resistance and reduce nonspecific toxicities. Agomir/antagomir of miR may be a good alternative. However, the methods to deliver synthetic miRNA to leukemic cells safely and effectively remain a challenge. More experiments in vitro and in vivo are required to evaluate the feasibility and safety of agomir and antagomir in clinical treatment strategies.
Acknowledgments
This work was supported by a grant-in-aid from the National Natural Science Foundation of China (No. 81170504, No. 81200392), the Beijing Health Qualified Personnel Program (No. 2011-3-049), the National Science & Technology Major Project of the 12th 5-Year Plan (No. 2011ZX09302-007-01) and the National Key Technologies Research & Development Program of the 11th 5-Year Plan (No. 2007BAI04B03).
Disclosure Statement
The authors have no conflict of interest.
Supporting Information
Additional supporting information may be found in the online version of this article:
Fig. S1 Receiver operating characteristic (ROC) curves of miR-210, minimal residual disease (MRD) and miR-210-MRD to predict the replase and induction failure of pediatric acute lymphoblastic leukemia (ALL).
Fig. S2 Event-free survival (EFS) and overall survival (OS) of the three risk groups of miR-210-MRD.
Fig. S3 Changes in intra-cellular levels of miR-210 of Reh and RS4;11 cell line after treated with agomir (a,c) and antagomir (b,d).
Table S1 Correlations of miR-210 expression with clinical characteristics.
Table S2 The independent prognostic significance of common clinical features including miR-210 expression.
References
- 1.Pui CH. Recent research advances in childhood acute lymphoblastic leukemia. J Formos Med Assoc. 2010;109:777–87. doi: 10.1016/S0929-6646(10)60123-4. [DOI] [PubMed] [Google Scholar]
- 2.Bhojwani D, Kang H, Moskowitz NP, et al. Biologic pathways associated with relapse in childhood acute lymphoblastic leukemia: a Children's Oncology Group study. Blood. 2006;108:711–7. doi: 10.1182/blood-2006-02-002824. [DOI] [PMC free article] [PubMed] [Google Scholar]
- 3.Bailey LC, Lange BJ, Rheingold SR, Bunin NJ. Bone-marrow relapse in paediatric acute lymphoblastic leukaemia. Lancet Oncol. 2008;9:873–83. doi: 10.1016/S1470-2045(08)70229-8. [DOI] [PubMed] [Google Scholar]
- 4.Huang X, Le QT, Giaccia AJ. MiR-210–Micromanager of the hypoxia pathway. Trends Mol Med. 2010;16:230–7. doi: 10.1016/j.molmed.2010.03.004. [DOI] [PMC free article] [PubMed] [Google Scholar]
- 5.Devlin C, Greco S, Martelli F, Ivan M. miR-210: more than a silent player in hypoxia. IUBMB Life. 2011;63:94–100. doi: 10.1002/iub.427. [DOI] [PMC free article] [PubMed] [Google Scholar]
- 6.Chan SY, Loscalzo J. MicroRNA-210: a unique and pleiotropic hypoxamir. Cell Cycle. 2010;9:1072–83. doi: 10.4161/cc.9.6.11006. [DOI] [PMC free article] [PubMed] [Google Scholar]
- 7.Ho AS, Huang X, Cao H, et al. Circulating miR-210 as a novel hypoxia marker in pancreatic cancer. Transl Oncol. 2010;3:109–13. doi: 10.1593/tlo.09256. [DOI] [PMC free article] [PubMed] [Google Scholar]
- 8.Greither T, Grochola LF, Udelnow A, Lautenschläger C, Würl P, Taubert H. Elevated expression of microRNAs 155, 203, 210 and 222 in pancreatic tumors is associated with poorer survival. Int J Cancer. 2010;126:73–80. doi: 10.1002/ijc.24687. [DOI] [PubMed] [Google Scholar]
- 9.Hong L, Yang J, Han Y, Lu Q, Cao J, Syed L. High expression of miR-210 predicts poor survival in patients with breast cancer: a meta-analysis. Gene. 2012;507:135–8. doi: 10.1016/j.gene.2012.07.025. [DOI] [PubMed] [Google Scholar]
- 10.Greither T, Würl P, Grochola L, et al. Expression of microRNA 210 associates with poor survival and age of tumor onset of soft-tissue sarcoma patients. Int J Cancer. 2012;130:1230–5. doi: 10.1002/ijc.26109. [DOI] [PubMed] [Google Scholar]
- 11.Qiu S, Lin S, Hu D, Feng Y, Tan Y, Peng Y. Interactions of miR-323/miR-326/miR-329 and miR-130a/miR-155/miR-210 as prognostic indicators for clinical outcome of glioblastoma patients. J Transl Med. 2013;11:10. doi: 10.1186/1479-5876-11-10. [DOI] [PMC free article] [PubMed] [Google Scholar]
- 12.Puisségur MP, Mazure NM, Bertero T, et al. miR-210 is overexpressed in late stages of lung cancer and mediates mitochondrial alterations associated with modulation of HIF-1 activity. Cell Death Differ. 2011;18:465–78. doi: 10.1038/cdd.2010.119. [DOI] [PMC free article] [PubMed] [Google Scholar]
- 13.Giannakakis A, Sandaltzopoulos R, Greshock J, et al. miR-210 links hypoxia with cell cycle regulation and is deleted in human epithelial ovarian cancer. Cancer Biol Ther. 2008;7:255–64. doi: 10.4161/cbt.7.2.5297. [DOI] [PMC free article] [PubMed] [Google Scholar]
- 14.McCormick RI, Blick C, Ragoussis J, et al. miR-210 is a target of hypoxia-inducible factors 1 and 2 in renal cancer, regulates ISCU and correlates with good prognosis. Br J Cancer. 2013;108:1133–42. doi: 10.1038/bjc.2013.56. [DOI] [PMC free article] [PubMed] [Google Scholar]
- 15.Mi S, Lu J, Sun M, et al. MicroRNA expression signatures accurately discriminate acute lymphoblastic leukemia from acute myeloid leukemia. Proc Natl Acad Sci USA. 2007;104:19971–6. doi: 10.1073/pnas.0709313104. [DOI] [PMC free article] [PubMed] [Google Scholar]
- 16.Jiao Y, Cui L, Gao C, et al. CASP8AP2 is a promising prognostic indicator in pediatric acute lymphoblastic leukemia. Leuk Res. 2012;36:67–71. doi: 10.1016/j.leukres.2011.05.023. [DOI] [PubMed] [Google Scholar]
- 17.Gao C, Zhao XX, Li WJ, et al. Clinical features, early treatment responses, and outcomes of pediatric acute lymphoblastic leukemia in China with or without specific fusion transcripts: a single institutional study of 1,004 patients. Am J Hematol. 2012;87:1022–7. doi: 10.1002/ajh.23307. [DOI] [PubMed] [Google Scholar]
- 18.Carroll WL, Bhojwani D, Min DJ, et al. Pediatric acute lymphoblastic leukemia. Hematology Am Soc Hematol Educ Program. 2003;2003:102–31. doi: 10.1182/asheducation-2003.1.102. [DOI] [PubMed] [Google Scholar]
- 19.Rieu I, Powers SJ. Real-time quantitative RT-PCR: design, calculations, and statistics. Plant Cell. 2009;21:1031–3. doi: 10.1105/tpc.109.066001. [DOI] [PMC free article] [PubMed] [Google Scholar]
- 20.Livak KJ, Schmittgen TD. Analysis of relative gene expression data using real-time quantitative PCR and the 2(-Delta Delta C(T)) Method. Methods. 2001;25:402–8. doi: 10.1006/meth.2001.1262. [DOI] [PubMed] [Google Scholar]
- 21.Kim HW, Haider HK, Jiang S, Ashraf M. Ischemic preconditioning augments survival of stem cells via miR-210 expression by targeting caspase-8-associated protein 2. J Biol Chem. 2009;284:33161–8. doi: 10.1074/jbc.M109.020925. [DOI] [PMC free article] [PubMed] [Google Scholar]
- 22.Tsuchiya S, Fujiwara T, Sato F, et al. MicroRNA-210 regulates cancer cell proliferation through targeting fibroblast growth factor receptor-like 1 (FGFRL1) J Biol Chem. 2011;286:420–8. doi: 10.1074/jbc.M110.170852. [DOI] [PMC free article] [PubMed] [Google Scholar]
- 23.Zhang Z, Sun H, Dai H, et al. MicroRNA miR-210 modulates cellular response to hypoxia through the MYC antagonist MNT. Cell Cycle. 2009;8:2756–68. doi: 10.4161/cc.8.17.9387. [DOI] [PubMed] [Google Scholar]
- 24.Kovalchuk O, Filkowski J, Meservy J, et al. Involvement of microRNA-451 in resistance of the MCF-7 breast cancer cells to chemotherapeutic drug doxorubicin. Mol Cancer Ther. 2008;7:2152–9. doi: 10.1158/1535-7163.MCT-08-0021. [DOI] [PubMed] [Google Scholar]
- 25.Xia L, Zhang D, Du R, et al. miR-15b and miR-16 modulate multidrug resistance by targeting BCL2 in human gastric cancer cells. Int J Cancer. 2008;123:372–9. doi: 10.1002/ijc.23501. [DOI] [PubMed] [Google Scholar]
- 26.Sorrentino A, Liu CG, Addario A, Peschle C, Scambia G, Ferlini C. Role of microRNAs in drug-resistant ovarian cancer cells. Gynecol Oncol. 2008;111:478–86. doi: 10.1016/j.ygyno.2008.08.017. [DOI] [PubMed] [Google Scholar]
- 27.Chan YC, Banerjee J, Choi SY, Sen CK. miR-210: the master hypoxamir. Microcirculation. 2012;19:215–23. doi: 10.1111/j.1549-8719.2011.00154.x. [DOI] [PMC free article] [PubMed] [Google Scholar]
- 28.Ross ME, Zhou X, Song G, et al. Classification of pediatric acute lymphoblastic leukemia by gene expression profiling. Blood. 2003;102:2951–9. doi: 10.1182/blood-2003-01-0338. [DOI] [PubMed] [Google Scholar]
- 29.Fulci V, Colombo T, Chiaretti S, et al. Characterization of B- and T-lineage acute lymphoblastic leukemia by integrated analysis of MicroRNA and mRNA expression profiles. Genes Chromosom Cancer. 2009;48:1069–82. doi: 10.1002/gcc.20709. [DOI] [PubMed] [Google Scholar]
- 30.Loftus AF, Hsieh VL, Parthasarathy R. Modulation of membrane rigidity by the human vesicle trafficking proteins Sar1A and Sar1B. Biochem Biophys Res Commun. 2012;426:585–9. doi: 10.1016/j.bbrc.2012.08.131. [DOI] [PubMed] [Google Scholar]
- 31.Levy E, Harmel E, Laville M, et al. Expression of Sar1b enhances chylomicron assembly and key components of the coat protein complex II system driving vesicle budding. Arterioscler Thromb Vasc Biol. 2011;31:2692–9. doi: 10.1161/ATVBAHA.111.233908. [DOI] [PubMed] [Google Scholar]
- 32.Cefalù AB, Calvo PL, Noto D, et al. Variable phenotypic expression of chylomicron retention disease in a kindred carrying a mutation of the Sara2 gene. Metabolism. 2010;59:463–7. doi: 10.1016/j.metabol.2009.07.042. [DOI] [PubMed] [Google Scholar]
- 33.Genovese G, Ghosh P, Li H, et al. The tumor suppressor HINT1 regulates MITF and β-catenin transcriptional activity in melanoma cells. Cell Cycle. 2012;11:2206–15. doi: 10.4161/cc.20765. [DOI] [PubMed] [Google Scholar]
- 34.Zimoń M, Baets J, Almeida-Souza L, et al. Loss-of-function mutations in HINT1 cause axonal neuropathy with neuromyotonia. Nat Genet. 2012;44:1080–3. doi: 10.1038/ng.2406. [DOI] [PubMed] [Google Scholar]
- 35.Krützfeldt J, Rajewsky N, Braich R, et al. Silencing of microRNAs in vivo with ‘antagomirs’. Nature. 2005;438:685–9. doi: 10.1038/nature04303. [DOI] [PubMed] [Google Scholar]
- 36.Fontana L, Fiori ME, Albini S, et al. Antagomir-17-5p abolishes the growth of therapy-resistant neuroblastoma through p21 and BIM. PLoS ONE. 2008;3:e2236. doi: 10.1371/journal.pone.0002236. [DOI] [PMC free article] [PubMed] [Google Scholar]
- 37.Hu S, Huang M, Li Z, et al. MicroRNA-210 as a novel therapy for treatment of ischemic heart disease. Circulation. 2010;122:S124–31. doi: 10.1161/CIRCULATIONAHA.109.928424. [DOI] [PMC free article] [PubMed] [Google Scholar]
- 38.Kantarjian H, Thomas D, Wayne AS, O'Brien S. Monoclonal antibody-based therapies: a new dawn in the treatment of acute lymphoblastic leukemia. J Clin Oncol. 2012;30:3876–83. doi: 10.1200/JCO.2012.41.6768. [DOI] [PMC free article] [PubMed] [Google Scholar]
Associated Data
This section collects any data citations, data availability statements, or supplementary materials included in this article.
Supplementary Materials
Fig. S1 Receiver operating characteristic (ROC) curves of miR-210, minimal residual disease (MRD) and miR-210-MRD to predict the replase and induction failure of pediatric acute lymphoblastic leukemia (ALL).
Fig. S2 Event-free survival (EFS) and overall survival (OS) of the three risk groups of miR-210-MRD.
Fig. S3 Changes in intra-cellular levels of miR-210 of Reh and RS4;11 cell line after treated with agomir (a,c) and antagomir (b,d).
Table S1 Correlations of miR-210 expression with clinical characteristics.
Table S2 The independent prognostic significance of common clinical features including miR-210 expression.