

Abstract
BACH2, a B cell-specific transcriptional repressor, plays a significant role in B cell maturation. Despite a number of previous studies, the clinicopathological significance of BACH2 expression in diffuse large B cell lymphoma (DLBCL) remains to be established. The present study was performed to validate the significance of BACH2 expression as a predictor of prognosis in DLBCL. A total of 94 DLBCL cases were included in the present study. All were diagnosed between 2008 and 2011, and thorough clinical and pathological investigations were possible, including immunohistochemical analysis of BACH2. Eighteen cases were selected by positive MYC gene alteration (MYC+ group) according to cytogenetic study. The remaining 76 cases were subclassified into germinal center B cell phenotype (GCB group, 38 cases) or non-GCB phenotype (non-GCB group, 38 cases). There were no significant differences between the two groups with regard to clinical characteristics and outcomes. In the GCB group, 21 cases were judged to have high BACH2 expression, with 19 cases in the non-GCB group. In cases with high BACH2 expression in GCB and non-GCB groups, the 3-year overall survival (OS) rate was significantly shorter than that with low expression (71.7% vs 91.3%, P = 0.0256). In the MYC+ group, 15 cases had high BACH2 expression levels. Although overall the MYC+ group showed short survival time (3-year OS 35.0%), 3 out of 4 cases with low BACH2 expression are alive without disease relapse at the time of publication of this paper. In conclusion, BACH2 expression level is a promising predictor of prognosis for DLBCL.
Keywords: BACH2, diffuse large B-cell lymphoma, malignant lymphoma, MYC, prognostic factors
Diffuse large B-cell lymphoma (DLBCL) is the most common pathology of non-Hodgkin lymphoma.(1) More than half of all DLBCL patients can be cured with a rituximab-containing regimen,(1) while there is a subpopulation with poor prognosis for which more aggressive chemotherapy is ineffective.(2,3) There is consensus that DLBCL is a heterogeneous disease entity, and clinicopathological criteria for dividing DLBCL into subclassifications have been proposed. The most commonly used is the cell of origin (COO) classification, with division into germinal center B cell-like (GCB) phenotype and activated B cell phenotype (ABC) by gene expression profiling;(4) GCB-type DLBCL is associated with a better prognosis than ABC-type DLBCL. Several immunohistochemical criteria for dividing GCB-type and non-GCB type have also been reported, such as Hans' criteria;(5) however, Hans' criteria is unsatisfactory for subclassification of DLBCL into better and poorer prognosis groups in the rituximab era.(6,7) Therefore, it is important to investigate the novel clinicopathological factors that predict the clinical prognosis of DLBCL to optimize therapeutic strategies.
BACH2 is a transcription factor that is selectively expressed in B cells in certain stages of differentiation.(8) BACH2 is reported to be indispensable for somatic hypermutation and class switch recombination in normal B cell differentiation.(9–11) Moreover, Swaminathan et al. (2013) report that BACH2 is important for the rapid and efficient elimination of pre-B cells that have failed to undergo normal recombination of immunoglobulin heavy chain.(12) They also state that both activation of MYC oncogene and BACH2 inactivation are needed for leukemic transformation of pre-B cells. With regard to mature B cell malignancies, Sakane-Ishikawa et al. (2005) report that a high level of BACH2 expression in DLBCL is associated with better prognosis;(13) in contrast, Kobayashi et al. (2011) report that a BACH2 transcription level was significantly elevated in a case of aggressive mature B cell leukemia/lymphoma with alterations in both MYC and BACH2 genes.(14) These findings are inconsistent, and the significance of BACH2 gene expression in malignant transformation remains to be determined, especially among mature B cell malignancies.
Here, we analyze BACH2 expression in DLBCL by immunohistochemistry and investigate its clinicopathological significance. To our knowledge, there has been only one previous report which argued the association of BACH2 expression and clinical course in DLBCL.(14) Therefore, the present study was performed to contribute to our understanding of the significance of BACH2 in the genesis and progression of DLBCL.
Materials and Methods
Case selection
A total of 94 cases of DLBCL were included in the present study. These cases were selected from the list of de novo DLBCL diagnosed in our institutions between 2008 and 2012 according to the following criteria: patient's age ranging from 18 to 80 years, availability of pathological specimens for additional examination, and availability of medical records. Among them, 18 cases were shown to have MYC gene abnormalities by positive split signal of MYC on FISH or detection of translocation of MYC gene and immunoglobulin heavy or light chain gene in karyotype analysis. These cases were assigned to the MYC+ group. The remaining 76 cases were assigned to the GCB group or non-GCB group according to the phenotype determined by Hans' algorithm.(5) Finally, 38 cases in the GCB group, 38 cases in the non-GCB group and 18 cases in the MYC+ group were included in the present study.
We retrospectively reviewed the medical records of all patients with regard to clinical presentation, laboratory and radiological findings at diagnosis, treatment performed and clinical outcome. Laboratory findings included complete blood count, lactate dehydrogenase (LDH), C-reactive protein and soluble interleukin-2 receptor (sIL-2R). For determination of clinical stage, computed tomography was performed in all cases. Bone marrow biopsy and/or aspiration (including flow cytometry) was performed in most cases. Positron emission tomography or gallium scintigraphy was performed in some cases.
The present study was performed as a part of the Miyagi Study, a comprehensive epidemiological study of malignant lymphoma, including immunological and genetic information, constructed by a population-based registration system covering Miyagi Prefecture, Japan. This study was approved by the Institutional Review Board of each hospital. All procedures in the present study were performed in accordance with the Declaration of Helsinki.
Pathological examination
Tissue specimens were fixed in 10% formalin solution, routinely processed and embedded in paraffin. The sections were stained with H&E for microscopic examination. The histological subtypes were classified according to the criteria of the World Health Organization (4th edition, 2008).(1) In most cases, immunohistochemistry was performed using the following primary antibodies: CD3, CD5, CD10, CD20, CD45RA, CD79a, BCL2, BCL6, Ki-67 and MUM-1. GCB and non-GCB types were determined according to criteria presented by Hans et al.((5)).
Utilizing the remaining paraffin-embedded specimen described above, investigational immunohistochemical analyses for BACH2 (clone F69-2, rabbit) and MYC (clone Y69, rabbit) were performed. Some reactive small lymphocytes showed positive staining for BACH2 in each case, and they were used as internal positive controls. Cytoplasmic BACH2 expression was detected in all cases. The level of cytoplasmic BACH2 expression was defined as follows. More than half of the lymphoma cells showed equal to or stronger (high level) or weaker (low level) expression than positive control lymphocytes. Lymph nodes from a patient with grade 1 follicular lymphoma were used as external positive controls. The level of nuclear MYC expression was defined as follows. If more than half of the lymphoma cells were positive for MYC, it was judged as high level expression of MYC. Otherwise it was judged as low level expression of MYC. Lymph nodes from a patient with Burkitt lymphoma were used as external positive controls.
Cytogenetic examination
Karyotyping was performed by conventional methods using G-banding techniques on cells isolated from fresh tissue biopsies. Interphasic FISH for MYC was performed on sections used for conventional histological examination, as described elsewhere.(15) The analysis was performed using direct viewing on a standard fluorescence microscope.
Statistical analysis
Endpoints of interest were overall survival (OS) and progression-free survival (PFS). The end point of follow up was last contact or the date of death. The PFS was defined as the time from initial diagnosis to the first occurrence of progression, relapse after a response or death from any cause. The follow up of patients not experiencing one of these events was censored at the date of last contact. The OS was measured from the time of the initial diagnosis until death from any cause, with surviving patient follow up censored at the last contact date. The Mann–Whitney U-test, Fisher's exact test or the χ2-test was used to compare the clinicopathological features in various groups. Survival outcome was estimated using the Kaplan–Meier method and compared using the log-rank test. Univariate and multivariate analyses were done with the Cox proportional hazard regression model. All statistical analyses were performed using EZR (Saitama Medical Center, Jichi Medical University), which is a graphical user interface for R (The R Foundation for Statistical Computing, version 2.13.0).(16) More precisely, it is a modified version of R commander (version 1.6–3) that includes statistical functions that are frequently used in biostatistics. In all analyses, P < 0.05 was taken to indicate statistical significance.
Results
Clinicopathological features in association with BACH2-expression level in germinal center B cell-like and non-germinal center B cell-like groups
The clinical features of all cases in GCB and non-GCB groups are summarized in Table 1. The patients ranged in age from 20 to 80 years (median age 61 years), with male predominance (48 males and 28 females). Extranodal lesions were present in 14 cases (18.4%), and 32 cases (42.1%) had advanced disease. There was only 1 case with immunoblastic variant in the non-GCB group. Under the classification according to Hans' criteria, there were no significantly different features detected between the GCB and the non-GCB group.
Table 1.
Summary of clinicopathologial features of patients in GCB and non-GCB groups
| Characteristics | GCB and non-GCB groups, n | BACH2 expression |
Hans' criteria |
||||
|---|---|---|---|---|---|---|---|
| High, n | Low, n | P | GCB, n | non-GCB, n | P | ||
| Overall | 76 | 40 | 36 | 38 | 38 | ||
| Clinical information | |||||||
| Median age (range) [year] | 61 (20–80) | 61 (20–80) | 61.5 (42–74) | 0.523 | 61 (20–79) | 61 (38–80) | 0.733 |
| Age ≥60 years | 45 | 22 | 23 | 0.431 | 23 | 22 | 0.815 |
| Male/Female | 48/28 | 26/14 | 22/14 | 0.726 | 24/14 | 24/14 | 1 |
| Performance status 0–1/2–4 | 59/17 | 31/9 | 28/8 | 0.977 | 28/10 | 31/7 | 0.409 |
| Clinical stage I–II/III–IV | 44/32 | 21/19 | 23/13 | 0.315 | 23/15 | 21/17 | 0.642 |
| The presence of B symptoms | 12 | 7 | 5 | 0.666 | 5 | 7 | 0.529 |
| The presence of extranodal lesions | 14 | 10 | 4 | 0.119 | 10 | 4 | 0.0758 |
| IPI score 0–2/3–5 | 51/26 | 25/15 | 26/10 | 0.368 | 25/13 | 26/12 | 0.807 |
| Median LDH (range) [IU/L] | 275 (126–2116) | 285.5 (148–2116) | 274 (126–1964) | 0.534 | 279.5 (144–2116) | 274 (126–1476) | 0.237 |
| Median sIL-2R (range) [U/mL] | 1362 (234–22 564) | 1512.5 (257–21 373) | 1229.5 (234–22 564) | 0.832 | 1190 (234–21 373) | 2110 (309–22 564) | 0.157 |
| Pathological features | |||||||
| GCB/non-GCB | 38/38 | 21/19 | 17/19 | 0.646 | — | — | — |
| Positive MUM1 | 38/38 | 19 | 18 | 0.828 | 2 | 35 | <0.001 |
| Positive BCL2 | 52 | 29 | 23 | 0.420 | 23 | 29 | 0.139 |
| MIB-1 index ≥ 90% | 17 | 12† | 5 | 0.0811 | 8† | 9 | 0.831 |
| High MYC expression | 37 | 24 | 13 | 0.0375 | 22 | 15 | 0.246 |
| Treatment | |||||||
| R-CHOP (and related regimens) | 76 | 40 | 36 | NA | 38 | 38 | NA |
| Others | 0 | 0 | 0 | 0 | 0 | ||
| Outcome | 0.378 | ||||||
| Complete response | 58 | 28 | 30 | 0.0842 | 28 | 30 | |
| Partial response | 13 | 7 | 6 | 6 | 7 | ||
| Stable disease | 0 | 0 | 0 | 0 | 0 | ||
| Progressive disease | 5 | 5 | 0 | 4 | 1 | ||
| Relapse | 14 | 9 | 5 | 0.334 | 4 | 10 | 0.0758 |
| 3-year OS [%] | 80.8 | 71.7 | 91.3 | 0.0256 | 75.9 | 86.4 | 0.265 |
| 3-year PFS [%] | 71.0 | 62.5 | 80.3 | 0.0681 | 74.5 | 67.5 | 0.636 |
| Median follow-up time (range) [month] | 33.3 (0.2–66.3) | 31.7 (0.2–66.3) | 33.5 (4.7–64.7) | 0.775 | 31.1 (0.2–66.3) | 35.8 (3.3–64.7) | 0.623 |
In one case MIB-1 index was not assessed.
IPI, international prognostic index; LDH, lactate dehydrogenase; NA, not available; OS, overall survival; PFS, progression-free survival; sIL-2R, soluble inteleukin-2 receptor.
Representative immunohistochemical findings for BACH2 are shown in Figure 1. In all cases BACH2 is predominantly stained in cytoplasm. A total of 40 and 36 cases were subclassified into the high and low BACH2-expression groups, respectively (Table 1). The relationship between Hans' criteria and BACH2 expression, and the relationship between MUM1 and BACH2 expression, could not be detected. There were no significantly different features detected among the two groups, except that significantly more cases with high levels of BACH2-expression had high levels of MYC expression (Table 1).
Fig. 1.

Representative figures of high and low BACH2 expression determined by immunohistochemistry. (a,b) A case with high level of BACH2 expression (a, at low-power magnification; b, at high-power magnification). Lymphoma cells are homogeneously stained for BACH2. Cytoplasmic staining is dominant. (c,d) A case with low level of BACH2 expression (c), at low-power magnification; (d) at high-power magnification). Lymphoma cells were slightly stained for BACH2 in cytoplasm.
In 54 cases, karyotyping analyses of the lymphoma lesions were successfully performed (Table S1), and there were no cases in which chromosomal translocation including BACH2 gene (located at 6q15) was detected.
Association of clinical outcome with BACH2 expression levels in germinal center B cell-like and non-germinal center B cell-like groups
All patients were treated with rituximab-containing chemotherapy (Table 1). Overall treatment response was good and resulted in a 3-year OS rate of 80.8% and a 3-year PFS rate of 71.0%. After three years following diagnosis, there were no cases of relapse or death from any causes. Survival outcome is shown in Table 1 and Figure 2. There were no differences in survival outcome; however, more relapsed cases were confirmed in the non-GCB group, which could result in relatively short PFS. In cases with high BACH2-expression, 3-year OS rate was significantly shorter than that with low expression (71.7% vs 91.3%, P = 0.0256). The 3-year PFS was also shorter than that with low expression, although it was not significant (62.5% vs 80.3%, P = 0.0681).
Fig. 2.

Survival analyses of the patients among germinal center B cell phenotype (GCB) and non-GCB groups. (a,b) Overall survival (a) and progression-free survival (b) of each group. (c,d) Overall survival (c) and progression-free survival (d) according to BACH2 expression levels.
Univariate analysis of each clinical factor revealed that the presence of extranodal lesions, advanced clinical stage (III or IV), high serum LDH level and high international prognostic index (IPI) scores predicted significantly shorter OS time, and that the presence of B symptoms, the presence of extranodal lesions, advanced clinical stage and high IPI scores predicted significantly shorter PFS time (Table 2). As for pathological factors, high level expression of BACH2 showed a tendency of shorter OS time (Table 2). However, the multivariate analysis, including clinical stage, LDH, IPI scores, sIL-2R, MIB-1 index, and BACH2 expression, did not reveal significant factors predicting the prognosis (Table S2).
Table 2.
Univariate analyses of individual clinicopathological factors in GCB and non-GCB groups
| Comparision with risk factors | OS |
PFS |
||
|---|---|---|---|---|
| HR (95% CI) | P | HR (95% CI) | P | |
| Clinical factors | ||||
| Age (<60 vs ≥60 years) | 0.801 (0.241–2.660) | 0.717 | 1.650 (0.683–3.960) | 0.267 |
| B symptoms (abscent vs present) | 0.307 (0.0917–1.0200) | 0.0538 | 0.246 (0.0971–0.621) | 0.00294 |
| Extranodal lesions (abscent vs present) | 0.167 (0.0538–0.5210) | 0.00201 | 0.275 (0.109–0.694) | 0.00644 |
| Clinical stage (I + II vs III + IV) | 0.199 (0.0538–0.7360) | 0.0155 | 0.321 (0.128–0.805) | 0.0155 |
| serum LDH (normal vs elevated) | 0.105 (0.0135–0.8100) | 0.0306 | 0.507 (0.195–1.320) | 0.164 |
| PI score (0–2 vs 3–5) | 0.128 (0.0345–0.4720) | 0.00204 | 0.291 (0.120–0.704) | 0.00615 |
| sIL-2R (normal vs elevated) | NA | NA | 0.433 (0.101–1.870) | 0.262 |
| Pathological factors | ||||
| Hans' criteria (GCB vs non-GCB) | 1.954 (0.588–6.490) | 0.274 | 0.808 (0.335–1.950) | 0.636 |
| MIB-1 index (<90% vs ≥90%) | 0.377 (0.115–1.230) | 0.107 | 0.501 (0.197–1.270) | 0.146 |
| MUM1 expression (negative vs positive) | 0.490 (0.148–1.629) | 0.244 | 0.809 (0.335–1.950) | 0.638 |
| BCL2 expression (negative vs positive) | 0.840 (0.227–3.100) | 0.791 | 1.030 (0.394–2.670) | 0.956 |
| BACH2 expression levels (low vs high) | 0.209 (0.0458–0.9540) | 0.0433 | 0.422 (0.162–1.100) | 0.0769 |
| MYC expression level (low vs high) | 0.184 (0.0403–0.8430) | 0.0293 | 0.563 (0.230–1.380) | 0.209 |
CI, confidential interval; HR, hazard ratio; IPI, international prognostic index; LDH, lactate dehydrogenase; OS, overall survival; PFS, progression-free survival; sIL-2R, soluble inteleukin-2 receptor. NA, this cannot be calculated because no patients with normal sIL-2R died.
To elucidate the subgroups in which BACH2 can strongly predict the prognosis, we further analyzed the association between BACH2 expression levels and clinical outcome in various stratifications by log-rank analysis (Table 3 and Fig. 3). In any subgroups, a high level of BACH2 expression was associated with shorter survival time. In particular, a high level of BACH2 expression was a strong predictor of poor prognosis among the subgroups which had negative prognostic indicators such as higher serum LDH level, higher sIL-2R level and advanced clinical stage.
Table 3.
Stratified log-rank test for survival analysis in association with BACH2 expression level among GCB and non-GCB group
| Charateristics | BACH2 expression |
3-year OS (%) |
3-year PFS (%) |
|||||||
|---|---|---|---|---|---|---|---|---|---|---|
| High, n | Low, n | P | BACH2-high | BACH2-low | P | BACH2-high | BACH2-low | P | ||
| Clinical stage | I/II (n = 44) | 21 | 23 | 0.315 | 80.7 | 100 | 0.0595 | 73.1 | 91.3 | 0.144 |
| III/IV (n = 32) | 19 | 13 | 61.8 | 71.4 | 51.3 | 57.5 | ||||
| IPI score | 0–2 (n = 51) | 25 | 26 | 0.368 | 89.3 | 94.7 | 0.0864 | 76.4 | 82.3 | 0.122 |
| 3–5 (n = 25) | 15 | 10 | 46.7 | 75.0 | 40.0 | 78.7 | ||||
| LDH | Normal (n = 32) | 15 | 17 | 0.391 | 92.3 | 100 | 0.0624 | 68.9 | 86.9 | 0.100 |
| Elevated (n = 44) | 25 | 19 | 60.6 | 80.0 | 58.2 | 74.0 | ||||
| sIL-2R† | Normal (n = 15) | 6 | 9 | 0.325 | 100 | 100 | 0.0265 | 83.3 | 88.9 | 0.0628 |
| Elevated (n = 59) | 32 | 27 | 64.8 | 88.9 | 56.5 | 77.8 | ||||
| Hans' criteria | GCB (n = 38) | 21 | 17 | 0.646 | 63.2 | 90.9 | 0.0248 | 60.2 | 90.9 | 0.0789 |
| Non-GCB (n = 38) | 19 | 19 | 81.4 | 91.7 | 64.5 | 70.6 | ||||
| BCL2 | Positive (n = 52) | 29 | 23 | 0.420 | 69.7 | 93.3 | 0.0303 | 60.4 | 74.0 | 0.0708 |
| Negative (n = 24) | 11 | 13 | 81.8 | 87.5 | 72.7 | 84.6 | ||||
| MUM1 | Positive (n = 37) | 19 | 18 | 0.828 | 81.4 | 92.3 | 0.245 | 64.3 | 80.5 | 0.612 |
| Negative (n = 39) | 21 | 18 | 63.4 | 90.0 | 60.4 | 79.7 | ||||
| MIB-1 index‡ | ≥ 90% (n = 17) | 12 | 5 | 0.0811 | 54.5 | 84.0 | 0.214 | 46.9 | 75.0 | 0.251 |
| < 90% (n = 58) | 27 | 31 | 84.0 | 89.5 | 72.0 | 81.3 | ||||
| MYC expression | High (n = 37) | 24 | 13 | 0.0375 | 59.9 | 85.7 | 0.0480 | 57.6 | 83.3 | 0.365 |
| Low (n = 39) | 16 | 23 | 93.8 | 93.8 | 70.0 | 80.0 | ||||
In two cases sIL-2R was not assessed.
In one case MIB-1 index was not assessed.
IPI, international prognostic index; LDH, lactate dehydrogenase; OS, overall survival; PFS, progression-free survival; sIL-2R, soluble inteleukin-2 receptor.
Fig. 3.

Stratified analyses of the patients concering overall survival in association with BACH2 expression levels among germinal center B cell phenotype (GCB) and non-GCB groups. They are stratified by clinical stage (CS) (a), serum lactate dehydrogenase (LDH) (b), serum sIL-2R (c) and international prognostic index (IPI) score (d), respectively.
Analysis of MYC+ groups in association with BACH2 expression levels
The clinicopathological characteristics of the MYC+ group are shown in Table 4. The patients were aged from 41 to 80 years (median age, 65.5 years) with a male : female ratio of 8:10. More than half of all cases had advanced clinical stage and extranodal lesions, resulting in higher IPI scores. However, there were some cases with only localized diseases. The sIL-2R value was high in all cases. A total of 13 cases were classified into GCB phenotype by Hans' criteria. There was only one case with immunoblastic variant. In 12 cases, karyotyping analyses were successfully performed (Table S1), and there were no cases in which chromosomal translocation including BACH2 gene were shown.
Table 4.
Summary of clinicopathologial features of patients in MYC+ group
| Characteristics | MYC+, n | BACH2 expression |
||
|---|---|---|---|---|
| High, n | Low, n | P | ||
| Overall | 18 | 14 | 4 | |
| Clinical information | ||||
| Median age (range) [year] | 65.5 (41–80) | 64 (41–80) | 74.5 (54–78) | 0.281 |
| Age ≥60 years | 11 | 8 | 3 | 0.518 |
| Male/female | 8/10 | 7/7 | 1/3 | 0.375 |
| Performance status 0–1/2–4 | 7/11 | 5/9 | 2/2 | 0.605 |
| Clinical stage I–II/III–IV | 13/5 | 10/4 | 3/1 | 0.888 |
| The presence of B symtpoms | 4 | 4 | 0 | 0.225 |
| The presence of extranodal lesions | 11 | 8 | 3 | 0.518 |
| IPI score 0–2/3–5 | 8/10 | 5/9 | 3/1 | 0.163 |
| median LDH (range) [IU/L] | 327 (153–4620) | 327 (172–4620) | 372.5 (153–932) | 0.470 |
| median sIL-2R (range) [U/mL] | 1279 (350–9410) | 1285 (350–9410) | 1132.5 (568–3653) | 0.820 |
| Pathological features | ||||
| GCB/non-GCB | 13/5 | 10/4 | 3/1 | 0.888 |
| MIB-1 index ≥ 90% | 7 | 7 | 0 | 0.0704 |
| High MYC expression | 16 | 12 | 4 | 0.423 |
| Treatment | 0.598 | |||
| R-CHOP (and related regimens) | 15 | 11 | 4 | |
| Intensive chemotherapy | 2 | 2 | 0 | |
| Others | 1 | 1 | 0 | |
| Outcome | 0.748 | |||
| Complete response | 10 | 7 | 3 | |
| Paritial response | 5 | 4 | 1 | |
| Progressive disease | 1 | 1 | 0 | |
| Not assessable | 2† | 2† | 0 | |
| Relapse | 7 | 6 | 1 | 0.518 |
| 3-year OS [%] | 35.0 | 22.9 | 75.0 | 0.132 |
| 3-year PFS [%] | 33.7 | 21.4 | 75.0 | 0.122 |
| Median follow-up time (range) [month] | 14.2 (0.5–60.7) | 12.8 (0.5–60.7) | 37.1 (12.7–54.4) | 0.0776 |
The two patients died soon after the initiation of therapy before the evaluation for effectiveness.
IPI, international prognostic index; LDH, lactate dehydrogenase; OS, overall survival; PFS, progression-free survival; sIL-2R, soluble inteleukin-2 receptor.
All cases were treated with rituximab-containing chemotherapy, and in two cases, intensive chemotherapy was performed, taking into consideration the poor prognosis of MYC+ DLBCL.(2,3) The MYC+ group showed poor prognosis; 3-year OS and PFS rates were 35.0% and 33.7%, respectively (Fig. 4).
Fig. 4.
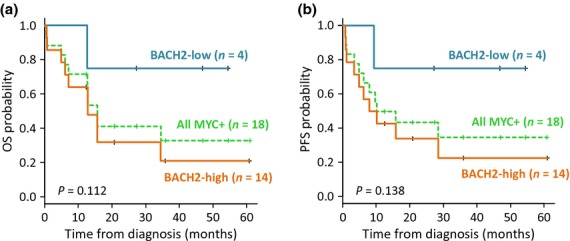
Survival analyses of the patients in MYC+ group. Overall survival (a) and progression-free survival (b) in association with BACH2 expression levels.
Immunostaining indicated that 14 cases had high-BACH2 expression and 4 cases had low-BACH2 expression. There was no significant difference between the two groups in terms of clinical characteristics. However, three out of the four cases with low-BACH2 expression levels had localized diseases. They were successfully treated with standard rituximab-containing chemotherapy and are alive without disease relapse. Although without significance, the tendency was shown that cases with low BACH2 expression could have longer survival time than those with high expression (Fig. 4).
Discussion
BACH2 is a B cell-specific transcriptional repressor, and its function is crucial for complete maturation of B cells toward plasma cells, which can produce antibodies with appropriate affinity for antigens.(9) Other functions of BACH2 within B cell maturation have also been reported. For example, Swaminathan et al. (2013) report that BACH2 is important for negative selection at the pre-B cell checkpoint. That is, BACH2 is strongly associated with apoptosis of pre-B cells, which fail to express normal pre-B cell receptor with proper immunoglobulin heavy chain rearrangement.(12) In addition, they show that BACH2 can inhibit malignant transformation by MYC oncogene activation in pre-B cells, which may explain several previous reports indicating that BACH2 functions as a tumor suppressor gene.(17) In contrast, there have been reports that BACH2 may play a role in genesis of aggressive B cell malignancy.(14,18) For example, Kobayashi et al. (2011) report a case of aggressive B cell lymphoma/leukemia in which IGHCδ–BACH2 fusion transcripts resulting from chromosomal rearrangements are identified.(14) In this case, they also detected IgH–MYC fusion transcripts and high levels of BACH2 mRNA. These seemingly conflicting observations could explain the complicated functions of BACH2 in the genesis of B cell malignancy, part of which may be associated with B cell maturation. The tumor suppressor function of BACH2 is mostly shown in pre-B cells, and it may be different in mature B cells.
In this study, we demonstrated that BACH2 expression may be a predictor of poorer prognosis in cases of DLBCL, especially in the high-risk group. We speculated on various possible reasons for these results. First, BACH2 may induce maturation arrest of malignant B cells. In the course of B cell maturation, timely and appropriate control of both BACH2 activation and suppression is important for differentiation toward plasma cells, which produce antibodies with proper antigen affinity.(11) The effects of sustained BACH2 expression in mature B cells remain to be determined; however, it may disturb B cell maturation because prompt attenuation of BACH2 expression is indispensable for the activation of factors that play key roles in differentiation toward plasma cells, such as PRDM1 and IRF4.(9,11) PRDM1, also known as BLIMP-1, is a master regulator of plasma cell differentiation and is required for terminal differentiation of B cells, and its expression is strongly suppressed by BACH2.(19) It has also been reported that repression of PRDM1 expression leads to disturbance of B cell differentiation toward plasma cells,(20) and that its expression in DLBCL tends to be absent or very weak in lymphoma cells.(21) Hence, constitutive expression of BACH2 may contribute to maturation arrest of lymphoma cells, leading to lymphomagenesis through pathological expansion of abnormal mature B cells. Second, BACH2 expression in DLBCL may reflect the biological conditions under oxidative stress. It has been reported that BACH2 expression is induced by oxidative stress,(22) and Peroja et al. (2012) report an association between high levels of oxidative stress in DLBCL and poor prognosis.(23) Oxidative stress may also induce nuclear translocation of BACH2 and lead to its functional activation;(24) however, this could be disrupted in malignancies. This was deduced from the previous report by Yoshida et al. indicating that nuclear translocation of BACH2 is suppressed by its phosphorylation at a specific locus that is important for regulation of BACH2 subcellular localization in chronic myeloid leukemia cells.(25)
Sakane-Ishikawa et al. (2005) report that strong BACH2 expression is associated with better prognosis.((13) This is the converse of our observations, for which there are several possible explanations as described below. First, all of the cases included in this study were treated with rituximab-containing chemotherapy. Although Sakane-Ishikawa et al. do not mention therapeutic strategy, in terms of case collection described from 1999 to 2003 rituximab was unavailable for most cases. As prognostic markers are associated with therapeutic modalities, the results of previous studies are not always applicable in patients undergoing modern treatments. Second, the patient populations could be partially different from those of the present study. In this study, the survival outcome is rather favorable; this could be due to the relatively small number of cases with exclusive extranodal lesions. Nevertheless, we feel that the patient population in this study was adequately selected considering poorer prognosis in the groups of advanced stage, higher IPI scores, and higher serum levels of LDH and sIL-2R.
Diffuse large B cell lymphoma with MYC translocation has been reported to have a very poor prognosis with standard rituximab-containing chemotherapy, such as the R-CHOP regimen,(2,3) and a standard therapeutic strategy for such cases remains to be established. In this study, the cases in the MYC+ groups had shorter survival time compared with the GCB and the non-GCB groups. However, it is noteworthy that some cases in the MYC+ groups were successfully treated with R-CHOP regimen without relapse or refractoriness, and most had lower BACH2 expression levels. These observations suggest that a low level of BACH2 expression may be a predictor of better prognosis in MYC+ DLBCL. That is, intensive chemotherapy could be omitted in MYC+ DLBCL cases with low levels of BACH2 expression, although this could not be confirmed due to the small number of cases.
In conclusion, we demonstrated that low expression levels of BACH2 are associated with longer survival time in DLBCL. However, further clinicopathological analyses are required to elucidate the role of BACH2 expression in prediction of clinical prognosis as well as pathogenesis of DLBCL.
Acknowledgments
We thank the staff of the Department of Hematology and Rheumatology, Tohoku University for helpful discussions. This work was supported by Grants-in-Aid for Scientific Research from the Japan Society for the Promotion of Science (JSPS KAKENHI No. 24590677).
Disclosure Statement
The authors have no conflict of interest.
Supporting Information
Additional supporting information may be found in the online version of this article:
Table S1 G-banding analyses of all the cases.
Table S2 Multivariate analysis of individual clinicopathological factors in germinal center B cell phenotype (GCB) and non-GCB groups.
References
- 1.Isaacson PG, Chott A, Ott G, Stein H. Diffuse large B-cell lymphoma, not otherwise specified. In: Stein H, Warnke RA, Chan WC, et al., editors. WHO Classification of Tumours of Haematopoietic and Lymphoid Tissues. 4th edn. Lyon: IARC; 2008. pp. 233–7. [Google Scholar]
- 2.Cuccuini W, Briere J, Mounier N, et al. MYC+ diffuse large B-cell lymphoma is not salvaged by classical R-ICE or R-DHAP followed by BEAM plus autologous stem cell transplantation. Blood. 2012;119:4619–24. doi: 10.1182/blood-2012-01-406033. [DOI] [PMC free article] [PubMed] [Google Scholar]
- 3.Savage KJ, Johnson NA, Ben-Neriah S, et al. MYC gene rearrangements are associated with a poor prognosis in diffuse large B-cell lymphoma patients treated with R-CHOP chemotherapy. Blood. 2009;114:3533–7. doi: 10.1182/blood-2009-05-220095. [DOI] [PubMed] [Google Scholar]
- 4.Alizadeh AA, Eisen MB, Davis RE, et al. Distinct types of diffuse large B-cell lymphoma identified by gene expression profiling. Nature. 2000;403:503–11. doi: 10.1038/35000501. [DOI] [PubMed] [Google Scholar]
- 5.Hans CP, Weisenburger DD, Greiner TC, et al. Confirmation of the molecular classification of diffuse large B-cell lymphoma by immunohistochemistry using a tissue microarray. Blood. 2004;103:275–82. doi: 10.1182/blood-2003-05-1545. [DOI] [PubMed] [Google Scholar]
- 6.Benesova K, Forsterova K, Votavova H, et al. The Hans algorithm failed to predict outcome in patients with diffuse large B-cell lymphoma treated with rituximab. Neoplasma. 2013;60:68–73. doi: 10.4149/neo_2013_010. [DOI] [PubMed] [Google Scholar]
- 7.Castillo JJ, Beltran BE, Song MK, et al. The Hans algorithm is not prognostic in patients with diffuse large B-cell lymphoma treated with R-CHOP. Leuk Res. 2012;36:413–7. doi: 10.1016/j.leukres.2011.12.012. [DOI] [PubMed] [Google Scholar]
- 8.Muto A, Hoshino H, Madisen L, et al. Identification of Bach2 as a B-cell-specific partner for small maf proteins that negatively regulate the immunoglobulin heavy chain gene 3′ enhancer. EMBO J. 1998;17:5734–43. doi: 10.1093/emboj/17.19.5734. [DOI] [PMC free article] [PubMed] [Google Scholar]
- 9.Muto A, Tashiro S, Nakajima O, et al. The transcriptional programme of antibody class switching involves the repressor Bach2. Nature. 2004;429:566–71. doi: 10.1038/nature02596. [DOI] [PubMed] [Google Scholar]
- 10.Ochiai K, Muto A, Tanaka H, Takahashi S, Igarashi K. Regulation of the plasma cell transcription factor Blimp-1 gene by Bach2 and Bcl6. Int Immunol. 2008;20:453–60. doi: 10.1093/intimm/dxn005. [DOI] [PubMed] [Google Scholar]
- 11.Muto A, Ochiai K, Kimura Y, et al. Bach2 represses plasma cell gene regulatory network in B cells to promote antibody class switch. EMBO J. 2010;29:4048–61. doi: 10.1038/emboj.2010.257. [DOI] [PMC free article] [PubMed] [Google Scholar]
- 12.Swaminathan S, Huang C, Geng H, et al. BACH2 mediates negative selection and p53-dependent tumor suppression at the pre-B cell receptor checkpoint. Nat Med. 2013;19:1014–22. doi: 10.1038/nm.3247. [DOI] [PMC free article] [PubMed] [Google Scholar]
- 13.Sakane-Ishikawa E, Nakatsuka S, Tomita Y, et al. Prognostic significance of BACH2 expression in diffuse large B-cell lymphoma: a study of the Osaka Lymphoma Study Group. J Clin Oncol. 2005;23:8012–7. doi: 10.1200/JCO.2005.02.1626. [DOI] [PubMed] [Google Scholar]
- 14.Kobayashi S, Taki T, Chinen Y, et al. Identification of IGHCdelta-BACH2 fusion transcripts resulting from cryptic chromosomal rearrangements of 14q32 with 6q15 in aggressive B-cell lymphoma/leukemia. Genes Chromosom Cancer. 2011;50:207–16. doi: 10.1002/gcc.20845. [DOI] [PubMed] [Google Scholar]
- 15.Tibiletti MG. Specificity of interphase fluorescence in situ hybridization for detection of chromosome aberrations in tumor pathology. Cancer Genet Cytogenet. 2004;155:143–8. doi: 10.1016/j.cancergencyto.2004.03.005. [DOI] [PubMed] [Google Scholar]
- 16.Kanda Y. Investigation of the freely available easy-to-use software ‘EZR’ for medical statistics. Bone Marrow Transplant. 2013;48:452–8. doi: 10.1038/bmt.2012.244. [DOI] [PMC free article] [PubMed] [Google Scholar]
- 17.Sasaki S, Ito E, Toki T, et al. Cloning and expression of human B cell-specific transcription factor BACH2 mapped to chromosome 6q15. Oncogene. 2000;19:3739–49. doi: 10.1038/sj.onc.1203716. [DOI] [PubMed] [Google Scholar]
- 18.Turkmen S, Riehn M, Klopocki E, Molkentin M, Reinhardt R, Burmeister T. A BACH2-BCL2L1 fusion gene resulting from a t(6;20)(q15;q11.2) chromosomal translocation in the lymphoma cell line BLUE-1. Genes Chromosom Cancer. 2011;50:389–96. doi: 10.1002/gcc.20863. [DOI] [PubMed] [Google Scholar]
- 19.Igarashi K, Ochiai K, Muto A. Architecture and dynamics of the transcription factor network that regulates B-to-plasma cell differentiation. J Biochem. 2007;141:783–9. doi: 10.1093/jb/mvm106. [DOI] [PubMed] [Google Scholar]
- 20.Tunyaplin C, Shaffer AL, Angelin-Duclos CD, Yu X, Staudt LM, Calame KL. Direct repression of prdm1 by Bcl-6 inhibits plasmacytic differentiation. J Immunol. 2004;173:1158–65. doi: 10.4049/jimmunol.173.2.1158. [DOI] [PubMed] [Google Scholar]
- 21.Tam W, Gomez M, Nie K. Significance of PRDM1beta expression as a prognostic marker in diffuse large B-cell lymphomas. Blood. 2008;111:2488–9. doi: 10.1182/blood-2007-09-111385. [DOI] [PubMed] [Google Scholar]
- 22.Muto A, Tashiro S, Tsuchiya H, et al. Activation of Maf/AP-1 repressor Bach2 by oxidative stress promotes apoptosis and its interaction with promyelocytic leukemia nuclear bodies. J Biol Chem. 2002;277:20724–33. doi: 10.1074/jbc.M112003200. [DOI] [PubMed] [Google Scholar]
- 23.Peroja P, Pasanen AK, Haapasaari KM, et al. Oxidative stress and redox state-regulating enzymes have prognostic relevance in diffuse large B-cell lymphoma. Exp Hematol Oncol. 2012;1:2. doi: 10.1186/2162-3619-1-2. [DOI] [PMC free article] [PubMed] [Google Scholar]
- 24.Tashiro S, Muto A, Tanimoto K, et al. Repression of PML nuclear body-associated transcription by oxidative stress-activated Bach2. Mol Cell Biol. 2004;24:3473–84. doi: 10.1128/MCB.24.8.3473-3484.2004. [DOI] [PMC free article] [PubMed] [Google Scholar]
- 25.Yoshida C, Yoshida F, Sears DE, et al. Bcr-Abl signaling through the PI-3/S6 kinase pathway inhibits nuclear translocation of the transcription factor Bach2, which represses the antiapoptotic factor heme oxygenase-1. Blood. 2007;109:1211–9. doi: 10.1182/blood-2005-12-040972. [DOI] [PubMed] [Google Scholar]
Associated Data
This section collects any data citations, data availability statements, or supplementary materials included in this article.
Supplementary Materials
Table S1 G-banding analyses of all the cases.
Table S2 Multivariate analysis of individual clinicopathological factors in germinal center B cell phenotype (GCB) and non-GCB groups.