

Abstract
Macrophage inhibitory factor 1 (MIC1) is frequently altered in various cancers. The aim of this study was to investigate the clinical significance of MIC1 for esophageal squamous cell carcinoma (ESCC). Serum MIC1 of 286 ESCC and 250 healthy subjects was detected, the diagnostic performance was assessed and compared with SCC, CEA, CA199 and CA724, and the value as a prognostic indicator was also evaluated. The expression of MIC1 in ESCC cell lines, tissues were detected, and the inhibition of MIC1 antibody on ESCC was carried out in vitro and in vivo. The results showed that the serum MIC1 of ESCC was significantly higher than normal groups (P < 0.001), and was positively associated with tumor invasion (P = 0.030) as well as lymph node metastasis (P = 0.007). The sensitivity of MIC1 was significantly better than SCC, CEA, CA199 and CA724, especially for stage I ESCC. Patients with higher serum MIC1 also had a poorer prognosis in relapse-free (P = 0.050) and tumor-specific survival (P = 0.005). In vitro studies showed that the expression of MIC1 was upregulated in 37.5% (3/8) ESCC cell lines and 45% (18/40) tissues, and the transcription of MIC1 in tumor tissues was significantly higher than paired adjacent normal tissues (P = 0.001). The antibody of MIC1 inhibited the tumor growth (P < 0.001), and showing preference for tumor tissues in xenograft model. The decreased formation of neovascularization lumen may be involved in the mechanism. We conclude that MIC1 plays an important role in the progression of ESCC and can serve as a potential biomarker and therapeutic target for ESCC.
Keywords: Diagnosis, esophageal squamous cell carcinoma, macrophage inhibitory factor 1, prognosis, target
Even though the mortality and incidence rate for esophageal cancer (EC) have decreased over the last two decades, likely due to improved nutritional status and advances in detection and treatment.(1,2) Esophageal cancer is however, still one of the common malignant tumors in China, and accounts for 60–70% of the world's total EC deaths and 50% of the world's total new EC patients.(3,4) Notably, esophageal squamous cell carcinoma (ESCC) is the predominant histological type found in China. Due to the lack of obvious symptoms in early stage ESCC, patients with ESCC are frequently diagnosed only after reaching advanced stages. The 5-year survival rate after surgical treatment is approximately 25–30%. However, surgical treatment operated at early stages for ESCC may increase the 5-year survival rate to 70%.(5,6) There is a lack of non-invasive markers for the diagnosis and prognosis of ESCC. Tumor markers such as SCC, CEA, CA199 and CA724, were often used as EC markers in clinical settings, but the effects were limited. Therefore, the search for more valuable ESCC associated markers, especially those of significance in the early stages of ESCC, has become an important subject of the EC study.
Macrophage inhibitory factor 1 (MIC1), also known as growth differentiation factor 15 (GDF15), is an important member of transforming growth factor-β (TGF-β) cytokine super-family.(7–9) MIC1 is weakly and stably expressed in most tissues under normal conditions but is substantially upregulated under pathological conditions such as injury, inflammation and various cancers.(10–12) Although its precise biological mechanisms are not well understood, MIC1 has been suggested to be involved in inflammation, apoptosis and tumorigenesis.(13) MIC1 has been found to be significantly increased in many tumor types, including breast, prostate and gastrointestinal tumors.(14–16) Furthermore, increased level of MIC1 has been found to be correlated strongly with the progression of these tumors.(17) Thus, the level of serum MIC1 was considered as a potential biomarker.(18–22) However, there is no established-association of MIC1 with either the detection or prognosis of ESCC, and any clues for the function of MIC1 in ESCC. Furthermore, MIC1 protein is secreted into the blood circulation and acts as a cytokine,(7,23) neutralizing the MIC1 by the antibody may play a role in the treatment of ESCC.
In the present study, we aimed to investigate the clinical significance of MIC1 in the diagnosis and treatment of ESCC. We first analyzed the level of MIC1 in ESCC serum samples and evaluated the diagnostic value of serum MIC1 and explored its prognostic value in a follow-up study. Then we analyzed MIC1 expression in tumor cell lines and tissues and further identified the roles of MIC1 in progression of ESCC. Finally, for the first time, we investigated the treatment value of anti-MIC1 antibody against the ESCC.
Materials and Methods
Study population and sample preparation
A total of 286 ESCC patients diagnosed between 2009 and 2011 (cancer institute and hospital, Chinese Academy of Medical Sciences; CICAMS) and 250 healthy age- and gender-matched subjects (by physical examination) were recruited (Fig. S1; Table 1). Subjects with injury were excluded from this project.
Table 1.
Characteristics of subjects with esophageal squamous cell carcinoma (ESCC) and normal controls
| Variable | Serum samples (preoperative) |
P | Serum samples (postoperative) |
Serum samples (relapse) |
Paired tissue samples |
|
|---|---|---|---|---|---|---|
| Cases (n = 286) | Controls (n = 250) | Cases (n = 110) | Cases (n = 20) | Cases (n = 80) | ||
| Gender (n) | ||||||
| Male (%) | 184 (64.3) | 148 (59.2) | 0.222 | 77 (70.0) | 14 (70.0) | 54 (67.5) |
| Female (%) | 102 (35.7) | 102 (40.9) | 33 (30.0) | 6 (30.0) | 26 (32.5) | |
| Age (years) | ||||||
| ≤60 (%) | 149 (52.1) | 139 (55.6) | 0.417 | 50 (45.5) | 12 (60.0) | 29 (36.3) |
| >60 (%) | 137 (47.9) | 111 (44.4) | 60 (54.5) | 8 (40.0) | 51 (63.7) | |
| Stage (n) | ||||||
| I (%) | 48 (16.8) | 17 (15.5) | 2 (10.0) | 13 (16.3) | ||
| II (%) | 107 (37.4) | 50 (45.5) | 8 (40.0) | 29 (36.3) | ||
| III (%) | 94 (32.9) | 43 (39.1) | 10 (50.0) | 38 (47.5) | ||
| IV (%) | 37 (12.9) | |||||
P-values were determined using a two-sided χ2 test.
Serum samples were collected before any treatment for all subjects, 1 month post-surgery for 110 out of 249 stage I–III ESCC patients undergoing resection without inflammatory complications, and for 20 relapse patients from the 110 cases. A total of 92 patients undergoing radical resection had follow-up data (average, 30 months; range, 8–50 months). Survival data were obtained from medical records and the study ends recurred as determined by imaging and death from tumor-specific causes. Deaths from other causes were treated as uncensored cases.
A total of 80 corresponding paired cancerous and matched adjacent normal esophageal mucosa tissues were collected from above 249 stage I–III ESCC patients undergoing resection.
The histopathological type and the stage of cancer were determined according to the criteria of the World Health Organization classification. This study has obtained human research ethics approval from the Ethics Committee of CICAMS.
Cell lines and tissue microarrays
One normal esophageal cell line Het-1A, human umbilical vein endothelial cells (HUVECs; both purchased from ATCC), and eight ESCC cell lines, EC9706, S4 (both established in our laboratory),(24,25) KYSE30, KYSE150, KYSE-180, KYSE410, KYSE450, KYSE510 (gifts from Dr Y. Shimada, First Department of Surgery, Kyoto University, Kyoto, Japan),(26) were used in our present study. ESCC cell lines were maintained in RMPI-1640 with 10% calf serum at 37°C with 5% CO2.
Tissue microarrays (TMA) have been constructed by our lab as described previously.(27) All cancerous (40 cases) and normal esophageal tissue (five cases) specimens from ESCC patients were histologically reviewed by pathologists. The mean percentage value of the two cores was considered representative of one tumor. MIC1 expression was considered positive if more than 25% of cells showed weak to intense staining within each cylinder.
Quantification of protein by immunoassay and western blot
The levels of serum MIC1 and secreted MIC1 from cell lines were measured using a sensitive in house sandwich ELISA produced by CICAMS as detailed under Supplementary Methods (Data S1), of which the detection limit level was 20 pg/mL and the coefficient of variation was <10%. All samples were assayed in duplicate. Cell and tissue lysates were obtained and performed western blotting using mouse monoclonal anti-MIC1 antibody (7C7, one of self-developed anti-MIC1 high-affinity antibodies; Patent Number: CN201110230894.X). Serum level of CEA, CA199 and CA724 was detected by the related kit (Roche, Basel, Switzerland). Serum level of SCC was detected by SCC assay kit (Abbott Diagnostics, Abbott Park, IL, USA).
Quantification of mRNA by real-time RT-PCR
Total RNA of cancerous and matched normal tissues was extracted using TRIzol (Invitrogen, Carlsbad, CA, USA). Reverse transcription to synthesize the first strand of cDNA was performed with M-MLV reverse transcriptase (Promega, Madison, WI, USA). The resulting cDNA was then subjected to real-time quantitative PCR for the evaluation of the relative mRNA levels of MIC1 and GAPDH (as an internal control) with the following primers: MIC1 forward: 5′-GGTGCTCATTCAAAAGACCGA-3′ and reverse: 5′-CATTCCA CAGGGCAGGACA-3′.GAPDH forward: 5′-CTCCTCCTG TTCGACAGTCAGC-3′ and reverse: 5′-CCCAATACGACCAAATCCGTT-3′. The Ct (threshold cycle) value of each sample was calculated from the threshold cycles with the instrument's software (StepOne Software v2.1; Applied Biosystems, Foster City, CA, USA), and the relative expression of MIC1 mRNA was normalized to the GAPDH value.
In vivo xenograft experiment
All mouse studies were performed in accordance with approval from the hospital Animal Ethics Committee. BALB/c nude female mice were obtained from Vital River Laboratories (Beijing, China) and used at 5–6 weeks old. ESCC Cell line S4 was inoculated into the hypoderm of nude mouse armpit, 5 × 10⁶cells/mouse. In the experiments designed to inhibit tumor growth, mice were randomly divided into three groups at tumor volume about 100 mm3 (2 mg/kg, 10 mg/kg anti-hMIC1 antibody 7C7 and mIgG control, n = 10). The animals were administered intraperitoneally and observed twice a week until sacrificed at 32 days after tumor inoculation. The tumor volume (mm3) was calculated as width2 × length/2. Tumor growth inhibition was calculated as (1−average tumor weight in experimental group/average tumor weight in control group) × 100%.
In the experiments designed to analyze the distributions of the antibody, mono-functional dyes dylight755 were conjugated to anti-MIC1 antibody 7C7 by labeling Kits (Pierce, Rockford, IL, USA). Three tumor-bearing mice at tumor volume about 1000 mm3 dosed for 2 mg/kg labeled antibody (IP and IT, IP: intraperitoneal injection, IT: intratumor injection) and control (IP). Imaging was performed at 3 h and 3 days after antibody injection. Mice were anesthetized with isoflurane and placed in the light-tight chamber of the IVIS Spectrum imaging system (Caliper Life Sciences, Hopkinton, MA, USA). Excitation occurred at 750 nm; macroscopic fluorescence was detected at 800 nm.
Inhibition of cell proliferation in vitro
In vitro inhibition of cell proliferation was conducted on S4 cell line and HUVECs, S4 cells and HUVECs in the logarithmic growth phase were dispersed (50 000 cells/mL) and plated into a 96-well culture plate (0.1 mL per well), which was inoculated for 6 h at 37°C. S4 cells were incubated with three different concentrations (1, 10 and 100 ng/mL) of anti-MIC1 antibody and 100 ng/mL mIgG. Cisplatin (6.3 μg/mL) was set as a positive control, whereas RPMI 1640 were set as negative control. HUVECs cells were incubated with 2.5 ng/mL MIC1 and 50 ng/mL anti-MIC1 antibody, respectively and simultaneously. After 72 h, cells were counted by 3-[4,5-cimethylthiazol-2-yl]-2,5-diphenyl tetrazolium bromide (MTT) assay.
Histopathological and immunohistochemical examination
Sections which stained with Hematoxylin and eosin were processed following a routine procedure and reviewed by a pathologist. For the immunohistochemistry (IHC), Human Von Willebrand factor (VWF) staining was carried out for tissues of S4 transplanted tumor with a rabbit polyclonal antibody (1:100; sc-14014; Santa Cruz Biotechnology, Santa Cruz, CA, USA) and Microvessel density (MVD) was determined by methods reported by Weidner.(28) MIC1 staining was carried out for TMA with rabbit anti-human MIC1 polyclonal antibody (1:200; self-developed). The protocol was detailed under Supplementary methods (Data S2 and S3).
Statistical analysis
The Mann–Whitney U-test and Wilcoxon test were used to compare the level of MIC1 among all groups and each pair of groups. Spearman bivariate correlation analysis was used to analyze the correlation. The long-rank test was used to compare survival curves and Cox proportional hazards model was used for prognostic analysis. Variables that achieved statistical significance (P < 0.05) or those that were close to significance (P < 0.1) by univariate analysis were subsequently included in the multivariate analysis. The statistical analyses were performed with the Statistical Package for the Social Sciences, version 13.0 (SPSS Inc., Chicago, IL, USA), and a two-sided P-value <0.05 was considered to be statistically significant.
Results
Macrophage inhibitory factor 1 levels are elevated in serum samples of esophageal squamous cell carcinoma
We detected increased levels of MIC1 in the serum of ESCC patients compared with healthy controls (P < 0.001; Fig. 1a). The serum MIC1 levels varied by Tumor Node Metastasis (TNM) staging (Fig. 1b) and were positively correlated with TNM staging as revealed by Spearman bivariate correlation analysis (P = 0.009, r = 0.154). Data on the depth of tumor invasion and lymph node metastasis were available in 249 cases (who had surgery) out of the 286 ESCC patients, among which the level of MIC1 in the T3–4 stage group was significantly higher than that in T1–2 group (P = 0.030; Fig. 1c) and that of N1–3 was significantly higher than that in N0 group (P = 0.007; Fig. 1d). The results also showed that increased levels of MIC1 were not significantly correlated with age, gender, or remote metastasis.
Fig. 1.
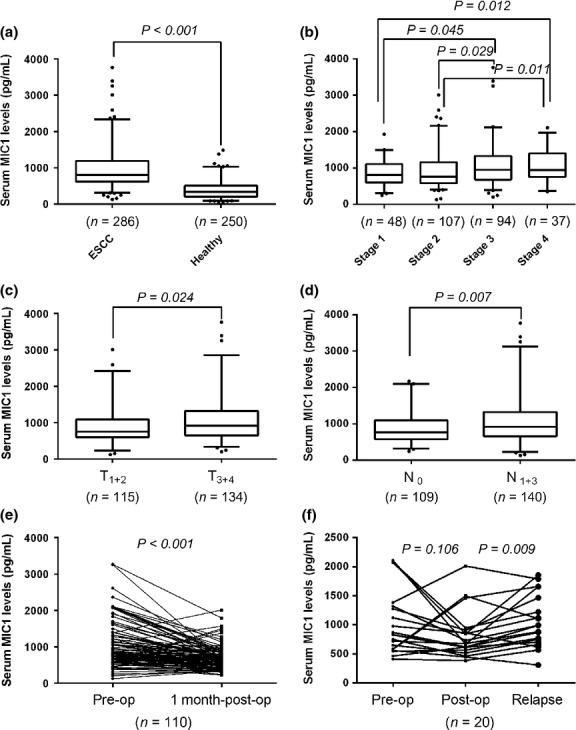
Level of macrophage inhibitory factor 1 (MIC1) in serum samples. The number of cases for each group is indicated below the x-axis. In the box plots, the lines denote the 2.5th, 25th, median, 75th and 97.5th percentiles for each. (a) Serum MIC1 in healthy subjects and esophageal squamous cell carcinoma (ESCC) patients. (b) Serum MIC1 in ESCC patients grouped by tumor node metastasis (TNM) stage. (c) Serum MIC1 classified according to T stage. (d) Serum MIC1 classified according to lymph node metastasis. (e) Serum MIC1 of ESCC patients before (pre-op) and 1 month after (1 month post-op) surgical resection. (f) Serum MIC1 of relapsed ESCC patients and corresponding pre-op and post-op MIC1 level.
Serum macrophage inhibitory factor 1 was decreased after surgical removal and increased at relapse
Among the 249 patients who had surgery, we collected serum from 110 of those patients 1 month after surgery and compared the MIC1 levels with those prior to surgery. Additionally, we collected serum from 20 relapse patients and compared the MIC1 levels with that 1 month after surgery. Strikingly, serum levels of MIC1 were significantly reduced in the postoperative samples (median, 641.3 pg/mL; range, 221.1–2012.3) when compared with their pre-operative samples (median, 811.8 pg/mL; range, 124.9–3257.4, P < 0.001; Fig. 1e), and serum levels of MIC1 were significantly increased in the samples of relapse patients (median, 990.5 pg/mL; range, 309.3–1868.4) when compared with their postoperative samples (median, 701.0 pg/mL; range, 386.4–2012.3, P = 0.006; Fig. 1f).
Serum macrophage inhibitory factor 1 as a potential diagnosis marker in esophageal squamous cell carcinoma
Using the 250 normal samples as negative controls, the receiver operating characteristic (ROC) curve of MIC1, SCC, CA199, CEA and CA724 for ESCC is shown in Figure 2(a). The area under the ROC curve of the MIC1 is higher than that of SCC, CA199, CEA and CA724 (P < 0.001; Fig. 2a). The MIC1 threshold for diagnosis of esophageal cancer is set at 1000 pg/mL based on mean plus three standard deviations of healthy subjects, for the sake of usability in clinical settings. The sensitivity of MIC1 for diagnosis of ESCC was higher than that of SCC, CEA, CA199 and CA724 in a case of comparable specificity (Fig. 2a). Notably, the positive detection rate of MIC1 was 39.6% (19/48) in early-stage patients of ESCC (stages I), whereas only 6 of 48 early-stage patients were found to be positive for at least one of the other four markers suggesting that MIC1 may be used as a candidate marker for detecting early-stage ESCC.
Fig. 2.

Role of serum macrophage inhibitory factor 1 (MIC1) in the diagnosis and prognosis of esophageal squamous cell carcinoma (ESCC). (a) Receiver operating characteristic (ROC) curve analysis for MIC1, SCC, CEA, CA199 and CA724 as diagnostic markers of ESCC. (b,c) Relapse-free survival and tumor-specific survival curves grouped by the median levels of serum MIC1 in patients before surgery. MIC1-H, MIC1 high level; MIC1-L, MIC1 low level.
Serum macrophage inhibitory factor 1 correlates with the prognosis of esophageal squamous cell carcinoma
Follow-up data were acquired for 92 patients who had undergone surgical resection. Patients were grouped into pre-operative low-level and pre-operative high-level according to median levels. A log-rank test suggested that patients with higher serum MIC1 had a trend to poorer prognosis (relapse-free survival, P = 0.047; tumor-specific survival, P = 0.002; Fig. 2b,c). We performed a univariate Cox regression analysis on the patient's relapse-free and tumor-specific survival and found that the depth of tumor invasion and lymph node metastasis were also significantly correlated. However, age, gender, smoking and alcohol consumption showed no correlation. A multivariable Cox regression analysis revealed that serum MIC1 was an independent factor contributing to prognosis after correction for all of these factors (hazard ratio of recurrence: 1.789 [95%CI, 1.003–3.190], P = 0.050; hazard ratio of tumor death: 2.625 [95%CI, 1.347–5.115], P = 0.005; Table 2).
Table 2.
Univariate and multivariate Cox proportional hazard modeling of factors associated with relapse-free survival and tumor-specific survival in esophageal squamous cell carcinoma (ESCC) patient group (n = 92)
| Variable | Subset | Univariate analysis |
Multivariate analysis |
||||
|---|---|---|---|---|---|---|---|
| Hazard Ratio | 95% CI | P-value | Hazard Ratio | 95% CI | P-value | ||
| Relapse-free survival | |||||||
| Age (years) | >60/≤60 | 0.868 | 0.492–1.531 | 0.618 | NA | ||
| Gender | Male/female | 1.202 | 0.659–2.193 | 0.554 | NA | ||
| Smoking status | Yes/no | 1.323 | 0.744–2.351 | 0.319 | NA | ||
| Drinking status | Yes/no | 1.204 | 0.682–2.126 | 0.507 | NA | ||
| T stage | T3+4/T1+2 | 2.366 | 1.341–4.174 | 0.003 | 1.539 | 0.816–2.903 | 0.185 |
| Lymph node metastasis | Yes/no | 4.686 | 2.641–8.316 | <0.001 | 4.955 | 2.501–9.817 | <0.001 |
| MIC1 | High/low | 1.739 | 0.977–3.094 | 0.047 | 1.789 | 1.003–3.190 | 0.050 |
| Tumor-specific survival | |||||||
| Age (years) | >60/≤60 | 0.749 | 0.394–1.387 | 0.338 | NA | ||
| Gender | Male/female | 1.167 | 0.594–2.295 | 0.659 | NA | ||
| Smoking status | Yes/no | 1.319 | 0.742–2.345 | 0.321 | NA | ||
| Drinking status | Yes/no | 1.483 | 0.788–2.791 | 0.206 | NA | ||
| T stage | T3+4/T1+2 | 2.310 | 1.231–4.335 | 0.010 | 1.545 | 0.760–3.143 | 0.232 |
| Lymph node metastasis | Yes/no | 5.915 | 3.141–11.139 | <0.001 | 5.720 | 2.376–13.772 | <0.001 |
| MIC1 | High/low | 2.557 | 1.341–4.873 | 0.002 | 2.625 | 1.347–5.115 | 0.005 |
MIC1, macrophage inhibitory factor 1.
Macrophage inhibitory factor 1 is overexpressed in esophageal squamous cell carcinoma tissues
To evaluate the role of MIC1 in ESCC progression, we first investigated the expression of MIC1 in ESCC cell lines and tumor tissues. Elevated expression of MIC1 was observed in three (37.5%) ESCC cell lines as well as in culture medium compared with that in normal esophageal cell lines (Fig. 3a,b). Then MIC1 protein expression level was examined by ESCC tissue microarray immunohistochemical staining. We found that normal esophageal epithelia showed negative or weak immunoreactions, yet cancer tissues demonstrated weak to intense positive staining in 18 of 40 (45%) ESCC specimens and the positive staining of MIC1 in ESCC tissues were mostly confined to the cytoplasm of ESCC cells with a diffuse pattern (Fig. 3c).
Fig. 3.

Expression macrophage inhibitory factor 1 (MIC1) in cell lines and tissue samples. (a) Western blotting analysis of MIC1 expression in eight established esophageal squamous cell carcinoma (ESCC) cell lines and one human normal esophageal cell line. (b) The level of MIC1 in cell culture media detected by enzyme linked immunosorbent assay (ELISA). (c) MIC1 expression detected by IHC staining in tissue microarrays (TMA) of ESCC and normal tissues. Overview of the TMA (up) and two representative cylinders (down; i), Negative expression of MIC1 was shown in Normal esophageal tissue (ii). Weak positive (iii) and strong (iv) expression of MIC1 in ESCC tissues. (d) MIC expression in paired ESCC cancerous (T) and surrounding normal tissues (N), normalized by GAPDH (glyceraldehyde 3-phosphate dehydrogenase). (e) Western blotting analysis of MIC1 protein expression. (f) Relative expression of MIC1 in tissues grouped by total tumor node metastasis stage, normalized by GAPDH. (g) Relative expression of MIC1 in ESCC tissues classified according to N stage.
To further investigate the correlation between MIC1 expression and clinicopathological variables of ESCC, the expression of MIC1 in 80 paired cancerous and matched adjacent noncancerous esophageal tissues was determined (tissue characteristics are in Table 1). We found that the MIC1 was overexpressed in 56 (70%) tumor-bearing tissues, compared with the adjacent non-tumor tissues (P < 0.001; Fig. 3d). Western blot assay of tissue samples from four representative patients of the same origin further confirmed that MIC1 were significantly increased in tumor samples compared with their noncancerous tissues (Fig. 3e). Further analysis found that the expression of MIC1 mRNA in ESCC tissues is higher at advanced TNM stages (Fig. 3g). The results also showed that increased level of MIC1 was significantly correlated with N stage classification (P = 0.025; Fig. 3f), and not with depth of tumor infiltration, age or gender.
Anti-macrophage inhibitory factor 1 antibody inhibits the growth of esophageal squamous cell carcinoma in nude mice
The data on tumor weight, volume and inhibitory effect of all groups was evaluated. We found that both 2 and 10 mg/kg dosing group yielded significantly tumor inhibition (32% and 46% respectively, P < 0.001), and the inhibitory effect has a dose-dependent relationship (Fig. 4a,b, Fig. S2a). None of the mice died during the assay, and mice treated with the antibody had a more weight gain (Fig. S2b).
Fig. 4.
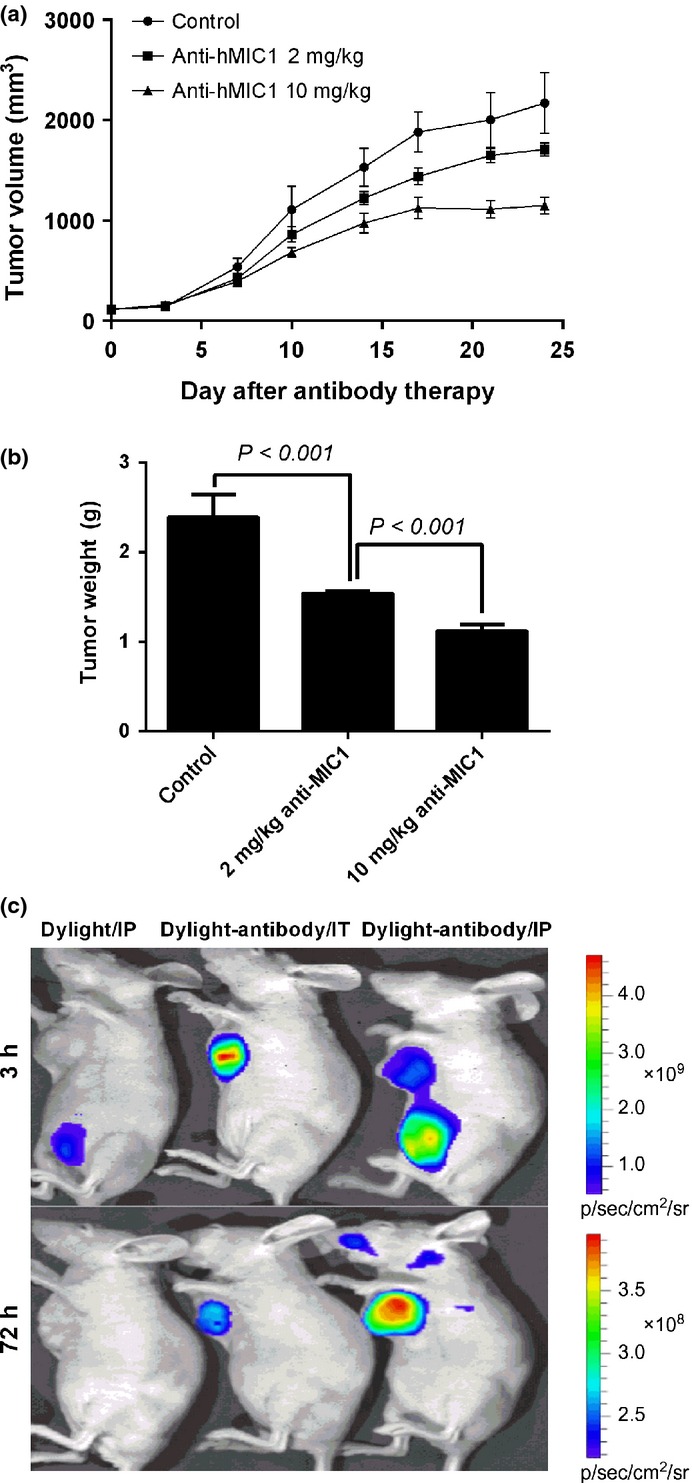
Inhibition of anti-macrophage inhibitory factor 1 (MIC1) antibody for human esophageal squamous cell carcinoma (ESCC) xenografts in vivo and its localization. (a) The volume of tumors in experimental and control groups by continuous observation. Data are presented as the mean ± standard error (SE), n = 10. (b) The weight of tumors in experimental and control groups. Data are presented as the mean ± SE, n = 10. (c) Dylight755 fluorescence dye and Dylight755 coupled anti-hMIC1 antibody 7c7 in S4 xenograft tumor 3 h and 3 days after IP and IT injection measured in vivo. IP, intraperitoneal injection; IT, intratumor injection.
Fluorescence imaging was carried out to analyze the distributions of the antibody. The results of in vivo imaging analysis suggested that MIC1 antibody could specifically target at peritumor tissues less than 3 h before penetrating and concentrating into the interior of tumors. The specific concentration of antibody could still been observed for more than 3 days in the tumor tissues, whereas there was no apparent strong fluorescence at other non-tumor tissues (Fig. 4c).
The decreased formation of neovascularization lumen
In vitro study of cell proliferation showed that anti-MIC1 antibody did not significantly inhibit MIC1 overexpression cell line S4 (Fig. S2c). To investigate the mechanism of tumor inhibition by anti-MIC1 antibody, we conducted a simple analysis on xenograft tissues. Histopathological examination of the H&E staining slides showed that there was obvious tumor cell necrosis observed in anti-hMIC1 monoclonal antibody group (Fig. 5a). Von Willebrand factor IHC staining of Paraffin sections showed that MVD of neovascularization in the experimental group were significantly less than that of the control group (P < 0.001; Fig. 5b,c). In vitro study further confirmed that MIC1 can stimulate cell proliferation of HUVECs (P < 0.001; Fig. 5d) and the effect can be inhibited with anti-MIC1 antibody. These results suggest that neutralization of MIC1 reduces tumor angiogenesis in vivo.
Fig. 5.

The tumor tissue necrosis and inhibition of angiogenesis in vivo. (a) Representative hematoxylin and eosin-stained tumor tissues obtained from mice in the control (i, iv), 2 mg/kg treated group (ii, v) and 10 mg/kg treated group (iii, vi). (b) Detection of blood vessels via immunohistochemical staining for Von Willebrand factor (VWF) from the control group (i), 2 mg/kg treated group (ii), 10 mg/kg treated group (iii). (c) Quantification of angiogenesis assessed by microvessel density (MVD). Data represent the mean ± standard error (SE), n = 4. (d) The effect of macrophage inhibitory factor (MIC) and anti-MIC1 antibody on human umbilical vein endothelial cells (HUVECs) in vitro; Data represent the mean ± SE, n = 4.
Discussion
The present study is the first in-depth investigation into clinical value of MIC1 in ESCC. We analyzed the expression of MIC1 in ESCC serum samples, and found that the serum levels of MIC1 were elevated and significantly correlated with depth of tumor invasion, as well as lymph node metastasis, which is consistent with the results observed in the tissue samples. We also assessed the value of MIC1 as a diagnostic and prognostic indicator in ESCC. Additionally, we explored the role of MIC1 in the ESCC progression and discovered the treatment value of MIC1 antibody against ESCC.
First, we found that serum MIC1 level of patients with ESCC is significantly higher than that of the healthy control population, indicating that MIC1 may serve as a promising biomarker in the diagnosis of ESCC. We also compared the diagnostic value for ESCC of MIC1 with SCC, CEA, CA199 and CA724, which were often used as EC markers in clinical settings, further demonstrating that the diagnosis value of MIC1 for ESCC was significantly better than the other four, especially in first-time early diagnosis. Our present study on serum MIC1 provides a novel and effective approach that may be helpful in the diagnosis of ESCC. However, these need to be validated using a screening test for ESCC in further studies.
Survival analyses showed that patients with higher levels of serum MIC1 had a poorer prognosis in both relapse-free and tumor-specific survival. Multivariate Cox analysis revealed that the level of serum MIC1 is an independent prognostic factor for ESCC. Our present study also showed that the level of MIC1 in serum was significantly decreased after surgical resection, and again significantly increased at relapse, which led us to hypothesize that serum MIC1 possibly plays a role in the tumorigenesis and progression of ESCC. Moreover, the result suggested that monitoring of serum MIC1 after surgery is useful in evaluation of early recurrence. However, this needs to be explored further, as our sample size and the duration of follow-up are limited.
Considerable evidence has revealed the importance of MIC1 in cancer; however, its expression and functional role in different kinds of human tumors remain controversial. Anti-tumorigenic function of MIC1 has been described in a few tumor cell lines where MIC1 induces apoptosis and inhibits cell proliferation.(29–31) However, it has also been reported that MIC1 expression is associated with cancer metastasis and its reduction resulted in a significant decrease in tumorigenicity.(32–39) Thus far, the specific character of MIC1 in ESCC has not been explored. In our present study, we showed high expression of MIC1 in three ESCC cell lines, in which the over-activation of TGF-β signals or p53 may be involved, since MIC1 was belonged to TGF-β signaling pathway and was regulated by p53. In addition, high expression of MIC1 in ESCC tissues was observed by TMA and RT-PCR, and its increased expression in our serum and tissue samples were significantly correlated with a higher N stage of ESCC, implying that MIC1 overexpression might play a role in tumor progression of ESCC, especially in lymph node metastasis. Meanwhile, in vitro study of cell proliferation showed that anti-MIC1 antibody did not inhibit MIC1 overexpression ESCC cell, combined with the secreted attribute of MIC1 and our discovery that anti-MIC1 monoclonal antibody possessed homing character for MIC1-overexpressed ESCC, suggesting that the positive function of MIC1 in tumor progression may partially result from the effect on tumor local microenvironment.
In our present study, the use of mouse anti-human MIC1 antibody significantly reduced the growth of tumors in ESCC tumor-bearing nude mice. Histological examination revealed that angiogenesis of neovascularization of antibody-treated tumors was significantly inhibited. In vitro studies showed that MIC1 can stimulate cell proliferation of HUVECs and the effect can be inhibited by MIC1 antibody. Therefore, our studies indicated that MIC1 may promote ESCC progression partially by the effect on the angiogenesis which is consistent with other reports,(40,41) and clinical treatment against ESCC could be enhanced by strategies to simultaneously neutralize MIC1 in the tumor microenvironment by using anti-MIC1 antibody.
In conclusion, we have demonstrated that MIC1 plays an important role in the ESCC progression and may function as a valuable biomarker and an interesting target for ESCC. Comprehensive studies on the carcinogenic effect of MIC1 and the mechanism of tumor inhibition by counteracting MIC1 with antibody are needed to be established as a biomarker for use in both diagnosis and prognosis, as well as a target for treatment of patients with ESCC.
Acknowledgments
This work was supported by the State Key Basic Research Program (grant numbers 2009CB521803 and 2012CB910703) and National High Technology Research and Development Program (grant number 2012AA02A503).
Disclosure Statement
The authors have no conflict of interest.
Supporting Information
Additional supporting information may be found in the online version of this article:
Data S1. The detection of MIC1 by ELISA.
Data S2. IHC analysis.
Data S3. Microvessel density (MVD).
Fig. S1. Distribution of patients eligible for diagnosis and prognosis of esophageal squamous cell carcinoma (flow chart).
Fig. S2. The toxicity and tumor inhibition effect of anti-MIC1 antibody.
References
- 1.Hongo M, Nagasaki Y, Shoji T. Epidemiology of esophageal cancer: orient to Occident. Effects of chronology, geography and ethnicity. J Gastroenterol Hepatol. 2009;24:729–35. doi: 10.1111/j.1440-1746.2009.05824.x. [DOI] [PubMed] [Google Scholar]
- 2.Ferlay J, Shin HR, Bray F, Forman D, Mathers C, Parkin DM. Estimates of worldwide burden of cancer in 2008: GLOBOCAN 2008. Int J Cancer. 2010;127:2893–917. doi: 10.1002/ijc.25516. [DOI] [PubMed] [Google Scholar]
- 3.Zeng HM, Zheng RS, Zhang SW, Zhao P, He J, Chen WQ. Trend analysis of cancer mortality in China between 1989 and 2008. Zhonghua Zhong Liu Za Zhi. 2012;34:525–31. doi: 10.3760/cma.j.issn.0253-3766.2012.07.011. [DOI] [PubMed] [Google Scholar]
- 4.Chen W, He Y, Zheng R, et al. Esophageal cancer incidence and mortality in China, 2009. J Thorac Dis. 2013;5:19–26. doi: 10.3978/j.issn.2072-1439.2013.01.04. [DOI] [PMC free article] [PubMed] [Google Scholar]
- 5.Urba SG, Orringer MB, Turrisi A, Iannettoni M, Forastiere A, Strawderman M. Randomized trial of preoperative chemoradiation versus surgery alone in patients with locoregional esophageal carcinoma. J Clin Oncol. 2001;19:305–13. doi: 10.1200/JCO.2001.19.2.305. [DOI] [PubMed] [Google Scholar]
- 6.Kelsen DP, Ginsberg R, Pajak TF, et al. Chemotherapy followed by surgery compared with surgery alone for localized esophageal cancer. N Engl J Med. 1998;339:1979–84. doi: 10.1056/NEJM199812313392704. [DOI] [PubMed] [Google Scholar]
- 7.Bootcov MR, Bauskin AR, Valenzuela SM, et al. MIC-1, a novel macrophage inhibitory cytokine, is a divergent member of the TGF-beta superfamily. Proc Natl Acad Sci USA. 1997;94:11514–9. doi: 10.1073/pnas.94.21.11514. [DOI] [PMC free article] [PubMed] [Google Scholar]
- 8.Paralkar VM, Vail AL, Grasser WA, et al. Cloning and characterization of a novel member of the transforming growth factor-beta/bone morphogenetic protein family. J Biol Chem. 1998;273:13760–7. doi: 10.1074/jbc.273.22.13760. [DOI] [PubMed] [Google Scholar]
- 9.Bauskin AR, Zhang HP, Fairlie WD, et al. The propeptide of macrophage inhibitory cytokine (MIC-1), a TGF-beta superfamily member, acts as a quality control determinant for correctly folded MIC-1. EMBO J. 2000;19:2212–20. doi: 10.1093/emboj/19.10.2212. [DOI] [PMC free article] [PubMed] [Google Scholar]
- 10.Hsiao EC, Koniaris LG, Zimmers-Koniaris T, Sebald SM, Huynh TV, Lee SJ. Characterization of growth-differentiation factor 15, a transforming growth factor beta superfamily member induced following liver injury. Mol Cell Biol. 2000;20:3742–51. doi: 10.1128/mcb.20.10.3742-3751.2000. [DOI] [PMC free article] [PubMed] [Google Scholar]
- 11.Buckhaults P, Rago C, St Croix B, et al. Secreted and cell surface genes expressed in benign and malignant colorectal tumors. Cancer Res. 2001;61:6996–7001. [PubMed] [Google Scholar]
- 12.Welsh JB, Sapinoso LM, Kern SG, et al. Large-scale delineation of secreted protein biomarkers overexpressed in cancer tissue and serum. Proc Natl Acad Sci USA. 2003;100:3410–5. doi: 10.1073/pnas.0530278100. [DOI] [PMC free article] [PubMed] [Google Scholar]
- 13.Breit SN, Johnen H, Cook AD, et al. The TGF-beta superfamily cytokine, MIC-1/GDF15: a pleotrophic cytokine with roles in inflammation, cancer and metabolism. Growth Factors. 2011;29:187–95. doi: 10.3109/08977194.2011.607137. [DOI] [PubMed] [Google Scholar]
- 14.Kim KK, Lee JJ, Yang Y, You KH, Lee JH. Macrophage inhibitory cytokine-1 activates AKT and ERK-1/2 via the transactivation of ErbB2 in human breast and gastric cancer cells. Carcinogenesis. 2008;29:704–12. doi: 10.1093/carcin/bgn031. [DOI] [PubMed] [Google Scholar]
- 15.Lee DH, Yang Y, Lee SJ, et al. Macrophage inhibitory cytokine-1 induces the invasiveness of gastric cancer cells by up-regulating the urokinase-type plasminogen activator system. Cancer Res. 2003;63:4648–55. [PubMed] [Google Scholar]
- 16.Senapati S, Rachagani S, Chaudhary K, Johansson SL, Singh RK, Batra SK. Overexpression of macrophage inhibitory cytokine-1 induces metastasis of human prostate cancer cells through the FAK-RhoA signaling pathway. Oncogene. 2010;29:1293–302. doi: 10.1038/onc.2009.420. [DOI] [PMC free article] [PubMed] [Google Scholar]
- 17.Karan D, Kelly DL, Rizzino A, Lin MF, Batra SK. Expression profile of differentially-regulated genes during progression of androgen-independent growth in human prostate cancer cells. Carcinogenesis. 2002;23:967–75. doi: 10.1093/carcin/23.6.967. [DOI] [PubMed] [Google Scholar]
- 18.Koopmann J, Rosenzweig CN, Zhang Z, et al. Serum markers in patients with resectable pancreatic adenocarcinoma: macrophage inhibitory cytokine 1 versus CA19-9. Clin Cancer Res. 2006;12:442–6. doi: 10.1158/1078-0432.CCR-05-0564. [DOI] [PubMed] [Google Scholar]
- 19.Koopmann J, Buckhaults P, Brown DA, et al. Serum macrophage inhibitory cytokine 1 as a marker of pancreatic and other periampullary cancers. Clin Cancer Res. 2004;10:2386–92. doi: 10.1158/1078-0432.ccr-03-0165. [DOI] [PubMed] [Google Scholar]
- 20.Brown DA, Hance KW, Rogers CJ, et al. Serum macrophage inhibitory cytokine-1 (MIC-1/GDF15): a potential screening tool for the prevention of colon cancer? Cancer Epidemiol Biomarkers Prev. 2012;21:337–46. doi: 10.1158/1055-9965.EPI-11-0786. [DOI] [PMC free article] [PubMed] [Google Scholar]
- 21.Staff AC, Bock AJ, Becker C, Kempf T, Wollert KC, Davidson B. Growth differentiation factor-15 as a prognostic biomarker in ovarian cancer. Gynecol Oncol. 2010;118:237–43. doi: 10.1016/j.ygyno.2010.05.032. [DOI] [PubMed] [Google Scholar]
- 22.Brown DA, Stephan C, Ward RL, et al. Measurement of serum levels of macrophage inhibitory cytokine 1 combined with prostate-specific antigen improves prostate cancer diagnosis. Clin Cancer Res. 2006;12:89–96. doi: 10.1158/1078-0432.CCR-05-1331. [DOI] [PubMed] [Google Scholar]
- 23.Johnen H, Lin S, Kuffner T, et al. Tumor-induced anorexia and weight loss are mediated by the TGF-beta superfamily cytokine MIC-1. Nat Med. 2007;13:1333–40. doi: 10.1038/nm1677. [DOI] [PubMed] [Google Scholar]
- 24.Han Y, Wei F, Xu X, et al. Establishment and comparative genomic hybridization analysis of human esophageal carcinomas cell line EC9706. Zhonghua Yi Xue Yi Chuan Xue Za Zhi. 2002;19:455–7. [PubMed] [Google Scholar]
- 25.Li H, Gao Q, Guo L, Lu SH. The PTEN/PI3K/Akt pathway regulates stem-like cells in primary esophageal carcinoma cells. Cancer Biol Ther. 2011;11:950–8. doi: 10.4161/cbt.11.11.15531. [DOI] [PubMed] [Google Scholar]
- 26.Shimada Y, Imamura M, Wagata T, Yamaguchi N, Tobe T. Characterization of 21 newly established esophageal cancer cell lines. Cancer. 1992;69:277–84. doi: 10.1002/1097-0142(19920115)69:2<277::aid-cncr2820690202>3.0.co;2-c. [DOI] [PubMed] [Google Scholar]
- 27.Li LW, Yu XY, Yang Y, Zhang CP, Guo LP, Lu SH. Expression of esophageal cancer related gene 4 (ECRG4), a novel tumor suppressor gene, in esophageal cancer and its inhibitory effect on the tumor growth in vitro and in vivo. Int J Cancer. 2009;125:1505–13. doi: 10.1002/ijc.24513. [DOI] [PubMed] [Google Scholar]
- 28.Weidner N. Intratumor microvessel density as a prognostic factor in cancer. Am J Pathol. 1995;147:9–19. [PMC free article] [PubMed] [Google Scholar]
- 29.Li PX, Wong J, Ayed A, et al. Placental transforming growth factor-beta is a downstream mediator of the growth arrest and apoptotic response of tumor cells to DNA damage and p53 overexpression. J Biol Chem. 2000;275:20127–35. doi: 10.1074/jbc.M909580199. [DOI] [PubMed] [Google Scholar]
- 30.Baek SJ, Kim KS, Nixon JB, Wilson LC, Eling TE. Cyclooxygenase inhibitors regulate the expression of a TGF-beta superfamily member that has proapoptotic and antitumorigenic activities. Mol Pharmacol. 2001;59:901–8. [PubMed] [Google Scholar]
- 31.Martinez JM, Sali T, Okazaki R, et al. Drug-induced expression of nonsteroidal anti-inflammatory drug-activated gene/macrophage inhibitory cytokine-1/prostate-derived factor, a putative tumor suppressor, inhibits tumor growth. J Pharmacol Exp Ther. 2006;318:899–906. doi: 10.1124/jpet.105.100081. [DOI] [PubMed] [Google Scholar]
- 32.Chen SJ, Karan D, Johansson SL, et al. Prostate-derived factor as a paracrine and autocrine factor for the proliferation of androgen receptor-positive human prostate cancer cells. Prostate. 2007;67:557–71. doi: 10.1002/pros.20551. [DOI] [PubMed] [Google Scholar]
- 33.Zhang L, Yang X, Pan HY, et al. Expression of growth differentiation factor 15 is positively correlated with histopathological malignant grade and in vitro cell proliferation in oral squamous cell carcinoma. Oral Oncol. 2009;45:627–32. doi: 10.1016/j.oraloncology.2008.07.017. [DOI] [PubMed] [Google Scholar]
- 34.Boyle GM, Pedley J, Martyn AC, et al. Macrophage inhibitory cytokine-1 is overexpressed in malignant melanoma and is associated with tumorigenicity. J Invest Dermatol. 2009;129:383–91. doi: 10.1038/jid.2008.270. [DOI] [PubMed] [Google Scholar]
- 35.Yang H, Choi HJ, Park SH, Kim JS, Moon Y. Macrophage inhibitory cytokine-1 (MIC-1) and subsequent urokinase-type plasminogen activator mediate cell death responses by ribotoxic anisomycin in HCT-116 colon cancer cells. Biochem Pharmacol. 2009;78:1205–13. doi: 10.1016/j.bcp.2009.06.012. [DOI] [PubMed] [Google Scholar]
- 36.Liu T, Bauskin AR, Zaunders J, et al. Macrophage inhibitory cytokine 1 reduces cell adhesion and induces apoptosis in prostate cancer cells. Cancer Res. 2003;63:5034–40. [PubMed] [Google Scholar]
- 37.Selander KS, Brown DA, Sequeiros GB, et al. Serum macrophage inhibitory cytokine-1 concentrations correlate with the presence of prostate cancer bone metastases. Cancer Epidemiol Biomarkers Prev. 2007;16:532–7. doi: 10.1158/1055-9965.EPI-06-0841. [DOI] [PubMed] [Google Scholar]
- 38.Bauskin AR, Brown DA, Kuffner T, et al. Role of macrophage inhibitory cytokine-1 in tumorigenesis and diagnosis of cancer. Cancer Res. 2006;66:4983–6. doi: 10.1158/0008-5472.CAN-05-4067. [DOI] [PubMed] [Google Scholar]
- 39.Brown DA, Ward RL, Buckhaults P, et al. MIC-1 serum level and genotype: associations with progress and prognosis of colorectal carcinoma. Clin Cancer Res. 2003;9:2642–50. [PubMed] [Google Scholar]
- 40.Huh SJ, Chung CY, Sharma A, Robertson GP. Macrophage inhibitory cytokine-1 regulates melanoma vascular development. Am J Pathol. 2010;176:2948–57. doi: 10.2353/ajpath.2010.090963. [DOI] [PMC free article] [PubMed] [Google Scholar]
- 41.Jin YJ, Lee JH, Kim YM, Oh GT, Lee H. Macrophage inhibitory cytokine-1 stimulates proliferation of human umbilical vein endothelial cells by up-regulating cyclins D1 and E through the PI3K/Akt-, ERK-, and JNK-dependent AP-1 and E2F activation signaling pathways. Cell Signal. 2012;24:1485–95. doi: 10.1016/j.cellsig.2012.03.014. [DOI] [PubMed] [Google Scholar]
Associated Data
This section collects any data citations, data availability statements, or supplementary materials included in this article.
Supplementary Materials
Data S1. The detection of MIC1 by ELISA.
Data S2. IHC analysis.
Data S3. Microvessel density (MVD).
Fig. S1. Distribution of patients eligible for diagnosis and prognosis of esophageal squamous cell carcinoma (flow chart).
Fig. S2. The toxicity and tumor inhibition effect of anti-MIC1 antibody.