

Abstract
Regulatory T cells (Tregs) and plasmacytoid dendritic cells (pDCs) play important roles in the immune escape of cancer. In this study, we investigated pDCs and pDC-induced inducible costimulator (ICOS)+ Treg populations in peripheral blood from gastric cancer (GC) patients and healthy donors by flow cytometry. The distribution of these cells in carcinoma tissue, peritumor tissue, and normal gastric mucosa was detected by immunohistochemistry. Plasma and tissue concentration of the cytokines such as interleukin-10 and transforming growth factor-β1 were also measured. We found that the numbers of pDCs, Tregs, and ICOS+ Tregs in peripheral blood were increased in GC patients compared with healthy donors. In tissue, Tregs and ICOS+ Tregs were found distributing mainly in carcinoma tissue, whereas pDCs were mainly found in peritumor tissue. Moreover, the Foxp3+ICOS+/Foxp3+ cell ratio in carcinoma and peritumor tissue were higher than that in normal tissue. There were more ICOS+ Tregs in tumor and peritumor tissue of late-stage GC patients. There was a positive correlation between pDCs and ICOS+ Tregs in peripheral blood and peritumor tissue from GC patients. In conclusion, pDCs may play a potential role in recruiting ICOS+ Tregs, and both participate in the immunosuppression microenvironment of GC.
Keywords: Dendritic cells, immune defense suppression, regulatory T cells, stomach neoplasms, tumor escape
Approximately one million GC cases are estimated to occur every year worldwide, leading to over 700 000 deaths. Gastric cancer accounts for 8% of all cancer cases and 10% of all cancer deaths globally.(1) Although great progress in treatment methods have been reported,(2,3) overall survival for patients with GC remains poor. In recent years, there has been great fervor in tumor immunology research. Many immune cells, such as CD4+CD25+ regulatory T cells (Tregs)(4,5) and CD8+CD28− T cells,(6) have been found to suppress the function of immune effector cells, thus facilitating the escape of tumor cells from immune surveillance.
Regulatory T cells play an important role in the maintenance of immunological unresponsiveness to self-antigens and are involved in suppressing excessive immune responses deleterious to the host.(7) Previous research has shown that the proportion of Tregs is increased in tumor tissue and peripheral blood from patients with pancreas/breast adenocarcinoma, prostate cancer, and ovarian and lung cancers.(8–10) These cells prevent activated CD4+CD25− and CD8+ cells from proliferating, thereby mitigating the immune response against tumor antigens,(8) and are related to poor prognosis.(4,11)
Regulatory T cells are further divided into two subsets, ICOS+ Tregs and ICOS− Tregs. In vitro, experiments have confirmed that the capacity of cytokine production by the two Treg subsets were different. The ICOS+ Tregs could secrete massive amounts of IL-10 and moderate amounts of TGF-β1, whereas the ICOS− Tregs played a suppressive function mainly through the secretion of TGF-β1.(12) In mice, ICOS+ Tregs are characterized by superior survival and highly suppressive properties compared with ICOS− Tregs.(13) In human melanoma, ICOS+ Tregs were the main suppression subset.(14) Therefore, the two subsets of Tregs exert different functions in the same environment. Although increased Treg numbers have been found in peripheral blood, tumor tissue, and perigastric lymph nodes in GC patients and model animals,(4,5,15) the role of Treg subsets in tumor immune escape of GC remains unclear.
Plasmacytoid dendritic cells are involved in protective immunity and tumor immune escape. Under steady state conditions, they are present in blood and absent from peripheral tissues. They can secrete large amounts of type I IFNs and thereby participate in antiviral innate immunity.(16) Recent evidence suggests that in some solid cancers they may regulate antitumor immunity and support tumor immune evasion. Zou et al.(17) found a large number of pDCs in the malignant ascetic fluid of advanced-stage ovarian cancer patients; in breast cancer, pDC numbers negatively correlate with overall survival and relapse-free survival.(18) One of the possible molecular mechanisms by which pDCs mediate immune suppression is to induce ICOS+ Tregs by upregulating the expression of ICOS-L.(12,19) However, whether the pDC prevalence is increased in GC is still unclear. Importantly, there is a paucity of studies presenting the association between ICOS+ Tregs and pDCs in GC.
To address these issues, the frequency of circulating pDCs, Tregs, and ICOS+ Tregs were analyzed in GC patients in various advanced stages. These cells were also compared in carcinoma tissue, peritumor tissue, and normal gastric mucosa tissue. Our results showed that GC patients had increased numbers of ICOS+ Tregs, particularly in situ tumor and peritumor tissue, which correlated with tumor stage. Moreover, the pDCs were also increased in GC and there was a positive correlation between pDCs and ICOS+ Tregs in peripheral blood and peritumor tissue.
Materials and Methods
Ethics
Prior to the research, appropriate permission was granted by the ethical committee of the First Affiliated Hospital, Medical College, Zhejiang University (Hangzhou, China). All participants provided their written informed consent to participate in this study.
Study subjects
Blood samples
After elimination of those with other malignancies, autoimmune diseases, or chronic infections, 51 patients were enrolled in the study, all of whom were diagnosed with GC by gastroscopic biopsy. Peripheral blood (˜5 mL) was collected from each patient in EDTA tubes prior to antitumor treatment. Thirty healthy individuals (23 male, 7 female; average age, 56 ± 13 years) who were selected based on health inspection were enrolled as controls. Peripheral blood was also obtained. There was no significant difference in gender or age between the patient and control groups. After centrifugation at 300g for 5 min, plasma was frozen at −80°C for later ELISA. Peripheral blood mononuclear cells were analyzed by flow cytometry.
Tissue samples
Ninety-one patients with gastric cancer were enrolled, all of whom underwent surgery between 2009 and 2011. No patient received radiotherapy or chemotherapy before surgery. Patients with a history of autoimmune disease or chronic infection were excluded. Tissue from 30 patients was randomly selected from a total of 91 patients for immunofluorescence analysis (17 male, 13 female; average age, 62 ± 10 years; TNM stage I, 9; stage II, 5; stage III, 5; IV, 11). Tissue from 15 patients was randomly selected from a total of 91 patients for Western blot analysis (8 male, 7 female; average age, 63 ± 11 years; TNM stage: I, 5; II, 3; III, 5; IV, 2).
The clinical characteristics of the patients who provided blood and tissue samples are shown in Table 1.
Table 1.
Clinical characteristics of patients with gastric cancer
| Factor | Blood sample (n = 51) | Tissue sample (n = 91) | |
|---|---|---|---|
| Gender | Male | 38 (74.5%) | 65 (55.4%) |
| Female | 13 (25.5%) | 26 (44.6%) | |
| Age, years | Male | 61 ± 11† | 62 ± 13 |
| Female | 54 ± 16 | 61 ± 11 | |
| TNM stage (AJCC 6th edition) | I | 15 (50.0%)‡ | 27 (29.7%) |
| II | 3 (10.0%) | 15 (16.5%) | |
| III | 8 (26.7%) | 35 (38.4%) | |
| IV | 4 (13.3%) | 14 (15.4%) | |
| Primary tumor (T) | T1 | 13 (43.3%) | 25 (27.5%) |
| T2 | 2 (6.7%) | 31 (34.1%) | |
| T3 | 13 (43.3%) | 22 (24.2%) | |
| T4 | 2 (6.7%) | 13 (14.2%) | |
| Lymph node | Negative | 17 (56.7%) | 38 (41.8%) |
| Metastasis | Positive | 13 (43.3%) | 53 (58.2%) |
| Distant metastasis | Negative | 28 (93.3%) | 78 (85.7%) |
| Positive | 2 (6.7%) | 13 (14.3%) |
Age values are expressed as means ± SD.
Patients who accepted neoadjuvant chemotherapy have been excluded.
Flow cytometry analysis
Multicolor flow cytometry was carried out on fresh Ficoll-prepared (TBD Sciences, Tianjing, China) PBMCs. After suspension in PBS, PBMCs (100 μL) were separately added to two tubes (1 × 10⁶–2 × 10⁶ PBMCs per sample). The first tube was incubated with FITC-Lineage (CD2, CD3, CD14, CD16, CD19, CD235a, and CD56), APC-HLA-DR, PE-Cy7-CD11c, and Percp-Cy5.5-CD123 mAbs (all eBioscience, San Diego, CA, USA). The PBMCs defined as Lineage−HLA-DR+CD123brightCD11c− were pDCs. The other tube was used to identify CD4+CD25+Foxp3+ Tregs and analyze their ICOS expression. Briefly, after CD4-FITC (BD Pharmingen, San Diego, CA, USA), CD25-PE-Cy5 (BD Pharmingen) and ICOS-PE-Cy7 (eBioscience) surface staining, PBMCs were washed and fixed with fixation/permeabilization solution (eBioscience), then incubated with anti-Foxp3-PE mAbs (eBioscience). After washing, stained cells were analyzed on a flow cytometer (LSR-II; BD Biosciences) using BD FACSDiva Software. Lymphocytes (1–3 × 10⁴) were gated to analyze the Tregs. Considering the small proportion of pDCs, 100 000–200 000 events in the lymphocytes and monocytes were accumulated as the acquisition gates. The appropriate isotype was used.
Immunohistochemistry
Standard H&E staining was used to confirm the pathological diagnosis, and the peritumor region was defined as a 2–5-cm zone bordering the margin of the gastric tumor. Paraffin-embedded, 4-μm-thick sections of normal mucosa, peritumor mucosa, and cancer tissue from each patient were selected for IHC analysis. Sections were dewaxed and then subjected to heat-induced epitope retrieval with preheated epitope retrieval solution (10 mM citrate buffer, pH 6.0). Next, endogenous peroxidase activity was blocked and the sections were incubated overnight with one of the following primary mAbs: mouse anti-CD3, rabbit anti-CD8 (working solution; both Zhongshan Golden Bridge Biotechnology, Beijing, China), rabbit anti-CD4 (1:100; Leica, Wetzlar, Germany), or mouse anti-FoxP3 (1:400; Abcam, Cambridge, UK). After incubation with HRP-conjugated second antibody (Invitrogen, Carlsbad, CA, USA) and development with diaminobenzidine, sections were counterstained with hematoxylin.
Because available anti-BDCA-2 antibodies (1:500; MACS, Bergisch Gladbach, Germany; source: mouse) are not suitable for paraffin-embedded archive material, BDCA-2 analysis was carried out on frozen sections. After confirmation of the diagnosis by H&E staining, 5-μm sections were immersed in pre-cooled acetone (−20°C) for 30 min. Endogenous peroxidase was quenched in 3% H2O2. The sections were then incubated overnight at 4°C with primary mAb. Subsequent steps were as described above.
Negative control staining was carried out with cold PBS in place of primary antibody.
Immunofluorescence
For Foxp3 and ICOS, double-fluorescence immunostaining was carried out in 30 randomly selected GC patients. The first day of the experiment was the same as for IHC analysis of paraffin-embedded sections, except that endogenous peroxidase activity was not blocked and the primary mAb was a FoxP3 and ICOS cocktail (both 1:200; Abcam). On the next day, sections were incubated with a cocktail of donkey anti-mouse (Alexa Fluor 488, 1:300) and donkey anti-rabbit (Alexa Fluor 594, 1:200) antibodies (both from Invitrogen). Finally, ˜30 μL mounting solution antifade + DAPI (Vector Laboratories, Burlingame, CA, USA) was applied and the sections were covered with coverslips. The sections were photographed under a fluorescence microscope (×40 objective lens, ×10 ocular lens; Olympus, Tokyo, Japan) with NIS-Elements software (Nikon Corporation, Tokyo, Japan).
Western blot analysis
Fifteen cases were selected for Western blotting. Tissue samples were lysed in pre-cooling RIPA lysis buffer (50 mM Tris-HCl [pH 7.4], 150 mM NaCl, 1% Triton X-100, 1% sodium deoxycholate, 0.1% SDS, 1 mM PMSF). Protein concentration was quantified using the Bradford method. Then SDS-PAGE was used to separate the extracted proteins, which were then transferred to PVDF membranes. After blocking with TBS-T buffer containing 5% non-fat powdered milk for 2 h, the membranes were immunoblotted overnight with primary antibody, mouse anti-IL-10 (1:1000) and mouse anti-TGF-β1 (1:1000) (both Abcam). Horseradish peroxidase-conjugated goat anti-mouse IgG was used as the secondary antibody. β-Actin (1:1000; Sigma-Aldrich, St. Louis, MO, USA) was used as an internal control. Immunoreactive bands on the blots were visualized with an enhanced chemiluminescence reagent ECL kit (Beit Haemek, Kibbutz Beit Haemek, Israel).
Immunosorbent assay
Plasma from GC patients and control donors previously stored at −80°C was thawed and analyzed for concentrations of IL-10, IFN-α, IL-2, and TGF-β1 using a human platinum ELISA kit (eBioscience). The assay was run according to the manufacturer's test protocol. All of the samples (except for those for TGF-β1) were added without dilution because of the low levels of the cytokines based on the results of pilot experiments. Each blank, standard, and optional control sample was assayed in duplicate. Absorbances were measured on a microplate reader (ELx800; BioTek, Winooski, VT, USA) with a primary wavelength of 450 nm and a reference wavelength of 630 nm.
Statistical analysis
Data were summarized by descriptive statistics in spss 16.0 (SPSS Inc., Chicago, IL, USA). Flow cytometry and ELISA data were analyzed by unpaired Student's t-test for normal distribution data which were expressed as the mean ± SD, or Mann–Whitney test for abnormal distribution data which were expressed as median (range). The IHC and immunofluorescence values are expressed as median (range). The IHC data were analyzed by the Friedman test. Differences between groups were evaluated by the least significant difference Q test. Correlation analysis of the data was tested using Spearman's test. All P-values <0.05 were considered to indicate statistical significance.
Results
Increased numbers of total Tregs and ICOS+ Tregs in GC patients
Circulating Tregs are defined as the population of CD4+CD25+Foxp3+ T cells as a percentage of CD4+ lymphocytes. There was an increased number of circulating Tregs in GC patients compared to the control group (4.69 ± 1.72% vs 3.38 ± 1.04%, P = 0.001; Fig. 1a,b). Moreover, the number of Foxp3+ T cells in tumor tissue (10.45 [range, 0.20–59.50]) are twice that in peritumor tissue (4.55 [range, 0.20–19.60], P = 0.001), and three times that in normal gastric mucosa (3.20 [range, 0.00–13.50], P = 0.001) (Fig. 2a,c). These results collectively suggest high enrichment of Tregs in GC patients.
Fig. 1.

Increased numbers of regulatory T cells (Tregs) and inducible costimulator (ICOS)+ Tregs in peripheral blood of gastric cancer (GC) patients. (a) Flow cytometric CD4-gated analysis of CD25+Foxp3+ cells was carried out in a GC patient and a control. (b) The percentage of Tregs among CD4+ lymphocytes was higher in the GC patient than that in the control. (c) PBMCs were stained with anti-human ICOS PE-Cy7 and its isotype. (d) The proportion of ICOS+ Tregs and ICOS− Tregs among CD4+ lymphocytes was statistically increased in the GC group compared to the control group.
Fig. 2.

Increased population of regulatory T cells (Tregs) and inducible costimulator (ICOS)+ Tregs in carcinoma tissue. (a) Representative immunohistochemical (IHC) staining of Foxp3 in tumor, peritumor, and normal gastric tissue are shown (magnification, ×400). (b) Different tissues were stained for Foxp3 and ICOS using standard immunofluorescence techniques. FoxP3+ staining (green) was in the nucleus and ICOS+ staining (red) was on the surface of the cell. The top three photographs are shown at ×400 magnification, the three photographs below are shown at ×1000 magnification (green arrow, Foxp3+; red arrow, ICOS+; yellow arrow, double positive). (c) Box blot set showing the Foxp3+ cell level in different tissues (IHC). (d) ICOS+ Treg level was significantly higher in carcinoma tissue than in peritumor tissue or normal tissue. (e) Greater ICOS+ Treg/total Treg ratio is both in intratumor and peritumor tissue.
We further analyzed Treg subsets according to ICOS expression (Fig. 1c). In peripheral blood, the proportion of Treg subsets in CD4+ T cells in control individuals was 1.10% (range, 0.30–1.90%) for ICOS+ Tregs and 2.15% (range, 0.50–4.30%) for ICOS− Tregs; the values in GC patients were 1.50% (range, 0.50–4.10%) and 2.80% (range, 0.60–7.40%), respectively. Numbers of both ICOS+ Tregs and ICOS− Tregs were significantly increased in GC patients (P = 0.003 and P = 0.007, respectively) (Fig. 1d). In tissue, we carried out double immunofluorescence staining of Foxp3 and ICOS (Fig. 2b). Both Foxp3+ICOS+ (Fig. 2d) and Foxp3+ICOS− cells preferentially accumulated in carcinoma tissue (5.57 [range, 0.00–30.88] and 9.12 [range, 0.50–36.86], respectively) rather than peritumor tissue (3.43 [range, 0.00–11.14] and 6.38 [range, 0.00–17.67], respectively; P = 0.001 and P = 0.002, respectively) or normal tissue (1.50 [range, 0.00–12.29] and 5.25 [range, 0.71–19.29], respectively; both P = 0.001]. The Foxp3+ICOS+/Foxp3+ cell ratio in normal tissue (0.21 [range, 0.00–0.55]) was lower than that in either carcinoma tissue (0.33 [range, 0.00–0.77], P =0.001] or peritumor tissue (0.36 [range, 0.09–0.48], P = 0.007). There was no significant difference in the Foxp3+ICOS+/Foxp3+ cell ratio between carcinoma tissue and peritumor tissue (Fig. 2e). These results collectively show dominant infiltration of ICOS+FoxP3+ cells in tumor-affected regions (Fig. S1).
Increased number of pDCs in GC patients
Plasmacytoid dendritic cells were identified as Lin−HLA-DR+CD11c−CD123high cells (Fig. 3a). The proportion of circulating pDCs among Lineage− cells was significantly higher in GC patients than in control donors (2.64% [range, 0.14–10.70%] vs 1.51% [range, 0.11–6.91%], P = 0.027; Fig. 3b).
Fig. 3.

Characterization and quantification of blood plasmacytoid dendritic cells (pDCs). (a) PBMCs isolated from a gastric cancer (GC) patient and a control subject were analyzed for pDC levels by flow cytometry. The first gate was set on lymphocytes and monocytes (P1) and the second gate was set on Lineage− and HLA-DR+ cells (Q1). The pDCs were identified as Lineage−HLA-DR+CD123brightCD11c− cells. (b) Cumulative percentages of pDCs in Lineage− cells of the GC patient and the control subject. The prevalence of pDCs was significantly higher in the GC patient than that in the control donor. (c) The presence of pDCs was significantly associated with an increased number of ICOS+ regulatory T cells (Tregs) in peripheral blood. FSC, forward scatter; SSC, side scatter.
Immunohistochemical staining of BDCA-2 revealed that pDCs were present in stomach tissues of GC patients. Strikingly, the number of pDCs in peritumor tissue (0.60 [range, 0.00–4.90]) was higher than that in cancer tissue (0.30 [range, 0.00–4.20], P = 0.054]) or normal tissue (0.30 [range, 0.00–3.50], P = 0.01) (Fig. 4a,b).
Fig. 4.

Distribution of blood dendritic cell antigen 2 (BDCA2)+ plasmacytoid dendritic cells (pDCs). (a) Representative immunohistochemical staining of BDCA-2 in frozen sections. Positive cells in tumor, peritumor, and normal gastric tissue are showing a plasmacytoid, roundish morphology with dendritic processes (black arrow) (magnification, ×400). (b) Distribution of BDCA2+ pDCs in peritumor tissue was higher than that in cancer tissue or normal tissue. (c) A positive correlation between pDCs and inducible costimulator (ICOS)+ regulatory T cells (Tregs) was observed in peritumor tissue.
Positive correlation between pDCs and ICOS+ Tregs in blood and peritumor tissue
As described above, circulating pDCs, total Tregs, and two subsets of Tregs were significantly increased in GC patients. Furthermore, we found that the prevalence of pDCs was significantly associated with that of ICOS+ Tregs in peripheral blood (r = 0.431, P = 0.002; Fig. 3c). In tissue, there was a positive correlation of pDCs with ICOS+ Tregs in peritumor (r = 0.660, P = 0.001; Fig. 4c), but not in tumor tissue. There was no significant correlation between pDCs and ICOS− Tregs (Fig. S2).
Highly enriched ICOS+ Tregs in tumor and peritumor tissue of advanced stage GC patients
To further investigate the changes in Tregs and pDCs during tumor invasion, we compared the pDCs, total Tregs, and Treg subsets in the blood and tissue of GC patients at different TNM stages and LN metastasis statuses. As shown in Figure 5, we observed increasing ICOS+ Tregs in the tumor and peritumor tissue of subjects as follows: stage I and II < stage III and IV (P = 0.011 in tumor tissue and P = 0.046 in peritumor tissue); LN-negative group < LN metastasis group, although the trend did not reach statistical significance.
Fig. 5.
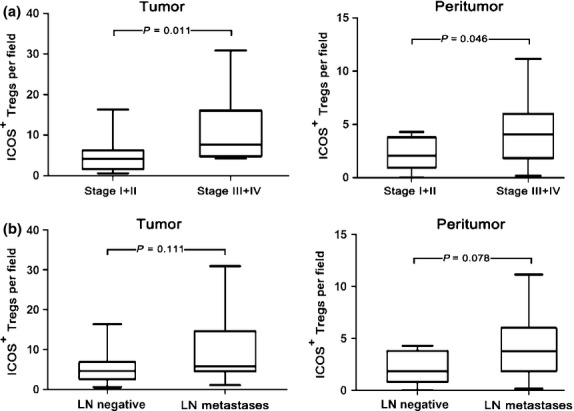
Number of inducible costimulator (ICOS)+ regulatory T cells (Tregs) in different TNM staging and lymph node (LN) metastases in patients with gastric cancer. (a) Numbers of ICOS+ Tregs in >stage II group (n = 16) in tumor and peritumor tissue were significantly higher than those in ≤stage II group (n = 14). (b) Numbers of ICOS+ Tregs in LN metastasis group (n = 19) were higher than those with LN-negative disease (n = 11).
Distribution of CD4+ and CD8+ cells in stomach tissue of GC patients
The numbers of CD3+ T cells were similar in normal gastric mucosa, peritumor tissue, and gastric cancer tissue (data not shown). More CD4+ T cells (24.20 [range, 0.0–84.80]) were present in gastric cancer tissue than in either peritumor tissue (22.20 [range, 2.50–77.20], P = 0.031) or normal mucosa (19.15 [range, 3.70–71.00], P = 0.015). However, the number of CD8+ T cells was 22.35 (range, 2.60–91.10) in tumor tissue, significantly lower than in peritumor tissue (30.79 [range, 8.40–66.20], P < 0.001) or normal mucosa (31.05 [range, 12.60–81.60], P < 0.001) (Fig. S3).
Elevated IL-10 levels in tissue and plasma, and decreased plasma IFN-α level in GC patients
To study the changes in the concentrations of cytokines in gastric tissue, we first analyzed frozen tissue by Western blotting. As shown in Figure 6(a), the concentration of IL-10 was highest in the carcinoma tissue, followed by peritumor tissue, and lowest in normal tissue. Normal tissue had a lower concentration of TGF-β1 than tumor tissue and peritumor tissue, their levels in tumor tissue and peritumor tissue were similar.
Fig. 6.
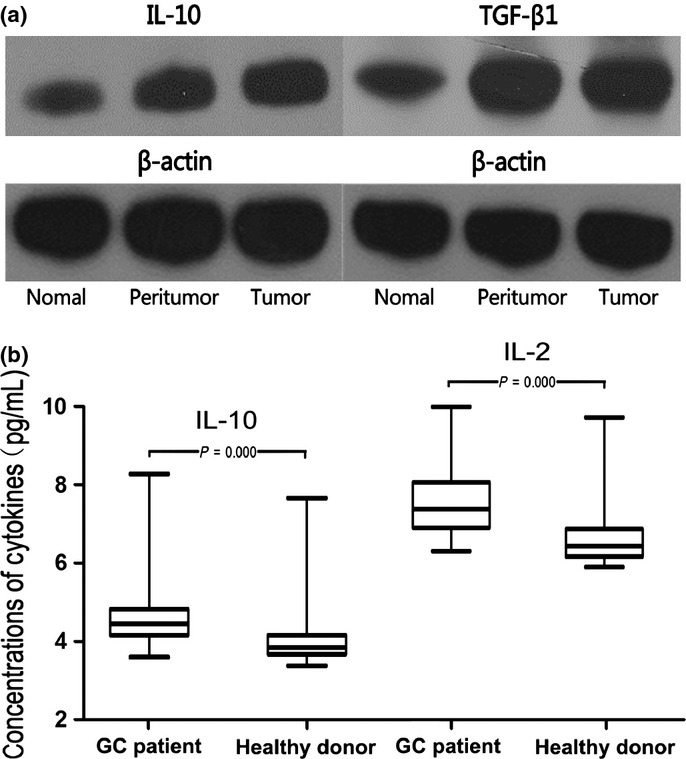
Cytokine levels in blood and tissue in patients with gastric cancer. (a) Representative example of Western blotting for interleukin (IL)-10 and transforming growth factor-β (TGF-β1) is shown. The concentration of IL-10 decreased with decreased distance from the cancer site. The concentration of TGF-β1 in normal tissue was lower than tumor tissue and peritumor tissue. (b) Plasma levels of both IL-10 and IL-2 were higher in patients with GC than in control subjects
Plasma levels of IL-10 and IL-2 were higher in patients with GC than in control subjects (IL-10, 4.452 [range, 3.600–8.275] pg/mL vs 3.847 [range, 3.375–7.663] pg/mL; IL-2, 7.351 [range, 6.260–9.980] pg/mL vs 6.396 [range, 5.854–9.700] pg/mL, both P < 0.001; Fig. 6b). The plasma IFN-α level was below the detection limit of the ELISA kit (3.2 pg/mL) in most GC patients and above the detection limit in most age- and gender-matched healthy individuals. There was a statistically significant decrease in IFN-α levels in GC patients. We did not find any difference in plasma TGF-β1 levels between the two groups (13 651 ± 4424 pg/mL in GC patients vs 12 926 ± 3609 pg/mL in control donors, P = 0.463) (Fig. S4).
Discussion
Ineffective antitumor immune responses contribute to tumor growth and metastasis. Regulatory T cells are considered to be indispensable players in immunological tolerance. Nevertheless, the subset of Tregs that plays the key role in tumor immune escape remains largely undefined. In the present study, we found humans with GC had increased Tregs in peripheral blood and carcinoma tissue, which was consistent with previous reports.(5,8,10) Moreover, we showed that GC patients do have an increased prevalence of both circulating and tumor-infiltrating ICOS+ Tregs. Especially compared with normal gastric mucosa tissue, there are more Foxp3+ICOS+ cells in carcinoma tissue and peritumor tissue, not only in terms of absolute number but also in the percentage in total Foxp3+ cells. Therefore, a high prevalence of ICOS+ Tregs may have close relationship with the genesis and development of gastric cancer.
Experiments in vitro have shown that ICOS+ Tregs secrete the highest amount of inhibitory cytokine IL-10, whereas ICOS− Tregs mainly secrete TGF-β.(12) Chen et al. reported that in a mouse forestomach carcinoma model, Tregs secrete IL-10 but not TGF-β during tumor progression.(15) So, the ICOS+ Treg subset characterized by secreting IL-10 plays a more important role during tumor progression than the ICOS− Treg subset. Using Western blotting, we showed that the concentration of IL-10 increased from normal gastric mucosa tissue to carcinoma tissue, which is similar to the distribution of ICOS+ Tregs. Moreover, although there were more ICOS− Tregs in carcinoma tissue than peritumor tissue, we did not find any significant difference in TGF-β levels between the two regions. In peripheral blood, there was a higher level of IL-10 but not TGF-β in GC patients compared to healthy volunteers. It is likely that tumor-infiltrating and circulating ICOS+ Tregs are more activated than ICOS− Tregs.
Recently, Conrad et al. reported that ICOS+ Treg numbers could predict disease, as ovarian cancer patients with more ICOS+ Tregs showed significantly reduced progression-free survival.(20) In this study, we showed that ICOS+ Tregs in both carcinoma tissue and peritumor tissue increased with the progress of tumor stage in GC patients. This correlation with tumor stage was not revealed on total Tregs or ICOS− Tregs (data not shown), suggesting that the number of ICOS+ Tregs is more closely linked with the severity of disease.
α-Interferon has been shown to affect tumor cell proliferation and tumor metastasis.(21) As an important source of IFN-α, pDCs may be important players in the tumor immune microenvironment. In lung cancer, activated pDCs could induce a cytotoxic T cell response relevant to antitumor immunity.(22) Notably used for treatment, stimulated pDCs have been reported to induce tumor regression.(23) However, the antitumor effect of pDCs has been questioned recently. It has been shown that pDCs are recruited to solid tumor tissues and are associated with poor clinical outcome.(18,24) Plasmacytoid dendritic cells that infiltrate the tumor microenvironment present a fragmentary function. Only limited expression of the IFN-α-inducible intracellular protein MxA in pDCs in cancer tissue(18,25) and those deficient in IFN-α production promote the expansion of Foxp3+ Tregs.(26) In tumor ascites of ovarian cancer, pDCs took part in immunosuppression by inducing IL-10-producing ICOS+ Tregs.(20) In a mouse model of lung cancer, pDC induced an immunosuppressive environment through an influx of Tregs, which was associated with tumor growth.(27) In vitro experiments have confirmed that both maturing and mature pDCs upregulate the expression of ICOS-L and have the ability to drive the generation of Tregs from naïve CD4+ T cells through an ICOS-L–ICOS pathway.(12,19) This potential of pDCs to express ICOS-L and induce the generation of Tregs had nothing to do with whether they are mature or not.(28) In the current study, we have shown that pDC numbers in peripheral blood were significantly increased in GC patients. Interestingly, pDCs preferentially accumulated in peritumor tissue rather than tumor tissue. This distribution bias has also been reported in cervical neoplastic lesions, in that pDCs were mainly detected in the stroma underlying the tumor rather than within the cancerous epithelium.(29) We also found a positive correlation between pDCs and ICOS+ Tregs both in peritumor tissue and peripheral blood of GC patients, suggesting that in GC, pDCs may contribute to the differentiation of naïve CD4+ T cells into ICOS+ Tregs. Moreover, the plasma concentration of IFN-α was lower in GC patients, although the number of pDCs increased in peripheral blood. This skewing of the function of pDCs may contribute to the immune escape of GC.
Interleukin-2 plays an important role in the immune escape of cancer. It can maintain the expression of Foxp3 in Tregs.(30) Zou et al. reported that large quantities of IL-2 could activate Treg division without MHC class II and T cell antigen receptor signaling.(31) Furthermore, in the presence of IL-2, ICOS-L could efficiently induce the proliferation of ICOS+ Tregs.(12) In our study, there was a statistically significant increase in plasma IL-2 level in patients with GC, suggesting its involvement in the GC immune escape network.
Using IHC staining, we found the distribution of T cell subsets was different in carcinoma tissue, peritumor tissue, and normal tissue. There were more CD4+ T cells but fewer CD8+ T cells in carcinoma tissue compared with normal tissue and peritumor tissue. We thought the increased CD4+ T cells were Tregs and the loss of CD8+ cytotoxic T cells was probably due to apoptosis induced by Tregs.(32,33)
In conclusion, in our study, we found that a variety of immune regulatory cells and cytokines were involved in the immunosuppressive environment of GC. Increased numbers of pDCs might contribute to the immunosuppression of GC by inducing ICOS+ Tregs. The gathering of ICOS+ Tregs might lead to progression of disease. Our findings provide new insights into the tumor immunology of pDCs and ICOS+ Tregs in GC patients. Therapy targeting ICOS-L/ICOS costimulation could reduce expansion of ICOS+ Tregs and become a potential treatment for gastric cancer.
Acknowledgments
We thank Hai-Yang Xie, Jing Ying, and Xiao-Qin Tang for the technical assistance with FCM, Xiao-Wen Feng and Rong Su for assistance with immunohistochemistry, Wen-Feng Song for assistance with immunoblot analysis, and Ying-Chun Ma for blood sample collection. Xiao-Mei Huang and Hang Yu, and Xiao-Sun Liu were supported by grants from the National Natural Science Foundation of China (81071964/H1617 and 81273254/H1006, respectively) and the Qianjiang Talent Program of Zhejiang Province (2012R10046). Ge-Er Zhang and Hai-Long Jin were supported by the co-constructed project of Ministry of Science and Technology and Province Department (WKJ2011-2-005).
Glossary
- Treg
regulatory T cell
- PDC
plasmacytoid dendritic cell
- PBMC
peripheral blood mononuclear cell
- TGF
transforming growth factor
- GC
gastric cancer
- ICOS
inducible costimulator
- ICOSL
inducible costimulator ligand
Disclosure Statement
The authors have no conflict of interest.
Supporting Information
Additional supporting information may be found in the online version of this article:
Fig. S1. Gating strategy of flow cytometry.
Fig. S2. Positive control of immunofluorescence (lymph node).
Fig. S3. Positive controls of immunohistochemical analysis (tonsil).
Fig. S4. Standard curve for ELISA.
References
- 1.Jemal A, Bray F, Center MM, Ferlay J, Ward E, Forman D. Global cancer statistics. CA Cancer J Clin. 2002;61:69–90. doi: 10.3322/caac.20107. [DOI] [PubMed] [Google Scholar]
- 2.Brenner H. Long-term survival rates of cancer patients achieved by the end of the 20th century: a period analysis. Lancet. 2002;360:1131–5. doi: 10.1016/S0140-6736(02)11199-8. [DOI] [PubMed] [Google Scholar]
- 3.Brenner H, Stegmaier C, Ziegler H. Long-term survival of cancer patients in Germany achieved by the beginning of the third millenium. Ann Oncol. 2005;16:981–6. doi: 10.1093/annonc/mdi186. [DOI] [PubMed] [Google Scholar]
- 4.Sasada T, Kimura M, Yoshida Y, Kanai M, Takabayashi A. CD4+ CD25+ regulatory T cells in patients with gastrointestinal malignancies: possible involvement of regulatory T cells in disease progression. Cancer. 2003;98:1089–99. doi: 10.1002/cncr.11618. [DOI] [PubMed] [Google Scholar]
- 5.Ichihara F, Kono K, Takahashi A, Kawaida H, Sugai H, Fujii H. Increased populations of regulatory T cells in peripheral blood and tumor-infiltrating lymphocytes in patients with gastric and esophageal cancers. Clin Cancer Res. 2003;9:4404–8. [PubMed] [Google Scholar]
- 6.Shen Y, Qu QX, Zhu YB, Zhang XG. Analysis of CD8 + CD28-T-suppressor cells in gastric cancer patients. J Immunoassay Immunochem. 2012;33:149–55. doi: 10.1080/15321819.2011.609575. [DOI] [PubMed] [Google Scholar]
- 7.Sakaguchi S, Yamaguchi T, Nomura T, Ono M. Regulatory T cells and immune tolerance. Cell. 2008;133:775–87. doi: 10.1016/j.cell.2008.05.009. [DOI] [PubMed] [Google Scholar]
- 8.Liyanage UK, Moore TT, Joo HG, et al. Prevalence of regulatory T cells is increased in peripheral blood and tumor microenvironment of patients with pancreas or breast adenocarcinoma. J Immunol. 2002;169:2756–61. doi: 10.4049/jimmunol.169.5.2756. [DOI] [PubMed] [Google Scholar]
- 9.Miller AM, Lundberg K, Ozenci V, et al. CD4 + CD25high T cells are enriched in the tumor and peripheral blood of prostate cancer patients. J Immunol. 2006;177:7398–405. doi: 10.4049/jimmunol.177.10.7398. [DOI] [PubMed] [Google Scholar]
- 10.Woo EY, Chu CS, Goletz TJ, et al. Regulatory CD4(+)CD25(+) T cells in tumors from patients with early-stage non-small cell lung cancer and late-stage ovarian cancer. Cancer Res. 2001;61:4766–72. [PubMed] [Google Scholar]
- 11.Curiel TJ, Coukos G, Zou L, et al. Specific recruitment of regulatory T cells in ovarian carcinoma fosters immune privilege and predicts reduced survival. Nat Med. 2004;10:942–9. doi: 10.1038/nm1093. [DOI] [PubMed] [Google Scholar]
- 12.Ito T, Hanabuchi S, Wang YH, et al. Two functional subsets of FOXP3 + regulatory T cells in human thymus and periphery. Immunity. 2008;28:870–80. doi: 10.1016/j.immuni.2008.03.018. [DOI] [PMC free article] [PubMed] [Google Scholar]
- 13.Chen Y, Shen S, Gorentla BK, Gao J, Zhong XP. Murine regulatory T cells contain hyperproliferative and death-prone subsets with differential ICOS expression. J Immunol. 2012;188:1698–707. doi: 10.4049/jimmunol.1102448. [DOI] [PMC free article] [PubMed] [Google Scholar]
- 14.Strauss L, Bergmann C, Szczepanski MJ, Lang S, Kirkwood JM, Whiteside TL. Expression of ICOS on human melanoma-infiltrating CD4 + CD25highFoxp3 + T regulatory cells: implications and impact on tumor-mediated immune suppression. J Immunol. 2008;180:2967–80. doi: 10.4049/jimmunol.180.5.2967. [DOI] [PubMed] [Google Scholar]
- 15.Chen YL, Fang JH, Lai MD, Shan YS. Depletion of CD4(+)CD25(+) regulatory T cells can promote local immunity to suppress tumor growth in benzo[a]pyrene-induced forestomach carcinoma. World J Gastroenterol. 2008;14:5797–809. doi: 10.3748/wjg.14.5797. [DOI] [PMC free article] [PubMed] [Google Scholar]
- 16.Lande R, Gilliet M. Plasmacytoid dendritic cells: key players in the initiation and regulation of immune responses. Ann N Y Acad Sci. 2010;1183:89–103. doi: 10.1111/j.1749-6632.2009.05152.x. [DOI] [PubMed] [Google Scholar]
- 17.Zou W, Machelon V, Coulomb-L'Hermin A, et al. Stromal-derived factor-1 in human tumors recruits and alters the function of plasmacytoid precursor dendritic cells. Nat Med. 2001;7:1339–46. doi: 10.1038/nm1201-1339. [DOI] [PubMed] [Google Scholar]
- 18.Treilleux I, Blay JY, Bendriss-Vermare N, et al. Dendritic cell infiltration and prognosis of early stage breast cancer. Clin Cancer Res. 2004;10:7466–74. doi: 10.1158/1078-0432.CCR-04-0684. [DOI] [PubMed] [Google Scholar]
- 19.Ito T, Yang M, Wang YH, et al. Plasmacytoid dendritic cells prime IL-10-producing T regulatory cells by inducible costimulator ligand. J Exp Med. 2007;204:105–15. doi: 10.1084/jem.20061660. [DOI] [PMC free article] [PubMed] [Google Scholar]
- 20.Conrad C, Gregorio J, Wang YH, et al. Plasmacytoid Dendritic Cells Promote Immunosuppression in Ovarian Cancer via ICOS Costimulation of Foxp3 + T-Regulatory Cells. Cancer Res. 2012;72:5240–9. doi: 10.1158/0008-5472.CAN-12-2271. [DOI] [PMC free article] [PubMed] [Google Scholar]
- 21.McCarty MF, Bielenberg D, Donawho C, Bucana CD, Fidler IJ. Evidence for the causal role of endogenous interferon-alpha/beta in the regulation of angiogenesis, tumorigenicity, and metastasis of cutaneous neoplasms. Clin Exp Metastasis. 2002;19:609–15. doi: 10.1023/a:1020923326441. [DOI] [PubMed] [Google Scholar]
- 22.Faith A, Peek E, McDonald J, et al. Plasmacytoid dendritic cells from human lung cancer draining lymph nodes induce Tc1 responses. Am J Respir Cell Mol Biol. 2007;36:360–7. doi: 10.1165/rcmb.2006-0284OC. [DOI] [PubMed] [Google Scholar]
- 23.Hofmann MA, Kors C, Audring H, Walden P, Sterry W, Trefzer U. Phase 1 evaluation of intralesionally injected TLR9-agonist PF-3512676 in patients with basal cell carcinoma or metastatic melanoma. J Immunother. 2008;31:520–7. doi: 10.1097/CJI.0b013e318174a4df. [DOI] [PubMed] [Google Scholar]
- 24.Jensen TO, Schmidt H, Moller HJ, et al. Intratumoral neutrophils and plasmacytoid dendritic cells indicate poor prognosis and are associated with pSTAT3 expression in AJCC stage I/II melanoma. Cancer. 2012;118:2476–85. doi: 10.1002/cncr.26511. [DOI] [PubMed] [Google Scholar]
- 25.Vermi W, Bonecchi R, Facchetti F, et al. Recruitment of immature plasmacytoid dendritic cells (plasmacytoid monocytes) and myeloid dendritic cells in primary cutaneous melanomas. J Pathol. 2003;200:255–68. doi: 10.1002/path.1344. [DOI] [PubMed] [Google Scholar]
- 26.Sisirak V, Faget J, Vey N, et al. Plasmacytoid dendritic cells deficient in IFNalpha production promote the amplification of FOXP3 regulatory T cells and are associated with poor prognosis in breast cancer patients. Oncoimmunology. 2013;2:e22338. doi: 10.4161/onci.22338. [DOI] [PMC free article] [PubMed] [Google Scholar]
- 27.Sorrentino R, Morello S, Luciano A, et al. Plasmacytoid dendritic cells alter the antitumor activity of CpG-oligodeoxynucleotides in a mouse model of lung carcinoma. J Immunol. 2010;185:4641–50. doi: 10.4049/jimmunol.1000881. [DOI] [PubMed] [Google Scholar]
- 28.Ogata M, Ito T, Shimamoto K, et al. Plasmacytoid dendritic cells have a cytokine-producing capacity to enhance ICOS ligand-mediated IL-10 production during T-cell priming. Int Immunol. 2013;25:171–82. doi: 10.1093/intimm/dxs103. [DOI] [PubMed] [Google Scholar]
- 29.Bontkes HJ, Ruizendaal JJ, Kramer D, Meijer CJ, Hooijberg E. Plasmacytoid dendritic cells are present in cervical carcinoma and become activated by human papillomavirus type 16 virus-like particles. Gynecol Oncol. 2005;96:897–901. doi: 10.1016/j.ygyno.2004.10.040. [DOI] [PubMed] [Google Scholar]
- 30.Fontenot JD, Rasmussen JP, Gavin MA, Rudensky AY. A function for interleukin 2 in Foxp3-expressing regulatory T cells. Nat Immunol. 2005;6:1142–51. doi: 10.1038/ni1263. [DOI] [PubMed] [Google Scholar]
- 31.Zou T, Satake A, Corbo-Rodgers E, et al. Cutting edge: IL-2 signals determine the degree of TCR signaling necessary to support regulatory T cell proliferation in vivo. J Immunol. 2012;189:28–32. doi: 10.4049/jimmunol.1200507. [DOI] [PMC free article] [PubMed] [Google Scholar]
- 32.Cao X, Cai SF, Fehniger TA, et al. Granzyme B and perforin are important for regulatory T cell-mediated suppression of tumor clearance. Immunity. 2007;27:635–46. doi: 10.1016/j.immuni.2007.08.014. [DOI] [PubMed] [Google Scholar]
- 33.Fu J, Xu D, Liu Z, et al. Increased regulatory T cells correlate with CD8 T-cell impairment and poor survival in hepatocellular carcinoma patients. Gastroenterology. 2007;132:2328–39. doi: 10.1053/j.gastro.2007.03.102. [DOI] [PubMed] [Google Scholar]
Associated Data
This section collects any data citations, data availability statements, or supplementary materials included in this article.
Supplementary Materials
Fig. S1. Gating strategy of flow cytometry.
Fig. S2. Positive control of immunofluorescence (lymph node).
Fig. S3. Positive controls of immunohistochemical analysis (tonsil).
Fig. S4. Standard curve for ELISA.