

Abstract
Tumor angiogenesis contributes to inferior prognosis in osteosarcoma. Apurinic/apyrimidinic endonuclease 1 (APE1) and fibroblast growth factor 2 (FGF2) and its receptor 3 (FGFR3) signaling pathway plays an important role in the angiogenic process. In this study we observed that high expression of APE1, FGF2 and FGFR3, and microvessel density are positively correlated with poor prognosis of osteosarcoma patients. Furthermore, the Cox model showed that the tumor size, FGF2 and its receptor 3 (FGFR3), and microvessel density were adverse prognostic factors. Based on our clinical data, and the fact that APE1 is involved in tumor angiogenesis, we hypothesize that it is very likely that APE1 may indirectly promote angiogenesis by upregulating fibroblast FGF2 and FGFR3. Our preliminary data show small interfering RNA-mediated silence of APE1 experiments, which further supports this hypothesis. APE1-small interfering RNA significantly inhibited tumor angiogenesis by downregulating in vitro expression of FGF2 and FGFR3 in human umbilical vein endothelial cells in Matrigel tube formation assay, and further inhibited tumor growth in vivo in a mouse xenograft model. Thus, the proposed APE1-FGF2 and FGFR3 pathway may provide a novel mechanism for regulation of FGF2 and FGFR3 by APE1 in tumor angiogenesis.
Keywords: Cancer, microvessel density, osteosarcoma, tumor angiogenesis, xenograft
Osteosarcoma is the most common primary bone malignancy in adolescents and children.(1) Due to the evolution of comprehensive neo-adjuvant chemotherapy, and improvement in limb-salvage surgery, the 5-year overall survival rate has been increased to nearly 70%.(2,3) However, approximately 30–35% of these patients still have local or systemic relapses.(2–4) A statistically significant poorer outcome has been associated in osteosarcoma patients (18–30 years) because of an increased rate of relapse.(5) Therefore, identification of novel targets and development of new therapeutic approaches are required to improve patient prognosis.
Angiogenesis is a critical step in tumor growth and metastasis.(6,7) Osteosarcoma is a highly vascular tumor characterized by a malignant and metastatic potential.(8–10) Therefore, unveiling the angiogenic mechanism of osteosarcoma cells may lead to the development of novel and effective strategies for the treatment of osteosarcoma. In fact, human apurinic/apyrimidinic endonuclease 1 (APE1) is an upstream effector of vascular endothelial growth factor (VEGF) and other angiogenesis-related molecules,(11) as well as being involved in tumor development, progression and angiogenesis.(12–17) Meanwhile, fibroblast growth factor 2 (FGF2) has been shown to have potential angiogenic functions,(18–22) and FGFR3, as one of the FGF family receptors, plays a role in tumorigenesis.(23) However, it is yet unclear whether the high expression of APE1 and FGF2/FGFR3 is unrelated or one regulates the other in the angiogenesis of osteosarcoma.
High expression of APE1 was found to be negatively correlated with prognosis of osteosarcoma and siRNA-mediated silence of APE1, which led to enhanced cell sensitization to the DNA damaging agents,(24) and that APE1-siRNA could enhance the sensitivity of osteosarcoma cells to endostatin.(25) Our clinical data show that: (i) the poor prognosis of osteosarcoma patients was significantly correlated with higher expression of APE1, FGF2, FGFR3 and microvessel density (MVD) using Spearman's rank correlation coefficient analysis; and (ii) FGF2/FGFR3, MVD and tumor size, but not APE1, were important indicators for the prognosis of osteosarcoma in patients, as shown by multivariate analysis. Based on these analyses, and the fact that APE1 is involved in tumor angiogenesis, we hypothesized that it is likely that APE1 may indirectly promote angiogenesis by upregulating FGF2/FGFR3.
We further demonstrated that APE1-siRNA significantly inhibited tumor angiogenesis by downregulating FGF2 and FGFR3 in vitro using HUVEC Matrigel tube formation assays and in vivo using a xenograft mouse model. These results may provide a novel mechanism for the role of APE1 to upregulate FGF2/FGFR3 in tumor angiogenesis. To the best of our knowledge, this is the first study to focus on the pro-angiogenic role of APE1 by upregulating the FGF2/FGFR3 in the angiogenesis of osteosarcoma.
Materials and Methods
Laboratory animals
Balb/c nude mice were acclimatized for 1 week and housed in autoclaved cages with ad libitum access to food and water in HEPA-filtered racks (Dwyer Instruments, Inc., Michigan, IN, USA) and were closely monitored. All experimental protocols were approved by the Ethics Committee of the Third Military Medical University, China.
Clinical subjects
Eighty patients with intramedullary osteosarcoma in the long bones of the extremities were treated in Daping Hospital, Third Military Medical University in China from 1968 to 1993. Among these, 75 surgical and five biopsy patients were selected (52 male and 28 female with a mean age of 23 years [11–68 years]). Fifty-four cases (62.5%) were in the second decade of their lives and the tumor (5–25 cm in diameter) had invaded the soft tissue in most of the patients (92.5%). The histological grades and bone tumor types were determined according to Enneking staging system(26) and Ross FG classification.(27) We obtained informed consent from 80 patients.
From the group of 80 patients, 35 were treated with amputation and chemotherapy, 24 with amputation only, and 17 with excision of the tumoral segment followed by inactivation and replantation or end-to-end connection of the amputated ends, and four patients did not receive any treatment. All the patients were followed up.
Reagents and cell lines
The custom APE1-siRNA (5′-GUCUGGUACGACUGGAGUACC-3′, 5′-UACUCCAGUCGUACCAGACCU-3′) and the negative control (5′-CCAUGAGGUCAGCAUGGUCUG-3′, 5′-GACCAUGCUGACCUCAUGGAA-3′) were devised according to Wang et al.,(24) and recombinant FGF2 was purchased from Sigma–Aldrich (St. Louis, MO, USA).
Human osteosarcoma 9901 cells were donated by Professor Qingyu Fan (Fourth Military Medical University, Xian, China) and HUVEC were purchased from the American Type Culture Collection (Manassas, VA, USA). The HUVEC were grown in DMEM (HyClone, Logan, UT, USA) supplemented with 10% FBS, 100 units/mL penicillin and 100 μg/mL streptomycin. The human osteosarcoma 9901 cell lines were cultured in RPMI 1640 (ThermoFisher, Beijing, China) supplemented with 10% FBS.
Immunohistochemical analysis
Tumor tissues were fixed overnight in 4% paraformaldehyde, dehydrated, embedded in paraffin and sectioned (Leica RM2235, [Solms, German]). Immunohistochemical assays were performed on tumor sections (4.5 μm) using a rabbit polyclonal antibody against FGF2 (1:250), a rabbit polyclonal antibody against FGFR3 (1:250) and a mouse monoclonal antibody against APE1 (1:10 000), which were purchased from Santa Cruz (CA, USA), and a mouse monoclonal antibody against CD34 (1:200, ZSGB-BIO, Beijing, China). DAB (3, 3′-diaminobenzidine) was used as a chromogenic substrate and the sections were counterstained with hematoxylin. Tissues were scored for percentage of cell staining and intensity of staining. Low staining intensity was defined as when the tissue showed weak staining and positive cell percentage was less than 50%, whereas it was considered moderate when staining was medium and a positive percentage was less than 25%. MVD was defined as all CD34-positive endothelial cell(s) separate from adjacent microvessels.(25) For the quantification of MVD, cells were counted at 200× magnification by rotating the graticule to the view of the eye piece with the maximum number of stained vessel. For each section, three fields were captured and the results were expressed as the mean ± SD. Primary antibody was substituted for PBS as a negative control.
Transfection of apurinic/apyrimidinic endonuclease 1-siRNA
Human osteosarcoma 9901 cells were seeded on five 60-mm tissue culture dishes and grown to 60% confluence. Cells were transfected with various doses of APE1-siRNA, 0.3 nM negative control was used as the scramble control, and Optimem I (Gibco, New York, NY, USA) as the blank control. The siRNA was combined with lipofectamine 2000 (Invitrogen, CA, USA) in Optimem I according to the manufacturer's instructions. Six hours post-incubation, the medium was replaced with RPMI 1640 plus 10% FBS and the incubation was further continued for 48 h.
The silencing of APE1 was confirmed by western blot analysis, and the culture supernatants for each tumor-condition medium (TCM) group were collected for further study.(28)
Western blot analysis
Intracellular APE1, FGF2 and FGFR3 were determined by western blot analysis as described previously.(29) Briefly, equal protein aliquots in each sample were resolved in 12% SDS-PAGE and transferred to a PVDF membrane. After being blocked with 10% skimmed milk, the membranes were probed with primary antibody. The following antibodies were used: mouse monoclonal antibody against APE1 (1:8000), mouse monoclonal antibody against β-actin (1:2000), rabbit polyclonal antibody against FGF2 (1:500) and rabbit polyclonal antibody against FGFR3 (1:500). Membranes were then probed using either a goat anti-rabbit or a goat anti-mouse HRP-conjugated secondary antibody (Signalway Antibody, Nanjing, China).
In vitro transwell migration assay
HUVEC in 60-mm tissue culture dishes were washed with PBS and treated with trypsin. The isolated cells were then counted for use in migration assay.(25,30) The assays were carried out using transwell chamber (24-well plates with an 8.0 μm pore size [BD Biosciences, San Diego, CA, USA]) and according to the manufacturer's instructions. In brief, the serum-free DMEM culture media containing 64 000 HUVEC was applied to the upper chamber of the transwells. The lower compartment was filled with culture medium that contained human osteosarcoma 9901 cells treated with Optimem I medium, 0.1 nM or 0.3 nM APE1-siRNA. After 16 h of incubation, the migration cells were fixed and stained using crystal violet staining. The number of migration cells was counted under a microscope for five random areas at 200× magnification.
In vitro Matrigel tube formation assay
Tube formation assay was carried out as previously described.(15,31) In brief, HUVEC were cultured in the TCM (800 μL) as described above at a density of 128 000 cells per well in a 24-well plate pre-coated with 400 μL of thick Matrigel (BD Biosciences). The HUVEC were then incubated at 37°C and 5% CO2 for 24 h. The capillary tube formation was photographed using a Leica DMIL phase contrast inverted microscope (Solms, Germany) in five random areas at 4× magnification. Tubulogenesis was evaluated by counting the number of completely enclosed endothelial networks in each well. Each group had three wells, and the experiment was performed in duplicate.
Tumor angiogenesis in xenograft mouse model and immunohistochemical analysis
The animal tumor model and the treatment methods used were the same as in Wang et al.(25) BALB/c nude mice of 4–5 weeks of age were randomly assigned to each group of five mice. Human osteosarcoma 9901 cells were grown to 80–90% confluence, harvested, prepared at 1 × 10⁷ cells per 200 μL cell suspensions, and inoculated s.c. in the oxter of the right-anterior limb of nude mice. When tumors grew to approximately 50 mm3, experimental group mice were treated with APE1-siRNA (20 μg, i.t. injection, once every 3 days) for 14 consecutive days. The control group mice were administrated with the same volume of PBS only. The body weight and tumor volume of each mouse were recorded every day. After 14 days, mice were killed and tumors were removed and fixed in a formalin solution for immunohistochemical analysis. The tumor sections were stained for APE1, FGF2, FGFR3 and CD34. The reagents and methods used for immunohistochemistry were as described above.
The tumor volume was calculated according to the formula of A × B2 × 0.52,(28) where A is the largest diameter (mm) and B is the smallest diameter (mm). The results were quantified by sum integral optical density using Image-Pro Plus analysis software.
Statistical analysis
Spearman's rank correlation coefficient was calculated for comparison of APE1 and FGF2/FGFR3 for MVD. Kaplan–Meier survival calculations and the log-rank tests were carried out to determine differences in overall survival rates for the univariate analysis. The Cox model was applied to estimate the influence of APE1, FGF2/FGFR3 and MVD on the prognosis. Statistical analysis for in vitro and in vivo samples was performed using the Student's t-test. The data are presented as mean ± SD. A P-value of <0.05 was considered to be statistically significant.
Results
Expression of apurinic/apyrimidinic endonuclease 1, fibroblast growth factor 2, its receptor 3 and CD34 in human osteosarcoma
A total of 80 separate osteosarcoma tissue blocks were processed using immunostaining and analyzed for APE1, FGF2, FGER3 and CD34. APE1 antibody staining was mostly localized in the nucleus and the cytoplasm. Out of the total of 80, 55 cases (68.8%) exhibited high levels of APE1 expression (Fig. 1a) and 46 cases (57.5%) consistently showed high expression of FGF2 and FGFR3 (Fig. 1b,c) in the cytoplasm of tumor cells and epithelium of new capillaries. A microvessel is defined as any endothelial cell that is CD34-positive. CD34 antibody staining was mainly localized in the cytoplasm and membrane of vascular endothelial cells in tumor stroma (Fig. 1d). The MVD value in the tumor sections varied from 7 to 93 microvessels per 200× field.
Fig. 1.
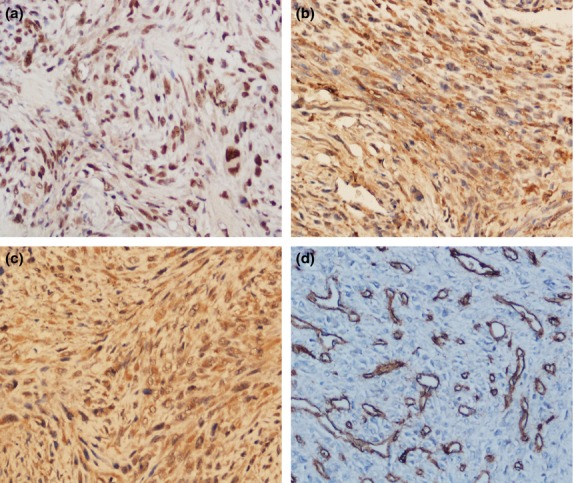
Representative highly positive immunohistochemical (200×) expression of apurinic/apyrimidinic endonuclease 1 (APE1), fibroblast growth factor 2 (FGF2) and its receptor 3 (FGFR3) and CD34 in human osteosarcoma. (a) APE1 antibody staining was predominantly localized in the nucleus. (b, c) FGF2 and FGFR3 were consistently present in the cytoplasm of tumor cells. (d) CD34 antibody staining was mainly observed in the membrane of vascular endothelial cells and cytoplasm of tumor stroma, and microvessel density was defined as CD34-positive endothelial cells separated from adjacent microvessels.
Poor prognosis due to microvessel density as a result of high expression of fibroblast growth factor 2 and its receptor 3 and apurinic/apyrimidinic endonuclease 1 in human osteosarcoma
As expected, the protein expression of APE1, FGF2, FGFR3 and the MVD were high in osteosarcoma tissues. Therefore, we further investigated the correlation of these factors which may contribute to prognosis.
The correlation between the expression of APE1, FGF2/FGFR3 and MVD outlined in Table 1 shows that APE1 and FGF2/FGFR3 are significantly associated with MVD when univariate analysis and the Cox model are used to investigate prognostic factors. The overall survival analysis of osteosarcoma patients shows that the 2-year and 5-year survival rates were 33.8% and 18.3%, respectively (Fig. 2). To investigate the correlation between the prognosis and the clinco-pathological factors, such as age, gender, histopathology, Enneking Staging and tumor size, APE1, FGF2/FGFR3 and MVD, a log-rank test was carried out for univariate analysis.
Table 1.
Correlation of APE1, FGF2/FGFR3 and MVD
| MVD | APE1 | FGF2 | |
|---|---|---|---|
| MVD | 1.000 | 0.350 | 0.374 |
| P value | 0.000 | 0.001 | 0.000 |
| APE1 | 0.350 | 1.000 | 0.402 |
| P value | 0.001 | 0.000 | 0.000 |
| FGF2/FGFR3 | 0.374 | 0.402 | 1.000 |
| P value | 0.000 | 0.000 | 0.000 |
APE1, apurinic/apyrimidinic endonuclease1; FGF2, fibroblast growth factor 2; FGFR3, fibroblast growth factor receptor 3; MVD, microvessel density.
Fig. 2.
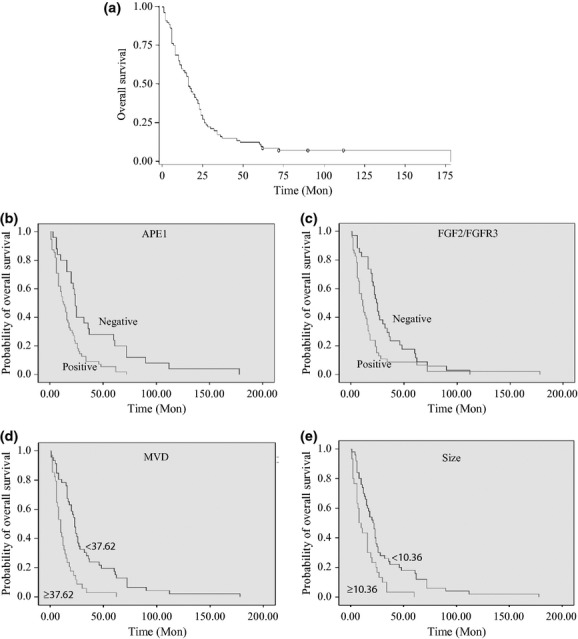
The survival analysis of 80 patients with osteosarcoma. (a) The overall survival analysis shows that 2-year and 5-year survival rates were 33.8% and 18.3%, respectively. (b–e) The univariate analysis shows that APE1 (n = 80, P < 0.05), FGF2/FGFR3 (n = 80, P < 0.05), microvessel density (MVD; n = 80, P < 0.05) and tumor size (n = 80, P < 0.05) significantly affect prognosis.
Our results demonstrate that APE1, FGF2/FGFR3 and MVD and tumor size were important indicators and had a significant effect on prognosis of osteosarcoma (Table 2). Moreover, multivariate analysis for prognosis using the Cox model indicates that these four factors had an effect according to their ratio risk value, FGF2/FGFR3 > Size > MVD (Table 3).
Table 2.
Univariate analysis for prognosis
| Number (80) | Overall survival |
||
|---|---|---|---|
| Median OS (months) | Univariate analysis χ2 P | ||
| Age (years) | |||
| High (≥19) | 53 | 19 | 0.056 |
| Low (<19) | 27 | 12 | |
| Gender | |||
| Male | 49 | 16 | 0.383 |
| Female | 31 | 20 | |
| Histopathology | |||
| Chondroblastic | 16 | 19 | 0.102 |
| Fibroblastic | 24 | 15 | |
| Mixed | 5 | 14 | |
| Small cell | 3 | 7 | |
| Osteoblastic | 32 | 16 | |
| Enneking staging | |||
| I | 9 | 20 | 0.102 |
| II | 36 | 21 | |
| III | 35 | 13 | |
| Size | |||
| <10.36 | 50 | 21 | 0.002** |
| ≥10.36 | 30 | 8 | |
| High expression of FGF2/FGFR3 | |||
| (−) | 34 | 24 | 0.006** |
| (+) | 46 | 11 | |
| MVD | |||
| <37.62 | 46 | 23 | 0.000** |
| ≥37.62 | 34 | 10 | |
| High expression of APE1 | 55 | 13 | 0.001** |
P < 0.01. APE1, apurinic/apyrimidinic endonuclease; FGF2, fibroblast growth factor 2; FGFR3, fibroblast growth factor receptor 3; MVD, microvessel density.
Table 3.
Correlation between prognosis MVD, FGF2/FGFR3 and MVD expression
| Variable | Degrees of freedom | Parameter estimate | Standard error | Wald χ2 | Pr > χ2 | Risk ratio |
|---|---|---|---|---|---|---|
| APE1 | 1 | 0.279 | 0.301 | 2.205 | 0.155 | 1.322 |
| Size | 1 | 0.107 | 0.041 | 6.952 | 0.008 | 1.113 |
| MVD | 1 | 0.014 | 0.005 | 7.770 | 0.005 | 1.015 |
| FGF2/FGFR3 | 1 | 0.608 | 0.242 | 6.331 | 0.012 | 1.837 |
APE1, apurinic/apyrimidinic endonuclease 1; FGF2, fibroblast growth factor 2; FGFR3, fibroblast growth factor receptor 3; MVD, microvessel density.
Apurinic/apyrimidinic endonuclease 1-siRNA-mediated downregulation of in vitro protein expression of fibroblast growth factor 2 and its receptor 3
To validate whether APE1 is involved in the regulation of FGF2 and FGFR3 expression, we examined the intracellular expression of APE1, FGF2 and FGFR3 in human osteosarcoma 9901 cells transfected with APE1-siRNA, the negative control or Optimem I by western blot analysis. As shown in Figure 3, the expression of APE1, FGF2 and FGFR3 was significantly decreased in these cells transfected with APE1-siRNA (0.3 nM), and the inhibition rate of APE1, FGF2, FGFR3 protein was approximately 77.1%, 87.5% and 83.3%, respectively, in the treatment group compared to the scramble control (P < 0.01), and the scramble control did not affect the APE1 expression compared to the blank control (P = 0.1655). The results show that siRNA-mediated silence of APE1 expression significantly downregulated the expression of FGF2 and FGFR3 in vitro, suggesting that APE1 might upregulate the expression of FGF2 and FGFR3.
Fig. 3.

Western blot analysis illustrates that apurinic/apyrimidinic endonuclease 1 (APE1)-siRNA decreases intracellular expression of APE1, fibroblast growth factor 2 (FGF2) and its receptor 3 (FGFR3) proteins. The 9901 cells were treated with Optimum I as blank control, with the negative control as scramble control, or various concentration of APE1-siRNA (0.1, 0.2 and 0.3 nM). The siRNA-mediated silence of APE1 expression significantly suppressed FGF2 and FGFR3 expression in a dose-dependent manner (**P < 0.01). (a) Western blot. (b) The relative levels of APE1 protein. (c) The relative levels of FGF2 protein. (d) The relative levels of FGFR3 protein. Data are represented as mean ± SD.
Apurinic/apyrimidinic endonuclease 1-siRNA suppresses the capacity of tumor cells to promote HUVEC migration and capillary tube formation
To explore the biological significance of the silencing of APE1 upregulated FGF2 and FGFR3 expression in tumor angiogenesis, transwell migration assays were carried out in HUVEC. As shown in Figure 4(a,b), a smaller number of HUVEC was migrated in the 0.3 nM APE1-siRNA treatment group than in the control group (36.20 ± 4.76 vs 113.20 ± 4.97, P < 0.0001) and, unexpectedly, this reduced migration activity was largely restored by an addition of recombinant FGF2 (58.80 ± 8.35 vs 36.20 ± 4.76, P = 0.0008). Furthermore, Matrigel tube formation assays carried out in HUVEC using TCM showed formation of fewer capillary tubes in the presence of TCM derived from cells with APE1-siRNA (0.3 nM) in a dose-dependent manner as compared to the control group (1.80 ± 0.84 vs 28.00 ± 5.83, P < 0.0001; Fig. 4c,d). Similarly, this reduced angiogenic capacity of the TCM was mostly restored with an addition of recombinant FGF2 (8.60 ± 2.70 vs 1.80 ± 0.84, P = 0.0007; Fig. 4c,d).
Fig. 4.

Apurinic/apyrimidinic endonuclease 1 (APE1)-siRNA suppresses the capacity of tumor cells to promote HUVEC migration in a transwell model and tube formation in a Matrigel-based angiogenesis assay. (a) Representative images of migration are presented. Compared to the control, fewer HUVEC were migrated in the lower compartment filled with culture medium that contained APE1-siRNA treated 9901 cells. The migration capacity of the culture medium containing 9901 cells treated with 0.3 nMAPE1-siRNA in the lower compartment was largely restored by an addition of recombinant FGF2. (b) Quantitative analysis of HUVEC migration. (c) HUVEC were cultured in 24-well plates coated with Matrigel in tumor-condition medium (TCM) derived from 9901 cells without transfection or cells were transfected with APE1-siRNA. Representative images of tube formation are presented. In the presence of TCM derived from HUVEC transfected with APE1-siRNA, these cells developed fewer capillary-like structures compared to the control. The angiogenic capacity of the TCM derived from 0.3 nM APE1-siRNA transfected cells was promoted by an addition of recombinant FGF2. (d) Quantitative analysis of HUVEC angiogenesis. Data are represented as mean ± SD (n = 3, **P < 0.01).
Apurinic/apyrimidinic endonuclease 1-siRNA inhibits tumor angiogenesis and growth of xenografts
A BALB/c mouse osteosarcoma xenograft model using human osteosarcoma 9901 cells was used to further demonstrate that APE1-siRNA inhibits tumor angiogenesis and growth. These xenografts were treated with APE1-siRNA or PBS for control, by i.t. injection. The growth of tumors treated with APE1-siRNA was slower than that of the control group (P = 0.0068), and the results of xenograft growth are similar with our before data republished in Cancer Science.(25) Tumor sections were analyzed using immunohistochemistry, and representative images are shown in Figure 5. As expected, the expression levels of APE1, FGF2 and FGFR3 were significantly lower in the APE1-siRNA treatment group (67.8%, 66.0% and 59.9%, respectively) compared to the control group (P < 0.0001; Fig. 5a,b). The density of CD34-positive vessels when using anti-CD34 antibody in tumor sections was much lower in tumors with APE1-siRNA than in the control (P < 0.0001; Fig. 5a,c). These results correlate well with tumor growth and lower expression of APE1, FGF2 and FGFR3 in Figure 5(a,b) (less FGF2 and FGFR3 downregulated by APE1-siRNA, and less tumor angiogenesis and growth). Taken together, these results suggest that APE1-siRNA significantly inhibits tumor angiogenesis and growth in vivo by downregulating FGF2 and FGFR3 expression.
Fig. 5.

Apurinic/apyrimidinic endonuclease 1 (APE1)-siRNA inhibits osteosarcoma angiogenesis in a xenograft mouse model. An in vivo osteosarcoma model was established by an injection of 9901 cells, and xenografts were treated with APE1-siRNA or PBS. (a) Representative photographs of immunohistochemistry of APE1, fibroblast growth factor 2 (FGF2), its receptor 3 (FGFR3) and CD34 in tumor sections of mice. (b) Density of immunohistochemical staining signal for APE1, FGF2 and FGFR3 expression (P < 0.05). (c) APE1 decreases the number of CD34-positive vessels in tumor sections (P < 0.05). Data are presented as mean ± SD.
Discussion
Angiogenesis contributes to poor prognosis of cancer patients.(32,33) Interestingly, APE1 is an upstream effector of many molecules, is involved in angiogenesis and plays a key role in tumor angiogenesis.(11,15–17) FGF2 has been suggested as a new anti-angiogenic target.(20–22) To investigate how APE1 interacts with FGF2/FGFR3 in tumor angiogenesis, a correlation analysis between prognosis in osteosarcoma patients and the factors affecting the prognosis, including APE1, FGF2/FGFR3, tumor size and MVD, was performed. The in vitro and in vivo mechanism of APE1-siRNA regulation of FGF2/FGFR3 with regard to tumor angiogenesis was also examined. Our clinical data show that the poor prognosis in patients with osteosarcoma is significantly correlated with higher expression of APE1, FGF2, FGFR3 and MVD. More importantly, the Spearman's rank correlation coefficient shows that APE1, FGF2 and FGFR3 are considerably associated with MVD. These data suggest that the poor prognosis of osteosarcoma patients could be largely due to MVD, which may at least partially result from the high expression of APE1 and FGF2/FGFR3. Multivariate analysis of these factors and tumor size, which significantly affects the prognosis, demonstrates that FGF2/FGFR3, MVD and tumor size but not APE1, were important indicators for the prognosis of osteosarcoma in these patients. Osteosarcoma is a highly vascular tumor,(8) and APE1 is an upstream effector of VEGF,(11) and is involved in tumor development, progression and angiogenesis.(12–17) Therefore, it is very likely that APE1 may indirectly promote angiogenesis by upregulating FGF2/FGFR3.
Indeed, our results show that siRNA-mediated silence of APE1 expression decreased in vitro expression of FGF2 and FGFR3; APE1-siRNA (0.3 nM) also markedly inhibited migration of HUVEC and abrogated angiogenesis compared to the control. Importantly, the reduced migration and angiogenic capacity through APE1-siRNA treatment was largely restored with in vitro supplements of recombinant FGF2 as compared to the control. APE1-siRNA further suppressed CD34 expression and tumor growth in xenografts. Previous studies also report that APE1-siRNA effectively suppresses APE1 protein expression and thereby enhances the sensitivity of osteosarcoma to DNA damaging agents and endostatin, as well as increases the sensitivity of colorectal cancer cells or human hepatocellular carcinoma cells to radiotherapy in vitro and in vivo.(24,25,29,34)
The current study demonstrates that the reduced angiogenesis activity for the APE1-siRNA transfected HUVEC may be partially due to APE1-siRNA-mediated downregulation of FGF2 and FGFR3. However, the mediator between APE1 and FGF2/FGFR3, if any, remains unknown. Evidently, the FGF2 promoter contains two early growth response gene1 (Egr-1) binding sites. The binding of Egr-1 to the FGF2 promoter could increase transcription of FGF2, which, in turn, stimulates the angiogenic and mitogenic activity of FGF2.(35,36) Brown et al.(19) show that MG624 (a small-molecule α7-nicotinic acetylcholine receptor antagonist) inhibits angiogenesis via the Egr-1/FGF2 pathway in primary human microvascular endothelial cells of the lung. Therefore, we hypothesize that Egr-1 may mediate APE1 to upregulate FGF2/FGFR3, which is involved in the tumor angiogenic process. Further investigation of the molecular mechanism of the APE1-Egr-1/FGF2 pathway in tumor angiogenesis is warranted.
APE1-siRNA markedly inhibited tumor angiogenesis by downregulating FGF2/FGFR3 in vitro and in vivo. Therefore, the APE1-FGF2/FGFR3 pathway identified in the present study may be a valuable molecular target for osteosarcoma therapy. Our primary objective was to use human osteosarcoma as a model to provide “proof-of-concept” for this hypothesized APE1-FGF2/FGFR3 pathway. Further investigation into this pro-angiogenic pathway and also using other cancer models may pave a way for anti-angiogenic therapy.
Acknowledgments
We thank N. Dai and Z. Li for their help in designing part of the experiments, and S.H. Zhang for her help in carrying out clinical statistics. We also thank Medjaden Bioscience Limited for their assistance in the preparation of this manuscript. This work was supported by the National Natural Science Foundation of China (No. 30872975).
Disclosure Statement
The authors have no conflict of interest.
References
- 1.Jemal A, Siegel R, Ward E, et al. Cancer statistics, 2008. CA Cancer J Clin. 2008;58:71–96. doi: 10.3322/CA.2007.0010. [DOI] [PubMed] [Google Scholar]
- 2.Bacci G, Longhi A, Versari M, Mercuri M, Briccoli A, Picci P. Prognostic factors for osteosarcoma of the extremity treated with neoadjuvant chemotherapy: 15-year experience in 789 patients treated at a single institution. Cancer. 2006;6:1154–61. doi: 10.1002/cncr.21724. [DOI] [PubMed] [Google Scholar]
- 3.Meyers PA, Gorlick R, Heller G, et al. Intensification of preoperative chemotherapy for osteogenic sarcoma: results of the Memorial Sloan-Kettering (T12) protocol. J Clin Oncol. 1998;16:2452–8. doi: 10.1200/JCO.1998.16.7.2452. [DOI] [PubMed] [Google Scholar]
- 4.Bacci G, Briccoli A, Longhi A, et al. Treatment and outcome of recurrent osteosarcoma: experience at Rizzoli in 235 patients initially treated with neoadjuvant chemotherapy. Acta Oncol. 2005;44:748–55. doi: 10.1080/02841860500327503. [DOI] [PubMed] [Google Scholar]
- 5.Janeway KA, Barkauskas DA, Krailo MD, et al. Outcome for adolescent and young adult patients with osteosarcoma: a report from the Children's Oncology Group. Cancer. 2012;118:4597–605. doi: 10.1002/cncr.27414. [DOI] [PMC free article] [PubMed] [Google Scholar]
- 6.Carmeliet P, Jain RK. Angiogenesis in cancer and other diseases. Nature. 2000;407:249–57. doi: 10.1038/35025220. [DOI] [PubMed] [Google Scholar]
- 7.Blann AD, Ramcharan KS, Stonelake PS, Luesley D, Lip GY. The angiome: a new concept in cancer biology. J Clin Pathol. 2011;64:637–43. doi: 10.1136/jcp.2011.088948. [DOI] [PubMed] [Google Scholar]
- 8.Tzeng HE, Tsai CH, Chang ZL, et al. Interleukin-6 induces vascular endothelial growth factor expression and promotes angiogenesis through apoptosis signal-regulating kinase 1 in human osteosarcoma. Biochem Pharmacol. 2013;85:531–40. doi: 10.1016/j.bcp.2012.11.021. [DOI] [PubMed] [Google Scholar]
- 9.Minisini AM, Di Loreto C, Mansutti M, et al. Topoisomerase IIα and APE/ref-1 are associated with pathologic response to primary anthracycline-based chemotherapy for breast cancer. Cancer Lett. 2005;224:133–9. doi: 10.1016/j.canlet.2004.11.007. [DOI] [PubMed] [Google Scholar]
- 10.Bajpai J, Sharma M, Sreenivas V, et al. VEGF expression as a prognostic marker in osteosarcoma. Pediatr Blood Cancer. 2009;53:1035–9. doi: 10.1002/pbc.22178. [DOI] [PubMed] [Google Scholar]
- 11.Kelley MR, Georgiadis MM, Fishel ML. APE1/Ref-1 role in redox signaling: translational applications of targeting the redox function of the DNA Repair/Redox protein APE1/Ref-1. Curr Mol Pharmacol. 2012;5:36–53. doi: 10.2174/1874467211205010036. [DOI] [PMC free article] [PubMed] [Google Scholar]
- 12.Wang YT, Tzeng DW, Wang CY, Hong JY, Yang JL. APE1/Ref-1 prevents oxidative inactivation of ERK for G(1)-to-S progression following lead acetate exposure. Toxicology. 2013;305:120–9. doi: 10.1016/j.tox.2013.01.010. [DOI] [PubMed] [Google Scholar]
- 13.Sultana R, McNeill DR, Abbotts R, et al. Synthetic lethal targeting of DNA double-strand break repair deficient cells by human apurinic/apyrimidinic endonuclease inhibitors. Int J Cancer. 2012;131:2433–44. doi: 10.1002/ijc.27512. [DOI] [PMC free article] [PubMed] [Google Scholar]
- 14.Wallace SS, Murphy DL, Sweasy JB. Base excision repair and cancer. Cancer Lett. 2012;327:73–89. doi: 10.1016/j.canlet.2011.12.038. [DOI] [PMC free article] [PubMed] [Google Scholar]
- 15.Jiang A, Gao H, Kelley MR, Qiao X. Inhibition of APE1/Ref-1 redox activity with APX3330 blocks retinal angiogenesis in vitro and in vivo. Vision Res. 2011;51:93–100. doi: 10.1016/j.visres.2010.10.008. [DOI] [PMC free article] [PubMed] [Google Scholar]
- 16.Zou GM, Karikari C, Kabe Y, Handa H, Anders RA, Maitra A. The Ape-1/Ref-1 redox antagonist E3330 inhibits the growth of tumor endothelium and endothelial progenitor cells: therapeutic implications in tumor angiogenesis. J Cell Physiol. 2008;219:209–18. doi: 10.1002/jcp.21666. [DOI] [PubMed] [Google Scholar]
- 17.Tell G, Damante G, Caldwell D, Kelley MR. The intra-cellular localization of APE1/Ref-1: more than a passive phenomenon? Antioxid Redox Signal. 2005;7:367–84. doi: 10.1089/ars.2005.7.367. [DOI] [PubMed] [Google Scholar]
- 18.Schlessinger J. Common and distinct elements in cellular signaling via EGF and FGF receptors. Science. 2004;306:1506–7. doi: 10.1126/science.1105396. [DOI] [PubMed] [Google Scholar]
- 19.Brown KC, Lau JK, Dom AM, et al. MG624, an a7-nAChR antagonist, inhibits angiogenesis via the Egr-1/FGF2 pathway. Angiogenesis. 2012;15:99–114. doi: 10.1007/s10456-011-9246-9. [DOI] [PubMed] [Google Scholar]
- 20.Wang L, Park H, Chhim S, et al. A novel monoclonal antibody to fibroblast growth factor 2 effectively inhibits growth of hepatocellular carcinoma xenografts. Mol Cancer Ther. 2012;11:864–72. doi: 10.1158/1535-7163.MCT-11-0813. [DOI] [PMC free article] [PubMed] [Google Scholar]
- 21.Liekens S, Bronckaers A, Belleri M, et al. The thymidine phosphorylase inhibitor 5′-O-tritylinosine (KIN59) is an antiangiogenic multitarget fibroblast growth factor-2 antagonist. Mol Cancer Ther. 2012;11:817–29. doi: 10.1158/1535-7163.MCT-11-0738. [DOI] [PubMed] [Google Scholar]
- 22.Hussain S, Slevin M, Matou S, et al. Anti-angiogenic activity of sesterterpenes; natural product inhibitors of FGF-2-induced angiogenesis. Angiogenesis. 2008;11:245–56. doi: 10.1007/s10456-008-9108-2. [DOI] [PubMed] [Google Scholar]
- 23.Oneyama C, Ikeda J, Okuzaki D, et al. MicroRNA-mediated downregulation of mTOR/FGFR3 controls tumor growth induced by Src-related oncogenic pathways. Oncogene. 2011;30:3489–501. doi: 10.1038/onc.2011.63. [DOI] [PubMed] [Google Scholar]
- 24.Wang D, Luo M, Kelley MR. Human apurinic endonuclease 1 (APE1) expression and prognostic significance in osteosarcoma: enhanced sensitivity of osteosarcoma to DNA damaging agents using silencing RNA APE1 expression inhibition. Mol Cancer Ther. 2004;3:679–86. [PubMed] [Google Scholar]
- 25.Wang D, Zhong ZY, Li MX, Xiang DB, Li ZP. Vector-based Ape1 small interfering RNA enhances the sensitivity of human osteosarcoma cells to endostatin in vivo. Cancer Sci. 2007;98:1993–2001. doi: 10.1111/j.1349-7006.2007.00616.x. [DOI] [PMC free article] [PubMed] [Google Scholar]
- 26.Enneking WF, Spanier SS, Goodman MA. A system for the surgical staging of musculoskeletal sarcoma. Clin Orthop Relat Res. 1980;153:106–20. [PubMed] [Google Scholar]
- 27.Ross FG. Osteogenic sarcoma. Br J Radiol. 1964;37:259–76. doi: 10.1259/0007-1285-37-436-259. [DOI] [PubMed] [Google Scholar]
- 28.Zhou B, Ma R, Si W, et al. MicroRNA-503 targets FGF2 and VEGFA and inhibits tumor angiogenesis and growth. Cancer Lett. 2013;333:159–69. doi: 10.1016/j.canlet.2013.01.028. [DOI] [PubMed] [Google Scholar]
- 29.Xiang DB, Chen ZT, Wang D, et al. Chimeric adenoviral vector Ad5/F35-mediated APE1 siRNA enhances sensitivity of human colorectal cancer cells to radiotherapy in vitro and in vivo. Cancer Gene Ther. 2008;15:625–35. doi: 10.1038/cgt.2008.30. [DOI] [PubMed] [Google Scholar]
- 30.Yamato I, Sho M, Shimada K, et al. PCA-1/ALKBH3 contributes to pancreatic cancer by supporting apoptotic resistance and angiogenesis. Cancer Res. 2012;72:4829–39. doi: 10.1158/0008-5472.CAN-12-0328. [DOI] [PubMed] [Google Scholar]
- 31.Lai KB, Sanderson JE, Yu CM. The regulatory effect of norepinephrine on connective tissue growth factor (CTGF) and vascular endothelial growth factor (VEGF) expression in cultured cardiac fibroblasts. Int J Cardiol. 2013;163:183–9. doi: 10.1016/j.ijcard.2011.06.003. [DOI] [PubMed] [Google Scholar]
- 32.Azuma K, Kawahara A, Hattori S, et al. NDRG1/Cap43/Drg-1 may predict tumor angiogenesis and poor outcome in patients with lung cancer. J Thorac Oncol. 2012;7:779–89. doi: 10.1097/JTO.0b013e31824c92b4. [DOI] [PubMed] [Google Scholar]
- 33.Fagiani E, Christofori G. Angiopoietins in angiogenesis. Cancer Lett. 2013;328:18–26. doi: 10.1016/j.canlet.2012.08.018. [DOI] [PubMed] [Google Scholar]
- 34.Cun Y, Dai N, Xiong C, et al. Silencing of APE1 enhances sensitivity of human hepatocellular carcinoma cells to radiotherapy in vitro and in a xenograft model. PLoS ONE. 2013;8:e55313. doi: 10.1371/journal.pone.0055313. doi: 10.1371/journal.pone.0055313. [DOI] [PMC free article] [PubMed] [Google Scholar] [Retracted]
- 35.Jin Y, Sheikh F, Detillieux KA, Cattini PA. Role for early growth response-1 protein in alpha(1)-adrenergic stimulation of fibroblast growth factor-2 promoter activity in cardiac myocytes. Mol Pharmacol. 2000;57:984–90. [PubMed] [Google Scholar]
- 36.Jimenez SK, Sheikh F, Jin Y, et al. Transcriptional regulation of FGF-2 gene expression in cardiac myocytes. Cardiovasc Res. 2004;62:548–57. doi: 10.1016/j.cardiores.2004.01.032. [DOI] [PubMed] [Google Scholar]