Abstract
The purpose of the present study was to develop glipizide controlled release nanoparticles using alginate and chitosan thorough ionotropic controlled gelation method. Glipizide is a frequently prescribed second generation sulfonylurea which lowers the blood glucose in type-two diabetics. Quick absorption of the drug from the gastrointestinal tract along with short half- life of elimination makes it a good candidate for controlled release formulations. Alginate-chitosan nanoparticles (ACNP) are convenient controlled delivery systems for glipizide, due to both the release limiting properties of the system, and the bioadhesive nature of the polymers. In the present study, glipizide loaded alginate-chitosan nanoparticles (GlACNP) were prepared, and the particle characteristics including particle size (PS), zeta potential (ZP), entrapment efficiency (EE%), loading percent (LP), and mean release time (MRT), as well as the morphology of the nanoparticles, the drug-excipient compatibility, and the release kinetics along with the drug diffusion mechanism were evaluated. The results suggested that ionotropic controlled gelation method offers the possibility of preparing the nanoparticles in mild conditions in an aqueous environment, and can lead to the preparation of particles with favorable size, controlled release characteristics, and high entrapment efficiency, serving as a convenient delivery system for glipizide. The particle and release characteristics can be efficiently optimized using the Box-Behnken design. Based on the findings of the present study, it is expected that this novel formulation be a superior therapeutic alternative to the currently available glipizide delivery systems.
Keywords: Alginate-chitosan nanoparticles, Ionotropic controlled gelation, Controlled delivery, Experimental designs, Glipizide
INTRODUCTION
Glipizide is a second generation sulfony-lurea which lowers the blood glucose levels in patient suffering from non-insulin dependent diabetes mellitus (NIDDM), through stimulating insulin secretion from the pancreatic islets of Langerhans (1), and several other extra pancreatic effects, such as enhancing sensitivity to insulin and decreasing the hepatic glucose production (2,3). Glipizide appears to be the most effective insulin secretogogue both in the primary phase of insulin secretion and in sustained stimulatory response during long term administration (4). Possessing unserious side effects and imposing low therapeutic costs have promoted the physicians to prescribe glipizide more than ever (5). As a second generation sulfonylurea, the drug presents fewer side effects compared to the first generation medications and other oral hypoglycemic drugs, while the only side effects of the drug, hypoglycemia and weight gain, are much milder with glipizide compared to the other second generations. Besides, unlike other sulfonylureas, glipizide can be administered for patients with renal impairment should the clearance of creatinine be equal to, or more than 10 ml/min (5).
The only inconvenience imposed upon patients by glipizide is its short-acting nature. After rapid absorption from the gastrointestinal tract, glipizide decreases the blood glucose levels in 30 min, with the peak concentration of the drug occurring within 1-3 h (4), and is then rapidly eliminated from the body owing to its short elimination half –life of about 2-4 h. It is, therefore, essential that glipizide follow a twice or thrice daily dosing pattern which can provoke patient incompliance (6). To overcome the aforementioned inconvenience, researchers have endeavored to design new controlled release formulations of glipizide, which can offer other important and no less significant advantages such as better therapeutic efficiency (7,8), better release characteristics (9), potential for cost saving and patentability (8), better control of plasma drug levels (10), more acceptable safety profile (10), and opportunity for extending the product life cycle (8). Alginate-chitosan nanoparticles (ACNP) seem to be most convenient for the delivery of different drugs, particularly glipizide, due to the numerous advantages they offer, such as faster initial absorption rate, fewer side effects, and controlled release of the drug due to release limiting properties of the polymers as well as their mucoadhesive characteristics (11,12,13).
Furthermore, the system is nontoxic, biocompatible, reproducible, and stable overtime (11), and is capable of decreasing the concentration fluctuation within the therapeutic window, as well as the gastro-intestinal side effects. Due to the controlled release nature of the system, the patient can take the medication less frequently, which in turn leads to a higher compliance. However, because of the high surface volume ratio of the nanoparticles, the drug concentration can reach the therapeutic level quite rapidly, an advantage of vital importance for the diabetic patients.
This special release pattern can enhance the bioavailability of the drug compared to the currently available controlled release dosage forms. Moreover, since glipizide is mostly absorbed in the upper parts of the gastrointestinal tract, i.e. stomach and small intestine, the bioadhesive nature of the delivery system can increase the absorption, improve the drug efficiency, and reduce the dose requirement (7). Furthermore, the water solubility of the system can resolve the low water solubility problem associated with glipizide.
Preparation of ACNP through ionotropic controlled gelation method has recently attracted a great deal of attention. In this process, the interaction between alginate in dilute solution with Ca2+ at a special ion concentration along with stirring leads to the production of a pre-gel state (also known as the egg-box structure), while avoiding the gel point and forming a continuous system. Subsequent addition of chitosan solution, as an aqueous polycationic agent, results in a poly electrolyte complex, stabilizing the alginate pre-gel nucleus into individual nanoparticles (14). Development of ACNP using such a method may also offer several advantages. Such a system is easy and inexpensive to manufacture and scale up, and there is no heat, no high sheer forces or organic solvents involved in the preparation process. The system is therefore, technologically convenient, and is suitable for industrial production (11). Taking all the aforementioned advantages associated with the delivery system and the preparation process into consideration, it seems that ACNP can be a convenient carrier for the delivery of glipizide.
Therefore, preparation of glipizide loaded ACNP (GlACNP) through ionotropic controlled gelation along with the characterization and optimization of the system using experimental design methods was selected as the prime objective of the present study.
MATERIALS AND METHODS
Materials
Glipizide was a kind gift from Iran Daru Co. (Tehran, Iran), calcium chloride and low viscosity sodium alginate were obtained from Merck (Germany), and low molecular weight chitosan (MW 60000, degree of acetylation 60 %) was purchased from Sigma-Aldrich (Germany). Other necessary materials such as glacial acetic acid, sodium hydroxide and potassium dihydrogen phosphate were supplied by Merck (Germany). All the chemicals and reagents used were of analytical grade.
Experimental design
As a preliminary study, a Taguchi design was generated to determine the variables significantly affecting the particle characteristics and release properties, as well as their acceptable ranges. In this step, five different independent variables including the sodium alginate, chitosan, calcium chloride, and glipizide concentrations as well as the stirring speed were investigated in two different extreme levels determined through a set of preliminary studies. The significance of the effect of these variables on five different dependent variables including the particle size (PS), zeta potential (ZP), entrapment efficiency (EE%), loading percent (LP), and mean release time (MRT) was studied.
Based on the results attained from the analysis of the responses, four different independent variables including alginate, chitosan, and calcium chloride concentration, as well as the stirring speed were selected to be further investigated using the Box-Behnken design. The Box–Behnken design optimizes the number of experiments to be carried out to ascertain the possible interactions between the parameters studied and their effects on the eventual responses.
Box–Behnken design is a spherical, revolving design comprised of a central point and the middle points of the edges of the cube circumscribed on the sphere. It is a three level fractional factorial design consisting of a full 22 factorial seeded into a balanced incomplete block design. It has been applied for optimization of different chemical and physical processes; and the number of experiments is decided accordingly (15).
In the present study, amongst the five different variables studied using Taguchi design (alginate, chitosan, glipizide, and calcium chloride concentrations as well as the stirring speed), four factors (X1= alginate concentration, X2= chitosan concentration, X3= calcium chloride concentration, and X4= stirring speed) were defined in three levels (low, basal, and high) to be further investigated using the Box-Behnken design, in order to fulfill the characterization, optimization, and prediction purposes.
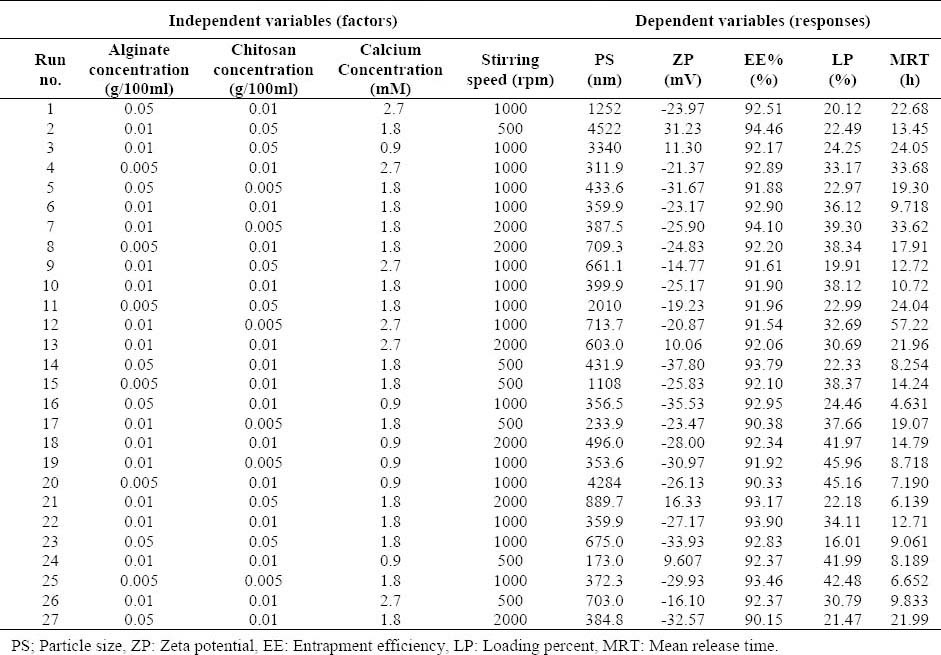
According to the Box-Behnken design generated by Design Expert 8®, 27 formulations including 25 factorial points and 3 replicates at the center point for the estimation of the pure error sum of squares were presented, which were all made in the laboratory and subsequently evaluated in terms of the responses (PS, ZP, EE%, LP, and MRT). Table 1 shows the studied variables along with their levels, while the experiment design matrix generated by the software can be seen in Table 2.
Table 1.
Considered variables and responses along with their levels and constraints.

Table 2.
Box-Behnken design generated by Design Expert 8® software along with the obtained response
Preparation of the nanoparticles
Nanoparticles were prepared using ionotropic controlled gelation method. For this purpose, based on the selected formulation, the required amount of sodium alginate was weighed carefully and dissolved in 80 ml of deionized water. 25 mg glipizide was then accurately weighed and dissolved in 10 ml of 0.1 N sodium hydroxide solution. Calcium chloride and low molecular weight chitosan were also accurately weighed and dissolved in 5 ml of deionized water and 1% W/V acetic acid, respectively.
The volumes of the acetic acid and sodium hydroxide were selected in a way to adjust the final pH at around 5.9-6, to ensure the solubility of both glipizide and chitosan, and the stability of the prepared nanoparticles. This optimized pH was determined through a set of preliminary studies in which the formation of the particles in different pHs was verified.
To initiate the preparation process, sodium alginate solution was stirred with a homogenizer (Heidolf, Germany) at the required stirring speed depending on the formulation. Glipizide solution was then added followed by the dropwise addition of the aqueous calcium chloride solution using an 18-guage syringe. After ten min of homogenization, chitosan solution was added in the same manner, and stirring continued for further fifteen min. The prepared solution containing GlACNP was then subjected to further investigations.
Particle characterization
Particle size was assessed by photon correlation spectroscopy and ZP was measured through laser dropper anemometry by means of Malvern Nano ZS3600 nano zeta sizer (Malvern Co, UK). For this purpose, a volume of 2 ml of the freshly prepared medium containing nanoparticles was transferred to the proper cell, and placed within the analyzing chamber. The PS and ZP values were thus measured at 20 ± 0.5 °C.
Nanoparticles morphology such as shape and the occurrence of aggregation phenomenon was studied using scanning electron microscopy (SEM). To fulfill this goal, previously freeze-dried nanoparticles were mounted on metal stubs; plate coated under the vacuum, and examined with an ALS 2100 scanning electron microscope (Seron technologies Inc, South Korea).
Determination of the entrapment efficiency and loading percent
To measure the EE%, 1 ml of the prepared nanoparticle solution along with 1 ml of a blank solution (containing nanoparticls but no glipizide) were centrifuged in 20000 rpm for 30 min using an ultra- micro centrifuge system (Sigma, Germany). 100 μl of the supernatant was then diluted with 500 μl of 0.1 N sodium hydroxide solution, and the absorbance was measured spectrophotometrically at 270.4 nm. Having subtracted the absorbance of the blank sample from the loaded one, the concentration of the free drug within the supernatant was determined using the previously plotted calibration curve. After the consideration of the dilution ratio, EE% was determined using Equation 1, while LP was calculated on the basis of Equation 2.

In vitro release studies
Release studies were conducted using DO405 dialysis tubing 23 × 15 mm (cut off: 10-12 KD, Sigma Laboratories, Osterode, Germany) in which 5 ml of the prepared sample was transferred, and which was then immersed within 50 ml of phosphate buffer (pH=7.4). The medium was then placed on stirring equipment, the temperature was adjusted at 37 ± 0.5 °C, and the stirring rate was optimized at 220 rpm. Samples (0.6 ml each) were withdrawn every hour replaced by fresh buffer, and their UV absorption was measured at 271.6 nm. In order to minimize the possible errors, a blank sample (containing nanoparticles but no drug) was used to eliminate any absorbance caused by the polymers. Release profiles were plotted based on the hourly released drug percent obtained using the previously generated calibration curve within the release medium.
Based on the plotted release profiles MRT was calculated to make the numeric comparison of the release profiles possible (Equations 3).

where, tmid is the average of the two subsequent sampling times, and ∆M signifies the rate of the dissolution process (16).
Moreover, the release profiles of all formulations were each fitted in the mathematical models of zero order F(t) = kt ± b, first order ln (1-Mt/M∞)=-kt, and Higuchi (Mt/M∞)=kt1/2, as well as the pepas equation. The release and diffusion mechanism was thus interpreted accordingly.
Fourier transform infrared spectroscopy analysis
Fourier transform infrared spectroscopy was obtained using FT/IR-6300 (JASCO, Japan) spectrometer. Samples were dried in an oven for 24 h, mixed with micronized KBr powder and compressed into discs using a manual tablet press.
Differential scanning calorimetry analysis
Differential scanning calorimetry thermo-grams were obtained using DSC-6300 system (JASCO, Japan). Samples were dried in a vacuum desiccator, 2.0 mg of the dried powder crimped in a standard aluminum pan and heated from 20 to 350 °C at a heating rate of 10 °C/min, under constant purging of nitrogen.
Optimization
The optimized formulation was selected by Design Expert 8®, and the correspondent dependent variables including PS, ZP, EE%, LP, and MRT were predicted based on the previous modeling made by the software. This optimized formulation was then prepared within the laboratory, and all the dependent variables were measured practically. Based on the predicted responses and the actual ones, the error percent were calculated.
RESULTS
General specifications of glipizide loaded alginate-chitosan nanoparticles
The preparation of the nanoparticles was based on the ionotropic controlled gelation process, involving the mixing of the aqueous solutions of poly anionic alginate, and poly cationic calcium chloride and chitosan at room temperature. In the presence of the divalent cations such as calcium ions, the stacking of the glucronic acid blocks with the formation of “egg-box” calcium-linked junction leads to the creation of a pre-gel state (17). The subsequent addition of chitosan to the alginate pre-gel then leads to the formation of a polyelectrolyte complex (18).
Based on the 27 different formulations designed by the Design Expert® software, particles with a wide average size range from 173 nm to 4522 nm were obtained (Table 2). Amongst these, particles smaller than 1000 nm are believed to better fit the oral administration (18). Due to the better particle size dispersion, however, a particle size range of 150-650 nm was selected for the optimization purposes. The size and morphology of the optimized formulation evaluated using SEM is shown in Fig. 1.
Fig. 1.
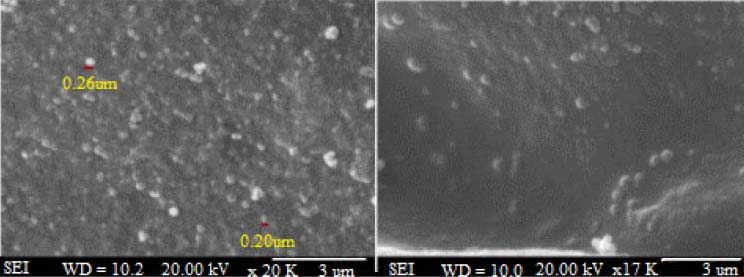
Size and morphology of the optimized formulation.
In regard with the ZP, the overall ZP figure for most of the nanoparticles was negative, due to their being based upon alginate, a negatively charged polymer. For formulations with an alginate/chitosan mass ratio equal to 1:10, however, the ZP shifted toward the positive figures, owing to the relative prominence of the positive charge. In all, the smaller the alginate/chitosan ratio is, the closer to zero the ZP may shift, and the greater the chances of agglomeration will be.
Nevertheless, to determine the effect of each independent variable, absolute values of ZP were considered. This theme will be discussed further in the upcoming sections. ACNP proved to be able to trap glipizide with a very high efficiency. In fact, the EE% value for all of the formulations was greater than 90%, and didn’t undergo significant change from one formulation to another (Table 2). LP, on the other hand, changed significantly based on the amount of polymers used in each formulation, ranging from 16.01% to 45.96% (Table 2).
Regarding the in vitro release studies, depiction of the percent drug released versus time yielded a profile with two nearly different phases (Fig. 2). Within the first phase of the release profile, an immediate release behavior is observed (around 40-50% of the drug is released within the first 4-6 h for all formulations), while the second phase conforms to the controlled release nature of the system.
Fig. 2.
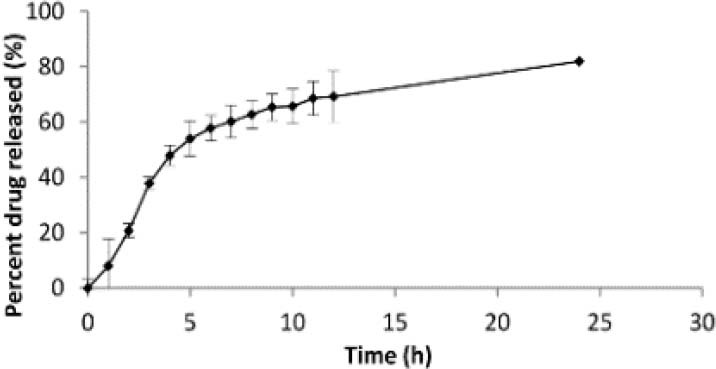
Drug release profile from the optimized formulation.
The prepared nanoparticles were also evaluated in terms of the drug release kinetics as well as the drug diffusion mechanism. The evaluations demonstrated that the drug release profile for the majority of formulations conformed to the Higuchi model, suggesting the drug release to be a diffusion controlled process based on the Fick's law in which the diffusion coefficient depends upon both the concentration and the time (19). In case of the diffusion mechanism, results suggested that the majority of the formulations conformed to the Fickian diffusion mechanism, while few fit into the non-Fickian diffusion, case II, and super case II mechanisms.
To fulfill the statistical characterization and optimization of the release properties, MRT was also calculated as a numerical value on the basis of the in vitro release profiles using Equation 3. This subject will be further discussed in the upcoming sections.
Statistical characterization and optimization of the particles
The results of the preliminary investigations made by means of an 8-formulation-based Taguchi design created by Minitab 5® (trial version) suggested that amongst the 5 different studied independent variables (i.e. alginate, chitosan, calcium chloride, and glipizide concentration as well as the stirring speed), only glipizide concentration doesn’t have a significant impact on the responses (PS, ZP, EE%, LP, and MRT).
Glipizide concentration was consequently omitted from further designs, and only the other 4 independent variables (i.e. alginate, chitosan, and calcium chloride concentrations along with the stirring speed) were subjected to further investigations using the Box-Behnken design. The best fit models generated by the software (Design Expert 8®, trial version) for the observed responses shown in Table 2 included a two factor-interaction (2FI) model for PS (Y1), a quadratic model for ZP (Y2), a 2FI model for LP (Y3), and a 2FI model for MRT (Y4). These models are each presented below as an equation, based on which the characterization and optimization processes were performed.
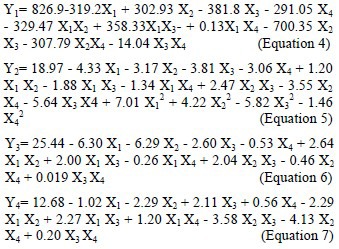
where, X1, X2, X3, and X4 are sodium alginate concentration, chitosan concentration, calcium chloride concentration, and stirring speed, respectively. The coefficient of each variable shows its degree of contributive effect on the responses, while the plus or minus sign signifies its boosting or castrating impact. A summary of the statistical analyses for the responses is shown in Table 3.
Table 3.
Summery of the statistical analysis of the response.

Apart from the equations provided by the software for the summarization of the statistical models, Design Expert 8® software also provided us with 3D graphs demonstrating the interactive effect of each two independent factors on each response, thus facilitating the visual interpretation of the results.
Fig. 3 includes 3D graphs depicting the interactive effect of alginate and chitosan concentrations, which proved to exert the most crucial impact upon two of the four responses, i.e. PS (Fig. 3a), and ZP (Fig. 3b), as well as the interactive effect of chitosan concentration and stirring speed upon MRT values (Fig. 3c). The graphs will be discussed in more detail in due course.
Fig. 3.
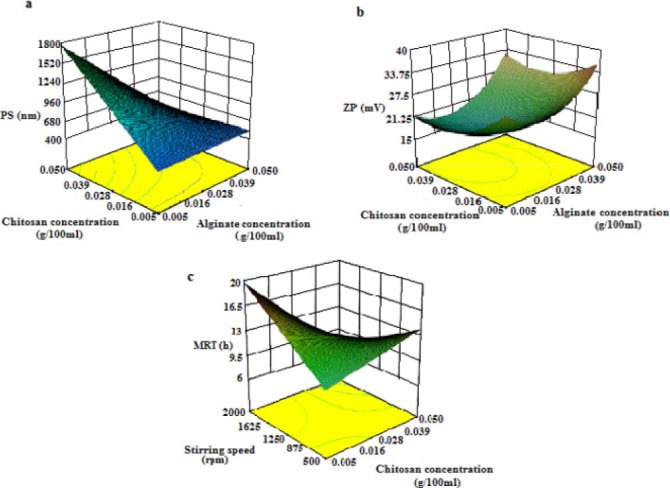
Interactive effect of a; the sodium alginate and chitosan concentrations on the particle size, b:and zeta potential absolute values, c; interactive effect of chitosan concentration and stirring speed on the mean release time.
Optimization
Based on the modeling made by Design Expert 8® and a desirability factor equal to 95%, the following factors were suggested by the software for the preparation of the optimal formulation: 0.02 % sodium alginate, 0.01% chitosan, 0.93 mM calcium chloride, and a stirring rate of 1643 rpm. The optimized formulation was then prepared, and all the necessary evaluations concerning the PS, ZP, LP, and MRT were subsequently made. The acceptable agreement between the observed values and the values predicted by the software, and the negligible error percent confirm the validation of all the models as well as their adequate precision for the prediction of optimized conditions in the domain of levels chosen for the independent variables (Table 4).
Table 4.
Predicted Vs. actual responses obtained for the optimized formulation.

Fourier transform infrared spectroscopy analysis and differential scanning calorimetry evaluation
The FTIR spectra and DSC thermograms of the drug loaded and blank particles as well as those of the raw material are depicted in Figs. 4 and 5, respectively. Both evaluations confirm the formation of the particles as well as the integrity of the loaded glipizide.
Fig. 4.
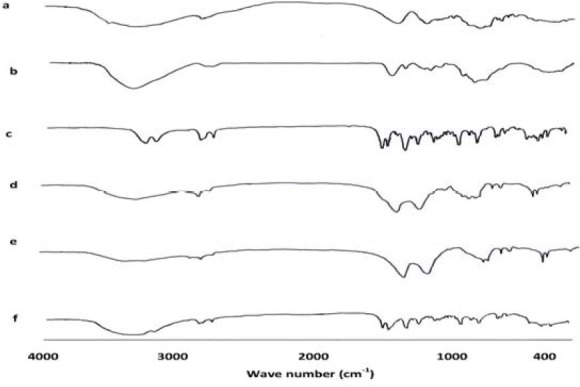
FTIR spectra for a; sodium alginate, b; chitosan, c; glipizide, d; nanoparticles loaded with glipizide, and e; blank nanoparticles (with no glipizide), and f) physical mixture of alginate, calcium chloride, chitosan, and glipizide.
Fig. 5.
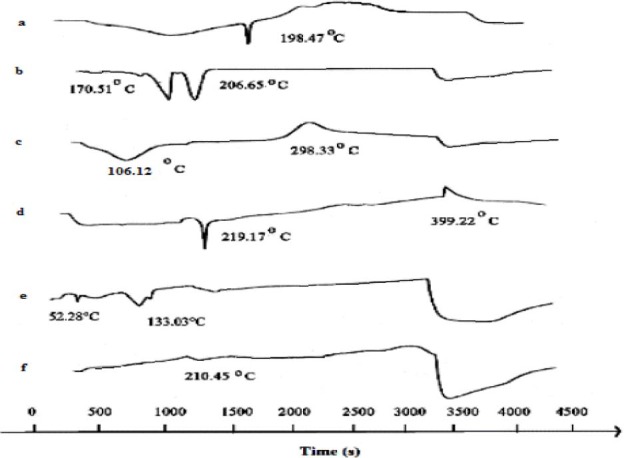
DSC thermograms for a; sodium alginate, b; calcium chloride, c; chitosan, d; glipizide, e; physical mixture of alginate, chitosan, calcium chloride, and glipizide, and f; nanoparticles loaded with glipizide.
DISCUSSION
Box-Behnken designs are a class of rotatable or nearly rotatable second-order designs based on three-level incomplete experimental designs. A comparison between the Box-Behnken design and other response surface designs (central composite, Doehlert Matrix, and three level factorial design) have demonstrated its slight efficiency over central composite and Doehlert designs and its remarkable efficiency over the three level full factorial design. One of the most important advantages of the Box-Behnken design is that it does not contain combinations for which all factors are simultaneously at their highest or lowest levels. So these designs are useful in avoiding experiments performed under extreme conditions, for which unsatisfactory results might occur. Conversely, they are not indicated for situations in which we would like to know the responses at the extremes, that is, at the vertices of the cube (20). Within the current section, we will go into more detail about the interpretation of the modeling provided by Design Expert 8®, following the analyses of the variables and responses investigated with the help of the Box-Behnken design.
Particle size
Particle size is one of the most important characteristics of the prepared nanoparticles, affecting both the release pattern of the drug, and its absorption from the GI tract. Thus, it is one of the most important particle characteristics to be controlled, and to be evaluated.
A simple review of Equation 5 generated by Design Expert 8® and the related P values (Table 3) demonstrates that chitosan concentration can affect the PS most significantly, while alginate concentration is the second significantly effective factor. CaCl2 concentration and the stirring speed, along with the interaction of alginate and chitosan, chitosan and CaCl2, and chitosan and the stirring speed are other factors with a significant impact on the PS.
The present study found that a special correlation exists between the chitosan concentration and the PS, i.e. the higher the chitosan concentration is, the bigger the PS will be (Fig 3a). This finding is, of course, in accordance with that reported by several other studies. For instance, Patel and coworkers observed that an increase in chitosan concentration led to the formation of flakes (10). Another group of scientists, Sarmento and colleagues, also found out that PS tends to increase following the increment of chitosan/alginate mass ratio, while the reduction of the ratio led to the production of particles of smaller sizes (15).
Several studies have investigated the effect of alginate/chitosan mass ratio upon the nanoparticles’ characteristics. A recent study conducted by Gazori and coworkers reported that the best sizes are obtained using a 1:1 alginate/chitosan mass ratio (15). This is confirmed by the results of our study, which passively investigated the effect of 3 different alginate/chitosan mass ratios on the particle characteristics. A 1:1 alginate/chitosan mass ratio proved to produce the smallest PSs, while a 10:1 ratio led to the production of particles of bigger but no less acceptable sizes. The 1:10 ratio, on the contrary, accounted for the production of cloudy systems with particles of big sizes (Fig. 3a).
Another factor with significant impact on the PS was CaCl2 concentration. The coefficient for CaCl2 in the final equation suggested that the higher the calcium ion concentration is, the bigger the PS will be. This was confirmed by some other studies, including that of Sonavane and colleagues who reported that the increment of calcium ions within the medium increased the tendency of micro-gel formation (due to greater PS), while lower calcium concentration tended to form clear solutions (17). This study also reported that when sodium alginate concentration remained constant, higher concentrations of CaCl2 resulted in larger PSs.
The last effective factor is, of course, the stirring speed. It is generally believed that faster stirring of the medium corresponds with smaller PSs (18), a fact which is confirmed by the present study.
In respect with chitosan-calcium chloride interaction, though the whole effect is boosting, the smallest PS is seen when low chitosan concentration is combined with high CaCl2 concentration (Table 3). To sum it up, what the designed 2FI model suggests is that the effect of each factor on the PS is not linear, and a combination of interactions is responsible for the final effect. Using such a model, optimization and prediction will be possible.
Zeta potential
The stability of many colloidal systems is directly related to the magnitude of their ZP. In general, if the absolute value of the particle ZP is large, the colloidal system will be stable. Conversely, should the ZP be relatively small, the colloidal system will agglomerate. The surface charge of the particles is of substantial importance in all the production steps of these particles, for the efficiency of the different steps is directly related to the establishment of electrostatic interactions (21).
The overall ZP of most of the nanoparticles was negative, due to the fact that these particles are based on alginate, a negatively charged polymer. For formulations with an alginate/chitosan mass ratio equal to 1:10, however, the ZP shifted toward the positive figures, owing to the relative prominence of the positive charge. In all, the smaller the alginate/chitosan ratio is, the closer to zero the ZP may shift, and the greater the chances of agglomeration will be (Fig 3b).
Further analysis and statistical modeling (Table 3) revealed that, as predicted, alginate is the most important factor significantly affecting the ZP, while chitosan concentration may influence it as well. Greater ZP values are observed while high extreme concentrations of alginate, i.e. 0.05%, are used. When low concentrations of sodium alginate are combined with high chitosan concentrations, the overall ZP is shifted toward zero. Therefore, an increase in alginate concentration significantly augments the ZP value.
Entrapment efficiency
The EE% acts as an important factor influencing the drug release, as well as the overall efficacy of the production process. With respect to glipizide nanoparticles, the EE% is typically high, and in almost all cases above 90%. This can be especially observed within the selected ranges for each factor. A simple review of the attained EE% for different formulations (Table 2) reveals that as the level of each factor changes on the basis of the design, EE% doesn’t undergo as much change as other particle and release characteristics. It might be for this reason that the resulted EE% couldn’t be fitted in any of the acceptable models. The characterization process had therefore to be carried out on the basis of the Taguchi design.
Based on the information gained from the Taguchi design and the related ANOVA analysis, chitosan concentration as well as the stirring speed can significantly affect the EE% (data not shown). This effect, however, doesn’t increase or decrease the EE% more than several percent. The analysis shows that the increase of each of the two mentioned factors may lead to greater EE% values. The EE% is thus quite constant and of course high enough for all the formulations within the selected range.
To sum it up, within the selected ranges of alginate, chitosan, and CaCl2 concentrations as well as the stirring speed, glipizide is excellently loaded within the particles, and the EE% is not remarkably touched by the change of each variable.
Loading percent
Loading percent is calculated on the basis of Equation 2. As evident within the equation, an increase in the concentration of each substance may lead to the decrease of the final fraction, i.e. the LP. Since the amount of drug loaded within the particles undergoes little change (discussed under the previous section), we were thus by no means surprised to discover that an increase in the concentration of each of the two polymers as well as the CaCl2, led to the decrease of the overall fraction and the resulted LP. Stirring speed, on the contrary, proved to be of little importance (Table 3). Therefore, the interaction of each two pairs of factors, except for those having stirring speed as a part, was proved to have a significant impact upon the resulted LP.
Mean release time
Mean release time serves as a numeric criterion for the assessment of the drug release rate. The greater the MRT value is, the slower the drug release rate will be. Based on the statistical modeling made by Design Expert 8® and the resulted analysis (Table 3), it can be concluded that the only factor affecting the MRT significantly is the chitosan-stirring speed interaction (P≤0.05), although chitosan concentration as well as chitosan-CaCl2 interaction may also contribute to the eventual result (0.1≥P≥0.05). Furthermore, it was observed that low concentrations of chitosan correspond to smaller MRT values (Fig 3c). Note that the effect of each factor on MRT changes when interacted with the other. The modeling is, therefore, especially helpful within the optimization process, where formulations with acceptable MRTs can be easily selected.
Optimization
Based on the optimization process performed by Design Expert 8®, the optimal formulation was selected, and the related dependent variables were predicted (Table 4). The formulation was then prepared within the laboratory and the real dependent variables were evaluated. Since statistically insignificant differences were observed between the obtained values and the predicted ones, the model was considered to be valid.
Drug release profile
Depiction of the percent drug released versus time yielded a profile with two nearly different phases. Within the first phase of the release profile, an immediate release characteristic was observed, while the second phase confirmed the system's controlled release characteristics. This is considered to be an advantage of utmost importance for diabetic patients, since an immediate increase in drug concentration within the blood stream is vital to keep the glucose levels under control. Meanwhile, the system continues to release the drug within the gastrointestinal tract, which keeps the drug concentration within the blood high enough till the time of the next dose. This kind of release profile is, therefore, beneficial for diabetic patients.
The prepared nanoparticles were also evaluated in terms of the drug release kinetics as well as the drug diffusion mechanism. The evaluations demonstrated that the drug release profile for the majority of formulations conforms to the Higuchi model, while some of them follow the first order mechanism.
The Higuchi model indicates the encapsulation of the drug with a non-water-soluble matrix, and the subsequent limited ability of many of the particles to enter the release medium. In all, Higuchi model signifies the drug release mechanism from the matrix systems (21). The first order kinetics, on the other hand, indicates the almost homogenous distribution of drug concentration within the carrier during the release process (19).
As for the diffusion mechanism, analyses showed that the majority of formulations conform to the fickian diffusion mechanism, while some might fit into non-fickian diffusion, case II, and super case II mechanisms. In all swelling systems, liquid diffusion rate as well as chain relaxation rate affects the release kinetics of the drug. When the liquid diffusion rate is slower than the chain relaxation speed, a fickian (case I) diffusion mechanism is observed.
Drug diffusion from most of the polymeric systems is usually justified through the fickian mechanism, in which the diffusion phenomenon plays the most significant role in drug release. Should the chain relaxation occur faster than the liquid diffusion, case II mechanism is observed (22). In case that the chain relaxation and liquid diffusion occur with the same rate, a non-fickian mechanism happens. It can be concluded on the basis of the attained results that, like other polymeric systems, fickian diffusion is the dominant drug diffusion mechanism for the majority of the prepared formulations.
Fourier transform infrared spectroscopy analysis
In order to examine the interaction between the components of nanoparticulate systems, preliminary concerns were taken over polyelectrolytes interactions. It is well established that the carboxyl group of the anionic polymer may interact with the amino group of Chitosan, and form an ionic complex (15). As a result, there are changes in the absorption bands of amino groups, carboxylic groups, and amide bonds in FTIR spectra. Consequently, after complexation with chitosan, alginate carboxyl peaks near 1631 cm-1, and 1425 cm-1 were broadened and shifted slightly from 1650 cm-1 to 1610 cm-1 and 1411 cm-1, respectively.
The FTIR spectrum of chitosan also showed a peak of amide bond at 1650 cm-1 and a strong protonated amino peak at 1596 cm-1, for it is obtained from partial N-deacetylation of chitin. However, both peaks were shifted after complexation with alginate, the amide peak into singlet bond at 1610 cm-1 and the amino peak to 1534 cm-1 (Fig. 4). Observed changes in the absorption bands of the amino groups, carboxyl groups, and amide bonds could be attributed to an ionic interaction between the carbonyl group of alginate and the amide group of chitosan (15).
Differential scanning calorimetry evaluation
Differential scanning calorimetry thermo-gram of sodium alginate showed an initial endothermic peak at 126.72 °C and a higher endothermic peak at 198.47 °C (Fig. 5a). Chitosan revealed an endothermic peak at 106.12 °C, and an exothermic one at 298.33 °C (Fig. 5c).
Endothermic peaks were correlated with loss of water associated to hydrophilic groups of polymers while exothermic peaks result from degradation of polyelectrolytes due to dehydration and depolymerization reactions most probably to the partial decarboxylation of the protonated carboxylic groups and oxidation reactions of the polyelectrolytes. CaCl2 showed two endothermic peaks at 170.51 °C and 206.65 °C, respectively (Fig. 5b). It was also observed that a sharp endothermic peak at 219.17 °c existed for glipizide (corresponding to its melting point) as well as for the prepared nanoparticles (210.45 °C) (Figs. 5d and 5e).
Since the peaks are quite identical, although a small shift is seen probably due to the change in crystalline form, it can be proved that there is no chemical interaction between the drug and the polymers employed in the preparation of alginate-chitosan nanoparticles (16,17). Thermogram of the alginate-chitosan complexes was shifted from those of physical mixture. Peaks of physical mixture appeared to be combinations of each material (Fig. 5e), but different from those of the prepared nanoparticles probably because the complexation of the polyelectrolytes resulted in a new chemical bound.
CONCLUSION
In the present research, we prepared a new bioadhesive particulate system for the controlled delivery of glipizide. The delivery system is multiple unit, particulate, bioadhesive, controlled release, nontoxic, biocompatible, and biodegradable. It protects glipizide, lowers gastrointestinal side effects, reduces dosing frequency, and thus increases the patient compliance.
The preparation method is also easy, rapid, reliable, economical, and is carried out under mild conditions in an aqueous environment and at ambient temperature. The in vitro release is characterized by an initial burst release followed by a continuous controlled release phase.
For patients suffering from diabetes, this initial burst effect is necessary to effectively reduce the glucose concentration immediately after the ingestion of a meal, while the continuous controlled release phase ensures that the glucose level remains low until the time for the subsequent dose. Therefore, the release profile automatically suits the patient chronopharmacological requirements. On the basis of the obtained results, it is expected that this novel formulation be a superior therapeutic alternative to the currently available glipizide delivery systems.
ACKNOWLEDGMENTS
The authors wish to thank Ms. Elaheh Moazen for help and support in the fulfillment of the current project. We are also thankful to Farabi pharmaceutical company for the contribution in the fulfillment of the DSC analyses. This work was financially supported by the Research Council of Isfahan University of Medical Sciences, Isfahan, Iran.
REFERENCES
- 1.Chowdary KPR, Srinivasa YR. Design and in vitro evaluation of mucoadhesive controlled release oral tablet of glipizide. Indian J Pharm. 2003;65:592–599. [Google Scholar]
- 2.Thombre AG, Denoto AR, Gibbes DC. Delivery of glipizide from asymmetric membrane capsules using encapsulated excepients. J control release. 1999;60:333–341. doi: 10.1016/s0168-3659(99)00086-3. [DOI] [PubMed] [Google Scholar]
- 3.Rendell M. The role of sulphonylureas in the management of type 2 diabetes mellitus. Drugs. 2004;64:1339–1358. doi: 10.2165/00003495-200464120-00006. [DOI] [PubMed] [Google Scholar]
- 4.Verma RK, Garg S. Development and evaluation of osmotically controlled oral delivery system of glipizide. Eur J Pharm Biopharm. 2004;57:513–525. doi: 10.1016/j.ejpb.2004.02.003. [DOI] [PubMed] [Google Scholar]
- 5.Baily CJ. Potential new treatments for type two diabetes. Tips. 2000;21:259–265. doi: 10.1016/s0165-6147(00)01506-6. [DOI] [PubMed] [Google Scholar]
- 6.Harlay CR. Glipizide GRTS has advantages over other second generation sulfonylurea. Clin Drug Invest. 2002;22:575–584. [Google Scholar]
- 7.Hesieh SH, Lin JD, Chang HY, Ho Ch, Liou MJ. Sustained release versus immediate release glipizide for the treatment of diabetes mellitus in Chinese patients: a randomized, double blind, double dummy, parallel group, 12 week clinical study. ClinTher. 2006;28:1318–1326. doi: 10.1016/j.clinthera.2006.09.010. [DOI] [PubMed] [Google Scholar]
- 8.Muthu MS. Nanoparticles based on PLGA and its copolymer: an overview. Asian J Pharm. 2009;3:266–273. [Google Scholar]
- 9.Tiyaboonchai W. Chitosan nanoparticles: a promising system for drug delivery. Naresuan University Journal. 2003;11:51–66. [Google Scholar]
- 10.Patel JK, Patel RP, Amin AF, Patel MM. Formulation and evaluation of mucoadhesive glipizide microspheres . AAPS Pharm Sci Tech. 2005;6:49–55. doi: 10.1208/pt060110. [DOI] [PMC free article] [PubMed] [Google Scholar]
- 11.Smidsrod O, Skjakbraek G. Alginate as immobilization matrix for cells. Trends Biotechnol. 1990;8:71–78. doi: 10.1016/0167-7799(90)90139-o. [DOI] [PubMed] [Google Scholar]
- 12.Balasubramaniam J, Pandit JK. Ion-activated in situ gelling systems for sustained release ophthalmic delivery of ciprofloxacin hydrochloride. Drug Deliv. 2003;10:185–191. doi: 10.1080/713840402. [DOI] [PubMed] [Google Scholar]
- 13.Kubo W, Myazaki S, Attwood D. Oral sustained delivery of paracetamol from in situ-gelling gellan and sodium alginate formulations. Int J Pharm. 2003;258:55–64. doi: 10.1016/s0378-5173(03)00163-7. [DOI] [PubMed] [Google Scholar]
- 14.Dokka S, Rojanasakul Y. Novel non-endocytic delivery of antisense oligosaccharides. Adv Drug Deliv. 2000;44:35–42. doi: 10.1016/s0169-409x(00)00082-x. [DOI] [PubMed] [Google Scholar]
- 15.Gazori T, Khoshayand MR, Azizi E, Yazdizadeh P, Nomani A, Haririan I. Evaluation of alginate/chitosan nanoparticles as antisense delivery vector: Formulation, optimization and in vitro characterization. CarbohydPolym. 2009;77:599–606. [Google Scholar]
- 16.Gupta NV, Satish CS, Shivakumar HG. Preparation and characterization of gelatin-poly (methacrylic acid) interpenetrating polymeric network hydrogels as a ph-sensitive delivery system for glipizide. Indian J Pharm Sci. 2007;69:64–68. [Google Scholar]
- 17.Sonavane GS, Devarajan PV. Preparation of alginate nanoparticles using Eudragit E100 as a new complexing agent: development, in-vitro, and in-vivo evaluation. J Biomedical nanotechniligy. 2007;3:160–169. [Google Scholar]
- 18.Zengshuan MA, Yeoh HH, Lim LY. Formulation pH modulates of insulin with chitosan nanoparticles. J Pharm Sci. 2002;91:1396–1404. doi: 10.1002/jps.10149. [DOI] [PubMed] [Google Scholar]
- 19.Crowley MM, Schroeder B, Fredersdrof A, Obara S, Talarico M, Kucera S, et al. Physicochemical properties and mechanism of drug release from ethylcellulose matrix tablets prepared by direct compression and hot-melt extrusion. Int J Pharm. 2004;269:509–522. doi: 10.1016/j.ijpharm.2003.09.037. [DOI] [PubMed] [Google Scholar]
- 20.Ferreira SLC, Bruns RE, Ferreira HS, Matos GD, David JM, Brandao GC, et al. Box-Behnken design: an alternative for the optimization of the analytical methods. Analytica Chemica Acta, 2007;597:179–186. doi: 10.1016/j.aca.2007.07.011. [DOI] [PubMed] [Google Scholar]
- 21.Ehtezazi T, Washington C, Melia CD. First order release rate from porous PLA microspheres with limited exit on the exterior surface. J Control Release. 2000;66:27–38. doi: 10.1016/s0168-3659(99)00255-2. [DOI] [PubMed] [Google Scholar]
- 22.Siemann J, Peppas NA. Modeling of drug release from delivery systems based on Hydroxypropyl. doi: 10.1016/s0169-409x(01)00112-0. [DOI] [PubMed] [Google Scholar]


