Abstract
Glibenclamide (GLIB) is a poorly soluble drug with formulation-dependent bioavailability. Therefore, we attempted in this study to improve GLIB dissolution rate by preparing drug solid dispersions by solvent evaporation (SE) and supercritical fluid solvent-antisolvent techniques (SCF-SAS). A D-optimal mixture design was used to investigate the effects of different ratios of HPMCE5 (50-100%), PEG6000 (0-40%), and Poloxamer407 (0-20%) on drug dissolution from different solid dispersion (SD) formulations prepared by SE. The ratios of carriers used in SCF-SAS method were HPMCE5 (fixed at 60%), PEG6000 (20-40%), and Poloxamer407 (0-20%). A constant drug: carrier weight ratio of 1:10 was used in all experiments. The SDs obtained were physically characterized and subjected to the dissolution study. The major GLIB bands in FTIR spectra were indicative of drug integrity. The reduced intensity and the fewer number of peaks observed in X-ray diffractograms (XRD) of GLIB formulations was the indicative of at least partial transformation of crystalline to amorphous GLIB. This change and/or dilution of drug in much higher amounts of carriers present caused disappearance of distinctive endothermic peaks in differential scanning calorimetry thermograms of GLIB formulations. The model generated according to the results of the D-optimal mixture design indicated that GLIB formulations comprising HPMC (50%-60%), PEG (34-40%), and poloxamer (6-10%) had enhanced dissolution performances. As compared to SE method, the SCF-SAS technique produced formulations of higher dissolution performances, likely due to the effects of solution and the supercritical CO2 (SC-CO2) on enhanced plasticization of polymers and thus increased diffusion of the drug into the polymer matrix.
Keywords: Glibenclamide, Dissolution enhancement, Solvent evaporation, Solid dispersion, Supercritical fluid
INTRODUCTION
Poor solubility of drugs in biological media presents a major challenge for pharmaceutical industries and researchers developing new pharmaceutical products. A great number of chemical entities currently being discovered are considered poorly water-soluble drugs (1). Oral dosage forms of these drugs may have problems of inadequate and variable bioavailability. This arises from the fact that dissolution of such drugs in the gastrointestinal milieu may be the rate limiting step in their absorption and bioavailability (2). Based upon their permeability characteristics, poorly water-soluble drugs may be categorized in class II (highly permeable) or IV (poorly permeable) of biopharmaceutical classification system (BCS). Increased bioavailability of drugs belonging to the BCS class II can, therefore, be attained by improving drug dissolution.
Enhancement of drug dissolution may be achieved by adopting various strategies, many of which are based on producing a fine dispersion of drug in different carriers (1,2,3). Solvent evaporation (SE) from the mixture of drug and the carriers is commonly used to obtain drug solid dispersions (SDs). Absence of drug particle aggregates, partial or complete transformation of drug to amorphous form, improved wettability and eventually increased drug solubility and dissolution rate are the main characteristics of drugs finely dispersed in carriers (1).
Another approach more recently employed to prepare the SD of drugs is based on the unique properties of supercritical fluids (SCF). Existing as a single phase while possessing typical properties of liquids (e.g. density) and some of gases (e.g. viscosity, compressibility, and mass diffusion coefficient), SCF exhibits a superb solvency power (4). Carbon dioxide (CO2) is the most widely used SCF because of its easily accessible critical temperature and pressure, non-flammability, non-toxicity, and low cost (4,5,6).
The use of SCF-based processes produces particles of a narrow size range and low residual solvent content, and provides higher drug stability. Incorporation of drugs in a carrier system may be achieved by various SCF-based processes, in which the SCF may act as a solvent, an antisolvent or simply an aid in the operation (7,8,9).
In one approach, also employed in this study, the solution of drug and carriers in a common solvent and the SCF are simultaneously introduced into the particle formation vessel. The solvent is quickly extracted by the SCF and as a result the SD particles are formed and precipitated on the walls and bottom of the vessel (10,11).
A variety of excipients including disintegrants, surfactants and solubility enhancing agents may be used in preparing SDs. Search for such ingredients and also for novel preparation techniques is a demanding area of work for scientists and the industry.
Glibenclamide (GLIB), a second generation sulfonyl-urea, is orally indicated in the treatment of type-II diabetes mellitus in patients whose hyperglycemia cannot be adequately controlled with diet and exercise. GLIB also may be added gradually to the dosing regimen of patients who have not responded to the maximum dose of metformin monotherapy after four weeks. GLIB has, however, poor solubility in gastrointestinal fluid, leading to varying dissolution rate and incomplete or formulation-dependent bio-availability when orally administered (12,13,14).
Although many workers have cited the use of SCF-based technologies for the dissolution improvement of poorly-soluble drugs, no report was found on using SCF for preparation of GLIB SDs.
Therefore, this study was designed to compare the potentials and efficiencies of the SCF-based processing and the conventional SE technique in dissolution enhancement of GLIB prepared as SD formulations. In this study, we limited the selection of types and amounts of polymers and other ingredients to those commonly used/accepted in manufacturing of the solid dosage forms for oral means. Thus, following preliminary screening evaluations, the low viscosity grade HPMCE5 already shown to produce rapid drug release (15,16), PEG6000 and Poloxamer407 solubility enhancement excepients, with processibility in preparing solid dosage forms (17,18,19) were used to prepare SD formulations.
MATERIALS AND METHODS
Materials
Poloxamer407 was purchased from BASF (Germany). HPMCE5 was obtained from Sigma-Aldrich (USA). GLIB was kindly gifted by Kimi-Daru (Iran). PEG6000 and other chemicals were obtained from Merck (Germany).
Design of experiments
Preliminary studies were performed to investigate suitability of different carriers and the possible weight range of each carrier in preparing SD formulations of GLIB. D-optimal mixture designs were then proposed to more easily optimize the formulations and evaluate the impact of various ratios of each carrier on GLIB dissolution enhancement. The peculiar characteristic of a mixture design is that the fractions of each formulation variable depend on the fractions of the other variables since the sum of all fractions of the components must add up to 100%. Thus, mixture components are expressed as the fraction of the total amount, ranging experimentally from 0 to 100%. However, a component may be varied only over a more restricted range than the normal 0–100%, thereby reducing the area of interest to an irregular polyhedron (20,21).
This approach may be used where the effects of changes in the fractions of various mixture components on the responses, and subsequently obtaining the optimal composition for achieving desired responses need to be investigated using the least number of experiments (21).
Design-Expert® software package version 7.1.5 (by Stat-Ease Inc., Minneapolis, MN, USA) was used to generate the experimental design and analyze responses (the dissolution data). The carrier system, i.e. three formulation variables (X1, X2 and X3), included HPMCE5 (H), PEG6000 (P), and Poloxamer407 (X), where H+P+X=100% (10 mg). A fixed 1:10 weight ratio of GLIB to the carrier system was used in all experiments. The fractions of carriers used were HPMCE5 (50-100%), PEG6000 (0-40%), and Poloxamer407 (0-20%) where the SE method was used. According to the model, 21 formulations including 10 estimate formulations, 5 estimate lack of fit formulations, 5 replicate formulations and one additional center point formulation were randomly arranged by the software. Table 1 indicates the description of different formulations prepared and the responses observed.
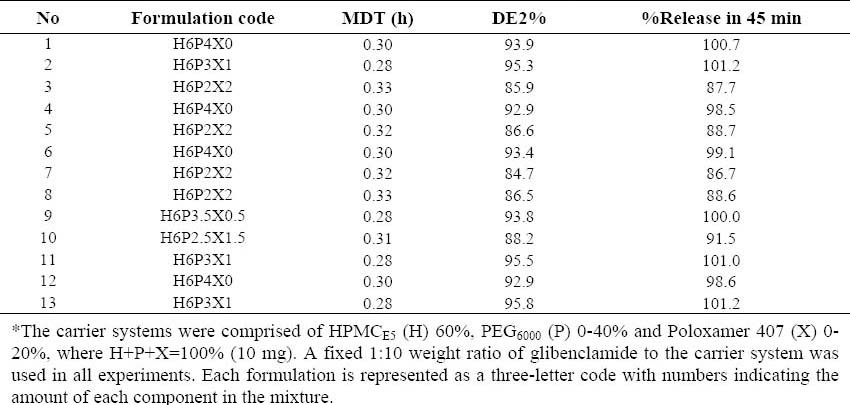
Table 1.
Glibeclamide-solid dispersion formulations* prepared by the solvent evaporation method based on the D-optimal mixture design and major responses calculated.
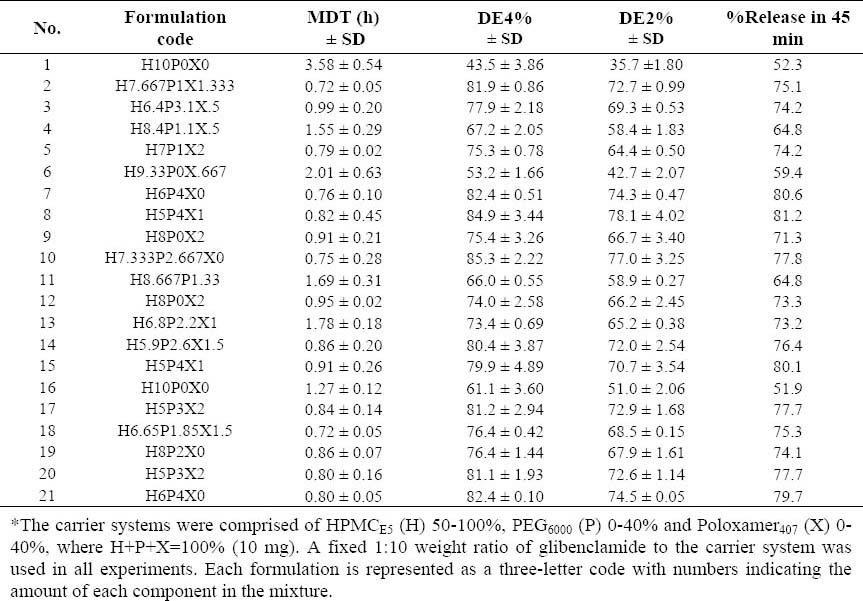
For formulations prepared by the supercritical fluid solvent-antisolvent techniques (SCF-SAS) technique, the ratio of HPMCE5 used was fixed at 60%, but the ratios of PEG6000 and Poloxamer407 varied between 20-40% and 0-20%, respectively. The software proposed 13 formulations including 3 estimate formulations, 5 estimate lack of fit formulations and 5 replicate formulations. The description of formulations prepared and the responses observed are summarized in Table 2.
Table 2.
Glibenclamide-solid dispersion formulations* prepared by the supercritical fluid solventantisolvent techniques method based on the two-component mixture design and major responses calculated.
Preparation of solid dispersion by solvent evaporation
The required amounts of GLIB and carriers were dissolved in methylene chloride-ethanol mixture (1:1). The solvent was removed at 70 °C under reduced pressure for 20 min using a rotary evaporator.
The solid mass obtained was dried in an oven at 40 °C for 48 h, then pulverized, passed through 44-mesh sieve and stored in a desiccator until further use.
Preparation of solid dispersion by a supercritical fluid solvent-antisolvent technique
Glibenclamide and the carriers were dissolved in 100 ml methylene chloride: ethanol mixture (1:1), then bath-sonicated for 15 min to remove air.
The pressure of CO2 varied from 1500 to 3000 PSI in order to attain the supercritical condition. The solution and the supercritical CO2 (SC-CO2), as the antisolvent, were introduced into a home-made SCF-SAS equipment at the rates of 0.2 ml/min and 2 ml/min, respectively. Under controlled pressure and temperature conditions SC-CO2 extracted the solvent from the solution, through which particles formed in the vessel. The particles so produced were collected in the vessel, while SC-CO2 and the extracted solvent emerged through a back pressure regulator. The particles were dried in a vacuum oven at 30 °C for 48 h (Metro, Switzerland) before further analysis in order to remove organic solvents residuals.
Fourier transform infrared spectroscopy
The samples were mixed with KBr and were pressed to disk. Spectra of the samples were recorded on a Rayleigh WQF-S10a FTIR spectrometer (Germany) between 4000 and 600 cm−1, at an optical resolution of 4 cm−1 with a minimum of 256 scans per spectrum to achieve a proper signal-to-noise ratio. All measurements were performed at room temperature.
Differential scanning calorimetry
Differential scanning calorimetry (DSC) studies were performed using a Linseis Thermobalance-L81 (USA), with samples of approximately 5-10 mg weighed into non-hermetically sealed aluminium pans. The system was calibrated with indium. The samples were heated from ambient temperature to 250 °C at a rate of 5 °C/min.
X-ray diffraction
An X-ray diffraction (XRD) apparatus (Bruker D8-Advance, Germany), using Cu Kα radiation filtered by Ni (36 kg; 26 nD), was used to analyze the samples in the range of 2θ=5–80 with a scanning rate 2θ =10° min−1.
Drug dissolution studies
The dissolution studies were conducted in a type II dissolution test apparatus (Erweka, DT-700, Germany) at conditions specified in the USP monograph for GLIB 5 mg tablets (22). Of each formulation prepared, an amount equivalent to 5 mg GLIB, was placed in a dissolution vessel containing 500 ml phosphate buffer (pH 9.5) maintained at 37 ± 0.2 °C and stirred at 75 rpm. At appropriate time intervals 5 ml samples were withdrawn and replaced with an equal volume of fresh dissolution medium. The sample was centrifuged for 3 min and the absorbance of supernatant was measured at 227.3 nm using a spectrophotometer (Shimadzu, model UVmini 1240). The concentration of GLIB in the sample was determined from the standard curve (r2 > 0.999), which was constructed using drug standard solutions having a concentration range of 0.5–18 μg/ml. The percent cumulative drug dissolved was calculated and plotted versus time.
Analysis of dissolution data
The percent drug released in 45 min (release%45 min), as implemented in the USP 28th, dissolution efficiency (DE) and mean dissolution time (MDT) were used to compare the drug release rates of different formulations.
The DE was calculated from the area under the dissolution curve up to a certain time (tj) and expressed as a percentage of the area of the rectangle described by 100% dissolution in the same time (23). Thus, DE2% and DE4% calculated for formulations represent the percent of GLIB DE of up to 2 h and 4 h, respectively.

where, y is the drug percent dissolved at time t. MDT was calculated using the following equation (23):

where, n is the number of dissolution sample times, j is the sample number,  is the time at midpoint between tj and tj−1 and ΔMi is the additional amount of drug dissolved between ti and ti−1.
RESULTS
The formulations prepared were evaluated for physical characterization viz. FTIR, DSC, and XRD. Pure GLIB and carrier blends were also run as control. The FTIR spectrum of GLIB powder (Fig. 1) showed characteristic amide peaks at 3367, 3315, 1716 cm-1, urea N-H stretching vibrations at 1277, 1618 and 1525 cm-1 and SO2 stretching vibration at 1342 and 1159 cm-1. Figs (1e and 1f) illustrate the IR spectra of typical GLIB formulations prepared by SE and SCF-based processing, respectively. The characteristic bands of the drug at 3315, 1716, 1618, 1342, and about 111-1155 cm-1 were also apparent in the spectra with decreased intensity.
Fig. 1.
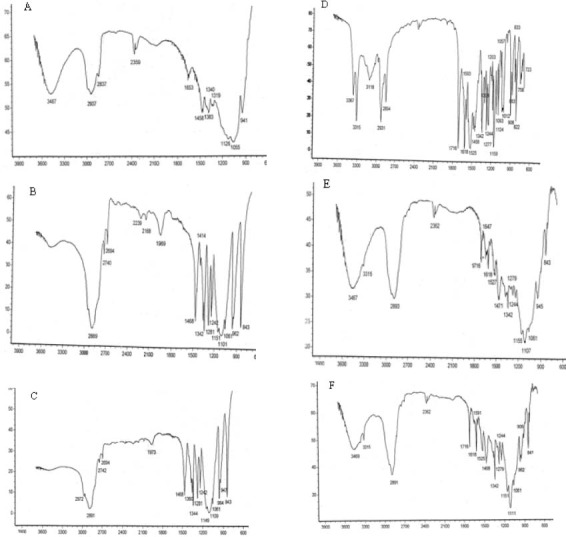
FTIR spectra of (A) HPMCE5, (B) PEG6000, (C) poloxamer407, (D) glibenclamide powder, (E) glibenclamide solid dispersion (H6P4X0), prepared by SE method, and (F) glibenclamide solid dispersion (H6P3.5X0.5), prepared by supercritical fluid solvent-antisolvent techniques method.
The DSC thermogram of GLIB indicates the onset of endothermic peak at around 165 °C, corresponding to the melting of drug (Fig. 2a), however, no distinctive endothermic peak appeared in the thermograms of GLIB-SCF and GLIB-SE formulations and the GLIB carriers physical mixture (Figs 2b, 2d, and 2c, respectively)
Fig. 2.
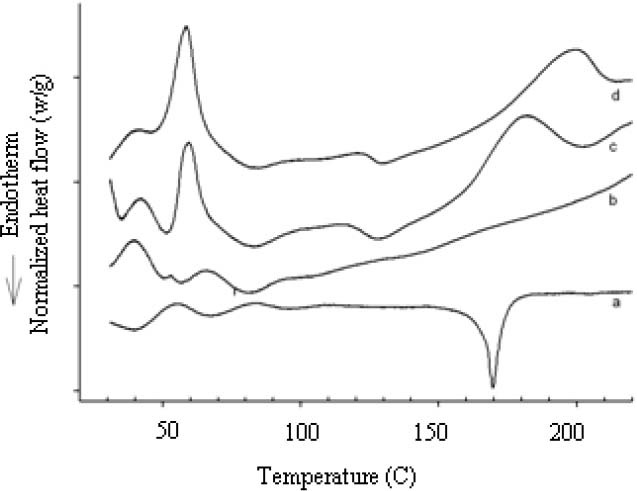
Differential scanning calorimetry curves of (a) glibenclamide, (b) glibenclamide solid dispersion (H5P3.5X0.5), prepared by supercritical fluid solvent-antisolvent techniques method, (c) carrier physical mixture (H6P3X1 and (d) glibenclamide solid dispersion (H6P4X0), prepared by SE method.
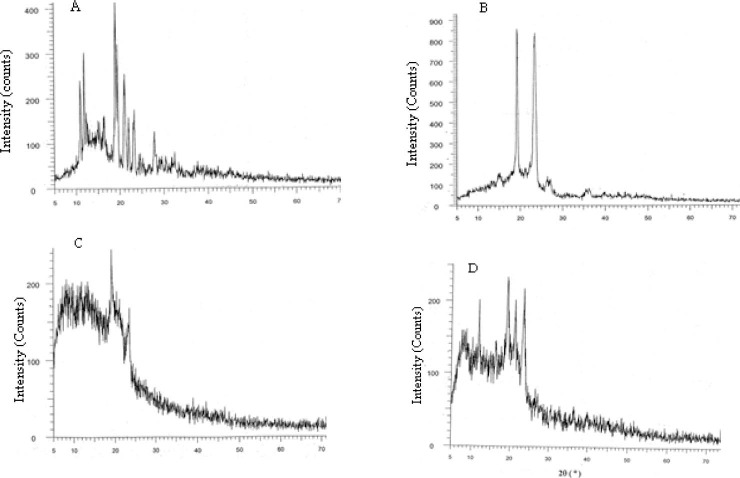
In the XRD of GLIB, sharp peaks at a diffraction angle (2θ) of 12, 13, 18, 19, 21, 22, 23, and 28 are indicative of crystalline form of GLIB. However, the sharp peaks are present at 12, 19, 21, and 23 for GLIB-SCF and at 19 and 23 for GLIB-SE (Fig. 3).
Fig. 3.
X-ray powder diffraction patterns of (a) glibenclamide, (b) glibenclamide-carrier physical mixture, and selected glibenclamide solid dispersion: (C) H6P4X0, prepared by SE method and (d) H6P3.5X0.5, prepared by supercritical fluid solvent-antisolvent techniques method.
Comparison of the dissolution profiles of pure GLIB, GLIB- carriers physical mixture, and GLIB formulations prepared by SE and SCF-SAS techniques are shown in Figs 4 and 5, respectively. The dissolution rate of GLIB in pH 9.5 phosphate buffer solution was very low with about 19% ± 0.98% dissolving at the end of 45 min. As shown in both figures, the dissolution rate of GLIB was significantly higher (p<0.01) from all GLIB formulations, as compared to pure GLIB or the GLIB-carriers physical mixture. Where only about 19% of GLIB powder was dissolved within 45 min the extent of drug dissolution during the same time period ranged from about 50-81% and 89-100% for GLIB formulations prepared by SE and SCF-SAS techniques, respectively.
Fig. 4.
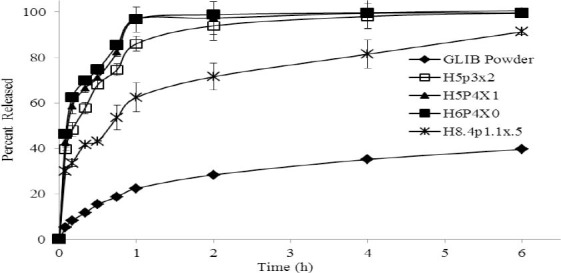
Dissolution curves of glibenclamide powder and typical glibenclamide formulations comprising various fractions of HPMCE5 (H), PEG6000 (P), and Poloxamer407 (X), prepared by SE method. A fixed 1:10 weight ratio of glibenclamide to the carrier system was used in all experiments. Each formulation is represented as a three-letter code with numbers indicating the fraction of each component in the carrier mixture, where H+P+X=100% (10).
Fig. 5.
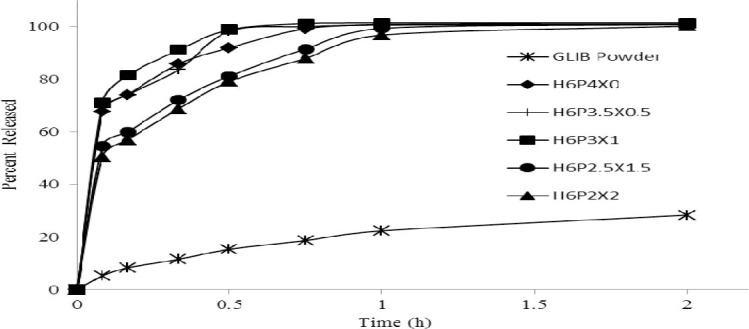
Dissolution curves of glibenclamide powder and typical glibenclamide formulations comprising various fractions of HPMCE5 (H), PEG6000 (P), and Poloxamer407 (X), prepared by supercritical fluid solvent-antisolvent techniques method (10 mg). A fixed 1:10 weight ratio of glibenclamide to the carrier system was used in all experiments. Each formulation is represented as a three-letter code with numbers indicating the amount of each component in the mixture.
Glibenclamide dissolution profiles of up to 2 h indicated a complete dissolution of drug (100%) from the formulations prepared by the SCF-SAS technique, whereas this ranged from 61-99 % from SE formulations and only 28% from pure GLIB.
Dissolution parameters, viz. release%45 min, DE, and MDT, which were calculated for GLIB formulations prepared by the SE and SCF-SAS techniques, are presented in Tables 1 and 2. The effects of formulation variables on these parameters were investigated using Design Expert version 7.1.5. The program provided suitable polynomial equations for the responses investigated as a function of formulation variables and their interactions (Table 3). The model terms for interactions generally exhibited to have higher influences on the responses than each variable alone, as indicated by greater values of their coefficients. The models suggested were analyzed statistically by applying ANOVA (p<0.05) for the responses. Table 4 represents a typical statistical analysis of a response (percent release in 45 min, as an example). In almost all statistical analysis of responses (not shown here), the significant model terms along with insignificant lack of fit and adequate precision were indicated in the analysis of variance test, suggesting suitability of the design used. To better evaluate the contribution of each of the three formulation variables, the response trace method also was used (Fig. 6).
Table 3.
Final equations of responses evaluated in terms of formulation variables*.
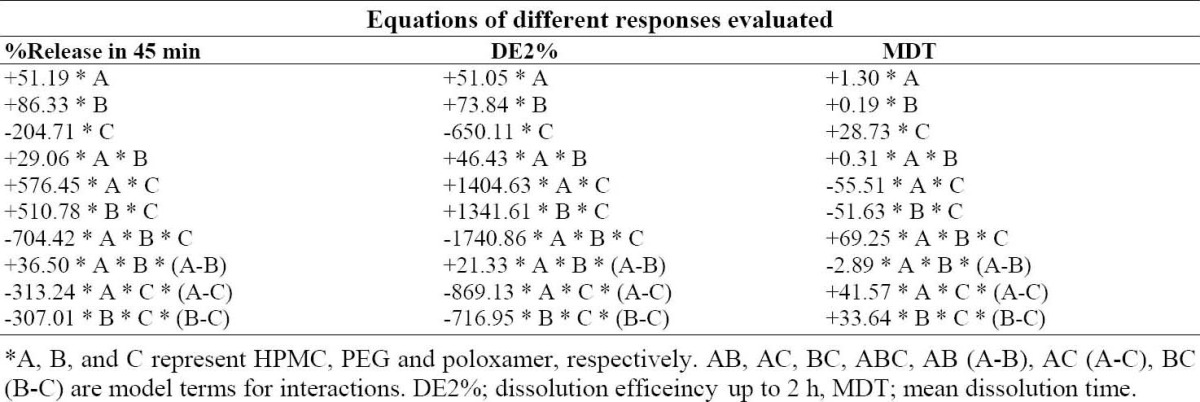
Table 4.
Summary of ANOVA for the response (release %45 min).
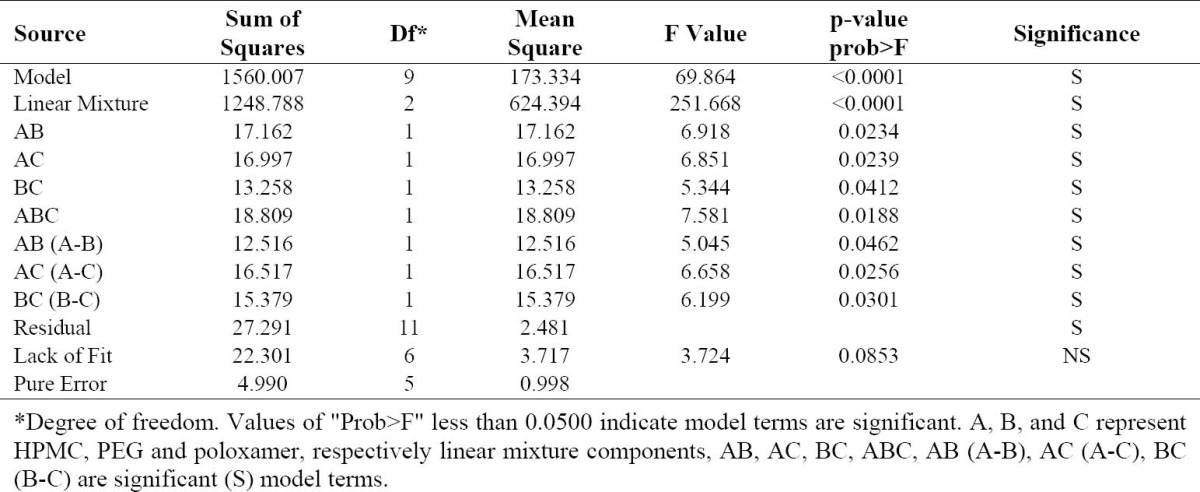
Fig. 6.
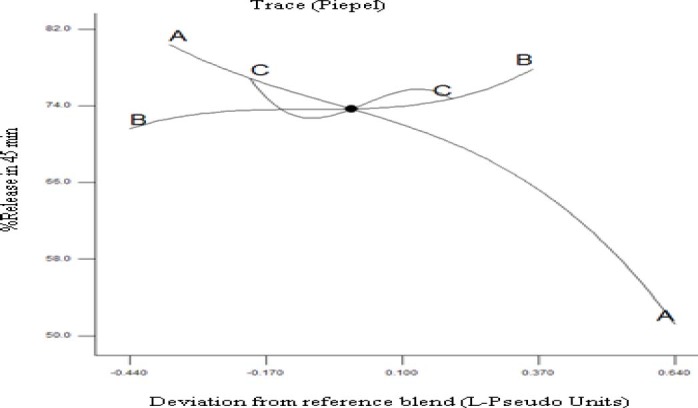
Response trace plot for the response release%45 min using as reference mixture the centroid of the constrained domain (A: HPMCE5 68%, B: PEG6000 22%, and C: Poloxamer407 10%).
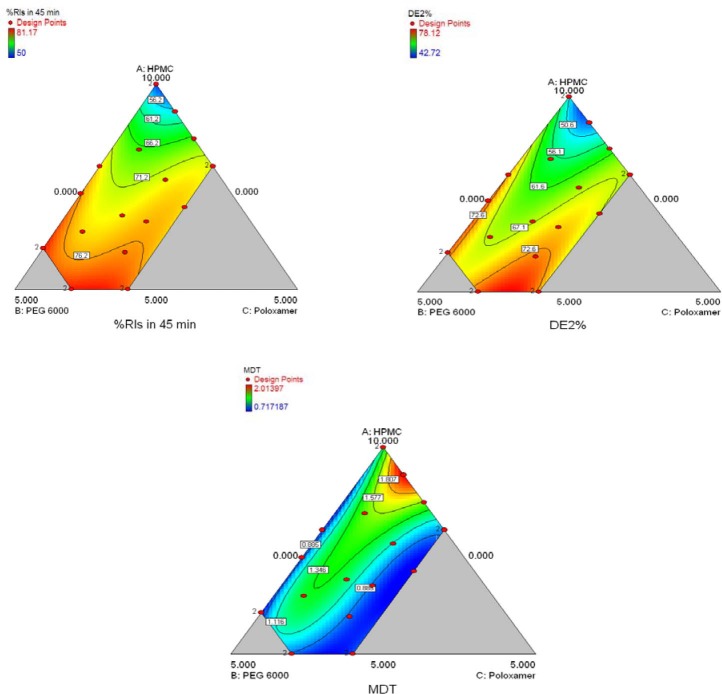
In this kind of plot the changes in the response due to the change of the proportion of a single component, while all other components are kept at a fixed value, is shown. Once a reference mixture has been selected (often the centroid of the experimental region), the graph exhibits the variation of the response moving, along the component axes, away from the reference mixture. The response trace plot (Fig. 6) illustrates that HPMC had a considerable effect on release%45 min. Higher values of response can be seen where higher levels of PEG6000, with respect to the centroid, is used. Finally, the response variation looks sigmoidal with poloxamer407 changing along the centroid, although the magnitudes of these variations are relatively small. Figs 7 and 8 are typical two-dimensional contour diagrams indicating percent release in 45 min, DE and MDT of GLIB as functions of formulations variables. In Fig. 7, the top point of the polygonal, restricted in the triangle, represents the highest HPMCE5 fraction used, whereas the base represents lowest HPMC fraction (i.e. 50%), with PEG6000 and poloxamer407 at their higher fractions, respectively at left and right points of the base. As seen, e.g. in the contour plot of release%45 min, the higher values of the response were observed where the fractions of HPMCE5, PEG6000, and poloxamer407 were at higher, lower, and close to middle values used in the SE formulations.
Fig. 7.
The contour plots of release%45 min, DE2% and MDT of glibenclamide release in pH 9.5 from glibenclamidesolid dispersion formulations comprising HPMCE5 (A), PEG6000 (B), and Poloxamer407 (C) of various ratios, prepared by the SE method.
Fig. 8.
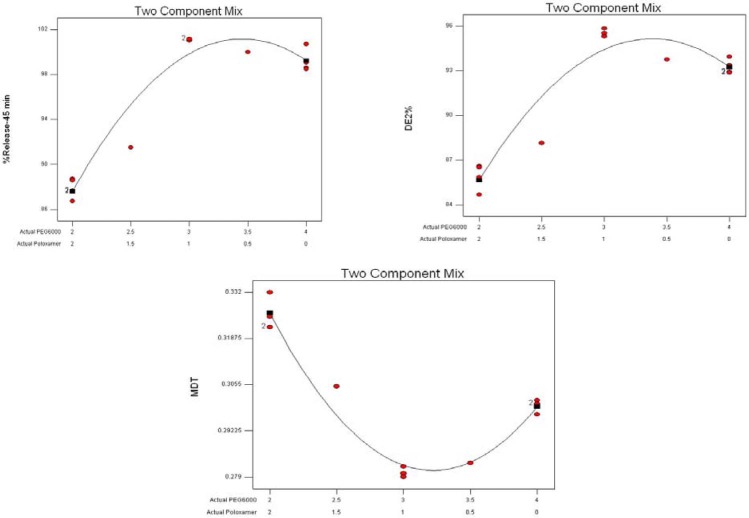
The contour plots of release%45 min, DE2% and MDT of glibenclamide release in pH 9.5 from glibenclamidesolid dispersion formulations comprising HPMCE5 (fixed at 60%), PEG6000 (20-40%), and Poloxamer407 (0-20%), prepared by the supercritical fluid solvent-antisolvent techniques method.
Fig. 8 indicates the effects of different variables (two components) on the dissolution parameters of the formulations prepared by the SCF-SAS technique. For example, the higher values of the release%45 min were observed where PEG6000 and poloxamer407 fractions used were at almost highest and lower to middle values, respectively. The HPMCE5 fraction was fixed at 60% in all formulations. A numerical optimization technique was used to set desired goals for each response and generate optimal conditions using the desirability approach. A constraint to maximizing release%45 min and DE and minimizing the MDT was to set the goal to indicate the optimal weight ranges of formulation variables based on the criterion of desirability. Fig. 9 represents contour plots of desirability for GLIB formulations prepared by SE and SCF technique. The upper plot indicate that SE formulations comprising lower HPMC, higher PEG and lower to middle poloxamer amounts produced lower MDT, higher DE2%, and higher release%45 min. To evaluate the optimization capability of the model generated according to the results of the D-optimal mixture design, an optimized GLIB formulation comprising HPMC (50%), PEG (40%), and poloxamer (10%) as carrier system, was prepared, its dissolution performance was studied and DE2% and release%45 min were calculated. The observed responses, as compared to the predicted responses by the model, are given in Table 5. The optimized GLIB formulation showed release%45 min of 81.2% and DE2% of 73.1, both close to the values predicted by the model, with small error values (−1% and 2.4%, respectively). In formulations prepared by SCF, where HPMC level was fixed at 60%, greater values of desirability of two-component mixtures were similarly located in regions of higher PEG levels (i.e. 34%) and lower to middle levels of poloxamer (i.e. 6%).
Fig. 9.
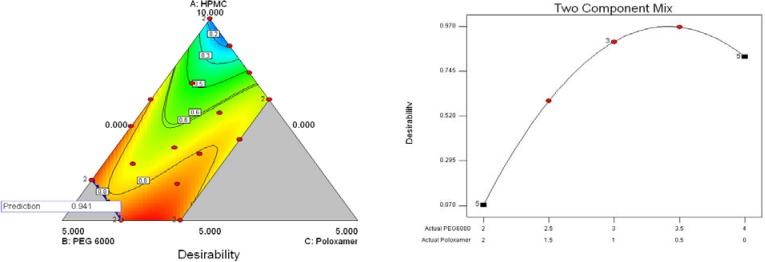
The contour plots of desirability, based on the criteria of maximal release%45 min and dissolution efficiency in 2 h and minimal mean dissolution time for glibenclamide formulations prepared by the SE (top) and SCF (bottom) techniques. The carrier systems were composed of varied fractions of HPMCE5, PEG6000, and Poloxamer407, where H+P+X=100% (10).
Table 5.
Comparison of predicted and observed dissolution parameters of an optimized formulation comprised of a fixed 1:10 weight ratio of glibenclamide to the carrier system consisting HPMCE5 (50%), PEG6000 (40%) and Poloxamer407 (10%), prepared by the solvent evaporation method.

DISCUSSION
The major bands of 3315, 1716, 1618, 1342, and about 111-1155 cm-1 appearing in FTIR spectra of GLIB formulations prepared by SE or SCF, though with decreased intensity, may be attributed to the dilution of the drug in the carrier and /or higher intensity of carriers’ bands.
Differential scanning calorimetry studies indicated the melting onset and peak at 165 °C and 169.9 °C, respectively, corresponding to melting behavior of the stable anhydrous form of crystalline GLIB (24). However, the absence of endothermic peaks in DSC thermograms of GLIB formulations, prepared by SE or SCF methods (Fig. 2), may partially be attributed to transformation of crystalline to amorphous drug or to the dissolution of drug in the carrier system at the temperatures below its melting (25,26,27,28). The lack of distinct endothermic event of GLIB in the DSC thermograms of SDs was also reported by Bartsch and coworkers (26). This was resulted from the gradual dissolution of active drug in the carrier system on heating, as also observed by hot-stage microscopy, and thereafter the stabilization of solid drug particles in a metastable form. The presence of much higher amounts of carriers, as compared to the drug, also may have lead to the peak disappearance in the thermograms (29). The endotherms seen at temperatures lower than GLIB melting temperature also may be attributed to the carriers glass transition (Tg), melting or dissolution. The endotherms of carriers in the DSC curves of SDs are often broadened, as compared to pure carriers, indicating a weak interaction of active drug with the carrier system (28).
The presence of peaks in the XRD of GLIB-SD and GLIB-SCF, though with reduced intensity and the fewer number, indicated that at least some amounts of GLIB existed in the crystalline form in the formulations. However, the reduced intensity and fewer number of characteristic XRD peaks suggest that crystallinity of drug and/or the carrier may have altered, possibly leading to enhancement of drug dissolution from formulations (28).
Comparison of GLIB dissolution profiles depicted in Figs 4 and 5 indicated the effects of carriers of various components and the techniques used to prepare GLIB formulations. The enhanced GLIB dissolution of the SDs compared to the physical mixture can be explained by the molecular dispersion of drug in the polymer matrix and/or partial change of the crystalline GLIB to a state of higher energy (i.e. amorphous) (25). The results also indicate that the carriers used in the formulations increase drug dissolution rate by providing a higher surface area of drug exposed to the dissolution medium, improving wettability of the drug particles (30,31) and/or maintaining a supersaturated solution by preventing re-crystallization. The higher drug dissolution rate of formulations prepared by the SCF-SAS technique, as compared to the SE method, can be resulted from the improved distribution of drug molecules in polymers due to the enhanced plasticization of polymers and reduced drug crystallinity caused by SC-CO2 (29,32).
The contour plots of desirability on dissolution data, generated by Design Expert, revealed that GLIB formulations comprising lower HPMC, higher PEG and lower to middle poloxamer amounts produced lower MDT, higher DE2%, and higher release% 45 min (Fig. 9). The desirability values of 0.941 and 0.966 were obtained for GLIB formulations prepared by SE and SCF-SAS methods. The close values of responses measured, i.e. DE2 % and R 45 min (%), to those predicted by the model indicated that the mathematical model obtained from the D-optimal mixture design was well fitted.
CONCLUSION
The results of this study clearly indicate that the dissolution rate of GLIB can be significantly improved by preparing drug SDs using various preparation techniques and certain proportions of different carriers. Enhanced drug dissolution was likely resulted from molecular dispersion of drug in the polymer carrier, the formation of amorphous precipitates of the drug and thus improved drug wettability by the dissolution medium. This was more strongly indicated in formulations prepared by SCF-SAS technique, as compared to SE method, seemingly due to the effects of SC-CO2 on enhanced plasticization of polymers, reduced drug crystallinity and thus increased diffusion of the drug into the polymer matrix. Further work is required to determine if administration of GLIB SDs with improved dissolution characteristics provides enhanced oral bioavailability of the drug.
ACKNOWLEDGMENT
We would like to thank the Research Council of Isfahan University of Medical Sciences, Isfahan, Iran for financially supporting this project.
REFERENCES
- 1.Vasconcelos T, Sarmento B, Costa P. Solid dispersions as strategy to improve oral bioavailability of poor water soluble drugs. Drug Discov Today. 2007;12:1068–1075. doi: 10.1016/j.drudis.2007.09.005. [DOI] [PubMed] [Google Scholar]
- 2.Patel SG, Rajput SJ. Enhancement of oral bioavailability of cilostazol by forming its inclusion complexes. AAPS Pharm Sci Tech. 2009;10:660–669. doi: 10.1208/s12249-009-9249-7. [DOI] [PMC free article] [PubMed] [Google Scholar]
- 3.Won DH, Kim MS, Lee S, Park JS, Hwang SJ. Improved physicochemical characteristics of felodipine solid dispersion particles by supercritical anti-solvent precipitation process. Int J Pharm. 2005;301:199–208. doi: 10.1016/j.ijpharm.2005.05.017. [DOI] [PubMed] [Google Scholar]
- 4.Vemavarapu C, Mollan MJ, Lodaya M, Needham TE. Design and process aspects of laboratory scale SCF particle formation systems. Int J Pharm. 2005;292:1–16. doi: 10.1016/j.ijpharm.2004.07.021. [DOI] [PubMed] [Google Scholar]
- 5.Davies OR, Lewis AL, Whitaker MJ, Tai H, Shakesheff KM, Howdle SM. Applications of supercritical CO2 in the fabrication of polymer systems for drug delivery and tissue engineering. Adv Drug Deliv Rev. 2008;60:373–387. doi: 10.1016/j.addr.2006.12.001. [DOI] [PubMed] [Google Scholar]
- 6.Thote AJ, Gupta RB. Formation of nanoparticles of a hydrophilic drug using supercritical carbon dioxide and microencapsulation for sustained release. Dis Month. 2005;51:362–373. doi: 10.1016/j.disamonth.2005.08.005. [DOI] [PubMed] [Google Scholar]
- 7.Pasquali I, Bettini R. Are pharmaceutics really going supercritical? Int J Pharm. 2008;364:176–187. doi: 10.1016/j.ijpharm.2008.05.014. [DOI] [PubMed] [Google Scholar]
- 8.Pasquali I, Bettini R, Giordano F. Supercritical fluid technologies: An innovative approach for manipulating the solid-state of pharmaceuticals. Adv Drug Deliv Rev. 2008;60:399–410. doi: 10.1016/j.addr.2007.08.030. [DOI] [PubMed] [Google Scholar]
- 9.Shariati A, Peters CJ. Recent developments in particle design using supercritical fluids. Cur Opin Solid StM. 2003;7:371–383. [Google Scholar]
- 10.Duarte AR, Roy C, Vega-González A, Duarte CMM, Subra-Paternault P. Preparation of acetazolamide composite microparticles by supercritical anti-solvent techniques. Int J Pharm. 2007;332:132–139. doi: 10.1016/j.ijpharm.2006.09.041. [DOI] [PubMed] [Google Scholar]
- 11.Sui X, Wei W, Yang L, Zu Y, Zhao C, Zhang L, et al. Preparation, characterization and in vivo assessment of the bioavailability of glycyrrhizic acid microparticles by supercritical anti-solvent process. Int J Pharm. 2012;423:471–479. doi: 10.1016/j.ijpharm.2011.12.007. [DOI] [PubMed] [Google Scholar]
- 12.Lobenberg R, Kramer J, Shah VP, Amidon GL, Dressman JB. Dissolution testing as a prognostic tool for oral drug absorption: dissolution behavior of glibenclamide. Pharm Res. 2000;17:439–444. doi: 10.1023/a:1007529020774. [DOI] [PubMed] [Google Scholar]
- 13.Wei H, Dalton C, Maso M, Kanfer I, Lobenberg R. Physicochemical characterization of five glyburide powders: A BCS-based approach to predict oral absorption. Eur J Pharm Biopharm. 2008;69:1046–1056. doi: 10.1016/j.ejpb.2008.01.026. [DOI] [PubMed] [Google Scholar]
- 14.Wei H, Lobenberg R. Biorelevant dissolution media as a predictive tool for glyburide a class II drug. Eur J Pharm Sci. 2006;29:45–52. doi: 10.1016/j.ejps.2006.05.004. [DOI] [PubMed] [Google Scholar]
- 15.Krgel I, Bodmeier R. Development of a multifunctional matrix drug delivery system surrounded by an impermeable cylinder. J Control Release. 1999;61:43–50. doi: 10.1016/s0168-3659(99)00096-6. [DOI] [PubMed] [Google Scholar]
- 16.Bertram U, Bodmeier R. In situ gelling, bioadhesive nasal inserts for extended drug delivery: In vitro characterization of a new nasal dosage form. Eur J Pharm Sci. 2006;27:62–71. doi: 10.1016/j.ejps.2005.08.005. [DOI] [PubMed] [Google Scholar]
- 17.Leonardi Do, Barrera Ma, Lamas Ma, Salomn C. Development of prednisone: Polyethylene glycol 6000 fast-release tablets from solid dispersions: Solid-state characterization, dissolution behavior, and formulation parameters. AAPS Pharm Sci Tech. 2007;8:221–228. doi: 10.1208/pt0804108. [DOI] [PMC free article] [PubMed] [Google Scholar]
- 18.Dumortier G, Grossiord J, Agnely F, Chaumeil J. A review of poloxamer 407 pharmaceutical and pharmacological characteristics. Pharm Res. 2006;23:2709–2728. doi: 10.1007/s11095-006-9104-4. [DOI] [PubMed] [Google Scholar]
- 19.Newa M, Bhandari K, Oh D, Kim Y, Sung J, Kim J, et al. Enhanced dissolution of ibuprofen using solid dispersion with poloxamer 407. Arch Pharm Res. 2008;31:1497–1507. doi: 10.1007/s12272-001-2136-8. [DOI] [PubMed] [Google Scholar]
- 20.Ahrabi SF, Madsen G, Dyrstad K, Sande SA, Graffner C. Development of pectin matrix tablets for colonic delivery of model drug ropivacaine. Eur J Pharm Sci. 2000;10:43–52. doi: 10.1016/s0928-0987(99)00087-1. [DOI] [PubMed] [Google Scholar]
- 21.Mura P, Furlanetto S, Cirri M, Maestrelli F, Marras AM, Pinzauti S. Optimization of glibenclamide tablet composition through the combined use of differential scanning calorimetry and d-optimal mixture experimental design. J Pharm Biomed Anal. 2005;37:65–71. doi: 10.1016/j.jpba.2004.09.047. [DOI] [PubMed] [Google Scholar]
- 22.United States Pharmacopeial Convention. USP 31. United States Pharmacopeial Convention. 2007 [Google Scholar]
- 23.Costa P, Sousa Lobo JM. Modeling and comparison of dissolution profiles. European J Pharm Sci. 2001;13:123–133. doi: 10.1016/s0928-0987(01)00095-1. [DOI] [PubMed] [Google Scholar]
- 24.Wei H, Dalton C, Maso M, Kanfer I, Löbenberg R. Physicochemical characterization of five glyburide powders: A BCS-based approach to predict oral absorption. Eur J Pharm Biopharm. 2008;69:1046–1056. doi: 10.1016/j.ejpb.2008.01.026. [DOI] [PubMed] [Google Scholar]
- 25.Shah T, Amin A, Parikh J, Parikh R. Process optimization and characterization of poloxamer solid dispersions of a poorly water-soluble drug. AAPS Pharm Sci Tech. 2007;8:E18–E24. doi: 10.1208/pt0802029. [DOI] [PMC free article] [PubMed] [Google Scholar]
- 26.Bartsch SE, Griesser UJ. Physicochemical properties of the binary system glibenclamide and polyethylene glycol 4000. J Therm Anal Calorim. 2004;77:555–569. [Google Scholar]
- 27.Rehder S, Sakmann A, Rades T, Leopold CS. Thermal degradation of amorphous glibenclamide. Eur J Pharm Biopharm. 2012;80:203–208. doi: 10.1016/j.ejpb.2011.07.009. [DOI] [PubMed] [Google Scholar]
- 28.Janssens S, de Armas HN, Roberts CJ, Van den Mooter G. Characterization of ternary solid dispersions of itraconazole, PEG 6000, and HPMC 2910 E5. J Pharm Sci. 2008;97:2110–2220. doi: 10.1002/jps.21128. [DOI] [PubMed] [Google Scholar]
- 29.Ugaonkar S, Nunes AC, Needham TE. Effect of n-scCO2 on crystalline to amorphous conversion of carbamazepine. Int J Pharm. 2007;333:152–161. doi: 10.1016/j.ijpharm.2006.12.010. [DOI] [PubMed] [Google Scholar]
- 30.Leuner C, Dressman J. Improving drug solubility for oral delivery using solid dispersions. Eur J Pharm Biopharm. 2000;50:47–60. doi: 10.1016/s0939-6411(00)00076-x. [DOI] [PubMed] [Google Scholar]
- 31.Broman E, Khoo C, Taylor LS. A comparison of alternative polymer excipients and processing methods for making solid dispersions of a poorly water soluble drug. Int J Pharm. 2001;222:139–151. doi: 10.1016/s0378-5173(01)00709-8. [DOI] [PubMed] [Google Scholar]
- 32.Rodier E, Lochard H, Sauceau M, Letourneau JJ, Freiss B, Fages J. A three step supercritical process to improve the dissolution rate of Eflucimibe. Eur J Pharm Sci. 2005;26:184–193. doi: 10.1016/j.ejps.2005.05.011. [DOI] [PubMed] [Google Scholar]


