Abstract
Recently, several studies have shown that the metal-fluoroquinolone complexes have more antibacterial and cytotoxic effects in comparison with free fluoroquinolones. These results may introduce new drugs for chemotherapy with fewer side effects. In this work a bidentated zinc (II) complex with ofloxacin (OZC) was synthesized and cytotoxicity activities and DNA binding of the resulted complex was studied. The in-vitro anti proliferative and cytotoxic effects of the free ofloxacin (OFL) and OZC against MCF-7, CaCo2 and SKNMC cell lines were tested by using Trypan blue and lactate dehyrogenase (LDH) assay methods. Results revealed that the OZC exhibits better anti proliferative and cytotoxic activities as compared with the OFL. This may be due to the more interaction of OZC with DNA. Therefore, the interaction of OZC with DNA was investigated by using voltammetry, UV-Vis, fluorescence, FT-IR and circular dichroism spectroscopy methods, and the equilibrium binding constant (Kb), binding site size, and thermodynamic parameters were measured. The results revealed that the OZC interacts with DNA via two modes: electrostatic and outside hydrogen binding. The proposed DNA binding modes may support the greater in-vitro cytotoxicity of OZC compared to OFL alone.
Keywords: Zn-ofloxacin complex, In-vitro cytotoxicity activity, DNA interaction, Thermodynamic measurements
INTRODUCTION
Today it is well demonstrated that some interactions of exogenous molecules with biological macromolecules such as DNA induces mutations and cancer, while others are useful for cancer therapy (1,2). Therefore, the interactions and binding studies of these molecules with biological macromolecules especially DNA have been widely considered for the treatment of a broad spectrum of diseases (3). In this regards, the interaction of transition metal complexes of fluoro-quinolones with DNA may greatly help to introduce new drugs with fewer side effects for cancer chemotherapy (4,5). The anti-bacterial effects of fluoroquinolones are largely attributed to the inhibition of DNA topoisomerases II (DNA gyrase) and IV of prokaryotes (6,7). Also, there are several reports for direct interaction of fluoro-quinolones with DNA (8,9). Recently, fluoroquinolones, functionalized fluoro-quinolones and transition metal complexes of fluoroquinolones, due to the in-vitro and in-vivo biological activities and cytotoxicity for many mammalian cells, have been considered as new agents for cancer chemotherapy, simultaneous antibacterial activity against Gram-positive and Gram-negative bacteria and treatment of other infections (10,11,12). Several researches have revealed that the binding ability of the transition metal complexes of fluoroquinolones to the DNA will significantly increase in comparison with the free fluoroquinolones (12,13,14). This is due to the multi modes of interaction with DNA such as: intercalation, major and/or minor grooves bindings, electrostatic interactions and outside hydrogen bindings. This effect may be a strong motivated force for the higher chemo-therapeutic effects of metal-fluoroquinolone complexes.
Therefore, the determination of interaction modes of metal-fluoroquinolones with DNA is of great interest for the development of metal-fluoroquinolones com-plexes as new anti-inflammatory, antifungal, antibacterial and anticancer compounds (15,16,17,18). Ofloxacin (OFL) is a potent antimicrobial agent and is widely used in the treatment of infections that are caused by gram-negative and gram-positive bacteria (19). OFL possesses two relevant ionizable functional groups: a basic piperazinyl group and a carboxylic acid group. It is a weak acid with 2 pKa's of 5.74 snd 7.9. The first pKa is due to the COOH group, and the second is due to the ring nitrogen. The carboxylic and the carbonyl groups are required for antimicrobial activity of OFL and chelating interactions with various cations take places in these groups.
Macias and coworkers reported an OFL-Cu complex with molecular formula of (Cu(oflo)2(H2O)).2H2O (20). Lee and colleagues reported the formation constant of 1:1 complex of OFL with Fe (III) by UV-Vis spectroscopy (21). Recently Patel and coworkers reported the in-vitro antibacterial activity of square planar complex of OFL-Pt (22), and showed that antibacterial activity of the complex is more than free OFL. They concluded that the synthesized complex cleaves the DNA more efficiently as compared to free OFL and metal salt.
Chen and colleagues synthesized a Sm (III)-OFL complex with the mole ratio of 1:3 and studied its interaction with ct-DNA by several methods such as: spectrometric titration, ethidium bromide displacement experiments by UV spectroscopy, ionic influence, viscosity measurements and circular dichroism (CD) spectroscopic measurements. They proved that the proposed complex may interact with ct-DNA via intercalation with binding constant of 1.8 × 10⁻⁵ M-1 (23). Recently, Akinremi and coworkers reviewed the biological activities of metal complexes of fluoroquinolones (24). According to our literature review, several reports exist for synthesizing complexes of OFL with Cu2+, Pd2+, Pt2+, Mg2+, Bi3+, and Ru3+ metal ions and evaluation of their antibacterial activities (20,25,26,7,28,29). However, reports on synthetizing Zn-OFL complex are scarce (30,31) and no report exist on cytotoxic and DNA binding studies of Zn-OFL complex. In the present work, we report the synthesis and evaluation of in-vitro cytotoxicity of OFL-Zn complex (OZC). The synthesized complex was checked for its DNA interacting behavior.
MATERIALS AND METHODS
Reagents
Double strand calf thymus deoxy-ribonucleic acid (ds-CT-DNA) and ofloxacin were purchased from Sigma (Sigma-Aldrich, Bellefonte, PA). Stock solutions of DNA were prepared by dissolving an appropriate amount of DNA in double distilled water and stored at 4 °C in refrigerator.
The concentration of the stock solution of DNA was determined by ultraviolet absorbance at 260 nm by using the molar extinction coefficient of 6600 M−1 cm−1 32). A solution of ct-DNA gave a ratio of UV absorbance at 260 and 280 nm more than 1.8, indicating that DNA was sufficiently free from proteins. The Zn(NO3)2., methanol (MeOH) and other reagents were purchased from Merck. The cancer cell lines including MCF-7, CaCo2, and SKNMC cell lines were purchased from the National Cell Bank, Pasteur Institute of Iran.
Instruments
An HP Agilent (8453) UV-Vis spectrophotometer equipped with a Peltier (Agilent 89090A) was used for studying of spectrophotometric titrations. All fluorescence measurements were carried out with a Beckman spectrofluorometer (LS45). Maximum excitation wavelength that used was 300 nm. The pH values of solutions were measured by a Metrohm pH meter model 827. NMR spectra were recorded at 9.4 T (1H resonating at 400 MHz) using a Bruker Avance NMR spectrometer equipped with a 5 mm normal configuration broadband tuneable probe. The cyclic voltammetry measurements were performed by a computerized voltammeter (Metrohm VA 797, from Metrohm) equipped with a three-electrode system: a hanging mercury drop electrode (HMDE) as the working electrode, Ag/AgCl as the reference electrode, and a platinum wire as the counter-electrode.
For all types of voltammetric measurements, the supporting electrolyte (1.0 mM Tris-HCl buffer solution, pH 7.3) was placed in a voltammetric cell of volume 10 mL and deaerated via purging with pure N2 gas for 2 min. The cyclic voltammetric measurements were carried out by keeping both concentrations of the OZC and the total volume of solution constant, while, the ct-DNA concentrations varied.
The FT-IR measurement was carried out by using Shimadzu (IR Prestige-21) equipped with a KBr beam splitter. The elemental analysis was performed using Heraeus CHN elemental Analyzer. Thermo gravimetric studies were performed for the complex by the TG-DTA STA model 503. CD spectra were recorded by using JASSCO (J-810) at 25°C.
Synthesize of ofloxacin-zinc complex
To 5.0 mL of warm methanol, 0.5 mmol (0.18 g) of OFL and 0.5 mmol of Zn(NO3)2.4H2O (0.13 gr) were added. The solution was stirred for 24 h and stored overnight under N2 atmosphere. After 24 h, the methanol evaporated and the resulted solid compound was filtred, washed with methanol and dried at room temperature. The product yield was 94%. The structure of complex was characterized by FT-IR, thermogravimetry, 1H NMR spectroscopy and elemental analysis.
Cell culture
In this work we used the SKNMC (derived from a metastatic supra-orbital human brain tumor), Caco-2 (heterogeneous human epithelial colorectal adenocarcinoma cells), and MCF-7 (derived from breast adenocarcinoma) cell lines. All cell lines were seeded in 75-cm2 tissue culture flasks and maintained in RPMI 1640 and Dulbecco's MEM supplemented with 10% heat-inactivated fetal bovine serum, 50 U mL-1 penicillin and 50 μg mL-1 streptomycin. The medium was renewed every two days and the cell cultures were incubated at 37 °C in a humid atmosphere (95% air and 5% CO2).
Cell viability inhibition assays
Trypan blue assay
All cell lines (SKMNC, Caco-2 and MCF-7) at a density of 5.0 × 10⁴ per well were seeded in 24-well plates overnight. The day after, the medium was changed by fresh complete medium which contained increasing concentrations of OFL and OZC from 0 to 366 μg mL-1 (33). At the 72nd h of treatments, the cells were washed with phosphate buffer solution (PBS) and harvested. Trypan blue dye was further added to the cell suspension. The Trypan blue-staining cells were examined as damaged or dead cells (34).
Lactate dehydrogenase cytotoxicity assay
The cytotoxic effects of OFL and OZC were also examined by lactate dehrogenase (LDH) assay as described by Linford (35) with some modifications. Briefly, the cell lines were separately plated at a density of 5.0 × 10³ per well in 96-well micro plates with Roswell Park Memorial Institute/Dulbecco's Modified Eagle (RPMI 1640/DMEM) medium containing 10% fetal bovine serum (FBS), and allowed to incubate overnight. After 24 h of early cell culture, the fresh medium with OFL and OZC at concentrations of (0-366 μg mL-1) was renewed (33).
At the 72nd h of treatments, the plates were centrifuged and 100 μL of the media from each well was then transferred to a new 96-well plates. Thereafter, 100 μL of LDH assay mixture was added to each well and plates were incubated at 37 °C for 30 min. A group of wells were treated with 1% Triton X-100 solution for 45 min to maintain maximum LDH release. The LDH release was estimated by using a microplate reader at495 nm according to the manufacturer's instructions. Tests were carried out three times. The mean cell viability was expressed as the percentage of control.
Proliferation assay
The cell lines were plated in 24-well plates at a density of 5.0 × 10⁴ cells per well in complete medium and incubated at 37 °C under a humidified atmosphere containing 5% CO2 for 24 h. The day after, the cells were treated with fresh medium containing 10% FBS and the determined concentrations of the compounds (μg mL-1). After 72 h, the treated and untreated cells were removed by trypsin and counted against control wells using a Coulter counter (KX-21 Sysmex Co) (36).
Spectrophotometric titration of ofloxacin-zinc complex with DNA
The spectrophotometric titrations of OZC with ct-DNA were carried out similar to our pervious works (37) as follows: the addition of DNA solution (0.0-2.5 × 10⁻⁵ M) to 2.0 mL solution of OZC (2.5 × 10⁻⁵ M) was carried out by using a pre-calibrated micropipette. The spectrum of solution was recorded after each addition. The addition of DNA to solution was continued until the desired ri= [DNA]/[OZC]=1.0 achieved. At this given ri no spectrum change was observed. The binding constant (Kb) was measured using Eq. (I).

where, εa is the extinction coefficient of OZC at maximum wavelength (290 nm) after each addition of DNA, εf is the extinction coefficient of the OZC without any addition of DNA, εb is the extinction coefficient of the OZC when fully bounded to DNA (after that by the addition of DNA no change should be observed in the absorbance). The εf was measured from the slope of the calibration curve of OZC, using the Beer–Lambert law. εb was determined from the absorbance of OZC at maximum wavelength (290 nm), when the addition of DNA did not result in further changes in the absorption spectrum of OZC. Finally, εa was determined as the ratio between the measured absorbance after each addition of DNA and OZC concentration. The experimental data of [DNA]/(εa − εf) versus [DNA] gives Kb as the ratio of the slope to the intercept.
Fluorescence study of interaction of ofloxacin-zinc complex with DNA
Emission spectra were recorded between 400 and 575 nm with an excitation wavelength of 300 nm, corresponding to the λmax of OZC in the Tris-HCl buffer (0.01 M and pH=7.3). Increasing amounts of DNA were added directly into the cell containing the OZC solution (2.5 × 10⁻⁷ M). The concentration ranged from 0.0 to 2.5 × 10⁻⁷ M for DNA. The solution in the cuvette was thoroughly mixed before each scan. All measurements were performed at 25 °C.
FT-IR studies for interaction of DNA with ofloxacin-zinc complex
The spectra of the DNA–OZC solutions were recorded using a cell of AgCl. Spectra were collected after interaction of different amounts of OZC with DNA solution (2.5 × 10⁻³ M) (ri = (DNA)/(OZC)=40.4). The spectra were measured over the spectral range of 4000 to 600 cm−1 with a nominal resolution of 2 cm−1 and a minimum of 50 scans. The blank windows and water were removed by BGK mode of instrument according to our previous work (38). The spectra were smoothed with Golly procedure.
Circular dichroism measurement
The CD studies were carried out in 1.0 mM Tris–HCl solution which contained 5.0 × 10⁻⁵ M of DNA. The spectra were recorded during progressive addition of OZC with R’i=(OZC)/(DNA)=0.0, 0.5, and 1.0. In the region of 200-350 nm the OZC has a CD signal therefore, the CD spectrum in each R’i was obtained after subtraction of the blank (buffer + corresponded OZC in each R’i).
Voltammetric measurements
The cyclic voltammetric measurements were carried out by keeping both concentrations of the OZC (5.0 × 10⁻⁵ M) and total volume of solution constant, while the ds-DNA concentration varied (0.0 to 5.0 × 10⁻⁴ M). Subsequently, a single-sweep cyclic voltammetric experiment was performed at a given scan rate 50 mV s−1, with an initial potential of 0.0 V and a vertex potential of -1.6 V.
RESULTS
The proposed structure of ofloxacin-zinc complex
The FT-IR spectroscopy with KBr windows was used for studding the nature of Zn-OFL binding at resulted complex. It is well shown that the general mechanism of the interaction between quinolones and the metal cations is chelation between the metal and the pyridone oxygen atom (4-oxo) and carboxylic groups (39); therefore, we only studied the vibrations of these groups.
The carboxylic acid group is documented by the OH stretch, the ν(C=O) stretch, ν(C–O) stretch and OH deformation. The disappearance of the absorption band at 1712 cm-1 is due to the interaction of free carboxylic acid and Zn ion (32). Also for OZC, two bands around 1622 and 1475 cm-1 were observed which can be attributed to the asymmetric and symmetric ν(O–C–O), respectively (32,40). The carboxylate group can bind to metal ions in a monodentate, bidentate, or bridging manner.
The frequency difference [Δν=νas(COO-)-νs(COO-] was used to determine the binding mode of carboxylate with Zn ion (41). As Δν was greater than 200 cm-1, we, therefore, concluded this group may bond to Zn via mono dentate way, like to the reported complex in the literature (42). The absorption band in the 1622 cm-1 region attributed to the ketone group in the free ligand spectra is shifted to 1575 cm-1 in the complex which is a good indication that this group is coordinated to the Zn (II) ion (31). In the 3400 cm-1 region, the broad absorption band is due to the OH stretching of water molecule. The elemental analysis calculated for [Zn(oflo).(H2O)2](NO3)2 were C 36.2, H 3.9, N 11.4 and Zn 10.8%. Already the same structure was reported for other metal complexes of OFL (43).
The 1H NMR spectra of OZC and free OFL were recorded in D2O/MeOD. The1H NMR spectra of OFL exhibited several peaks at about δ=6.5–8.2 ppm which assigned for aromatic protons, the peak of δ=7.5 ppm may be attributed to the azomethine proton (–CH–N–) and the peak of δ=10.08 ppm could be devoted to the COOH moiety.
However, the 1H NMR spectra of OZC shows small shifts and the peak of 10.08 ppm was roughly vanished. The same behavior was reported by Sagdinc and Bayarı for complex of OFL with Ca2+, Mg2+, Ba2+, Co2+, Ni2+ and Zn2+ ions (30). Based upon analysis of the results obtained, the coordination of the OFL to the Zn2+ ion occurs in the most usual way, i.e., via the ketonic and carboxylic oxygen atoms.
The thermal gravity analysis was used to ascertain the nature of associated water molecules in the complex. The instrument operated at a heating rate of 10 °C per min in the range of 30–700 °C in N2. The thermo gravimetric results further confirmed the proposed formulas. The t.g. curve for proposed complex shows three weight losses. The first, in the 50–140 °C range, corresponds to the loss of two water molecules (calculated: 6.48%, found: 6.65%).
The second and the third inflections, near 400 and 480 °C, respectively, are attributed to the complex thermal decomposition. Fig. 1 shows the proposed structure of OZC complex with molecular formula of [Zn(oflo).(H2O)2](NO3)2.
Fig. 1.
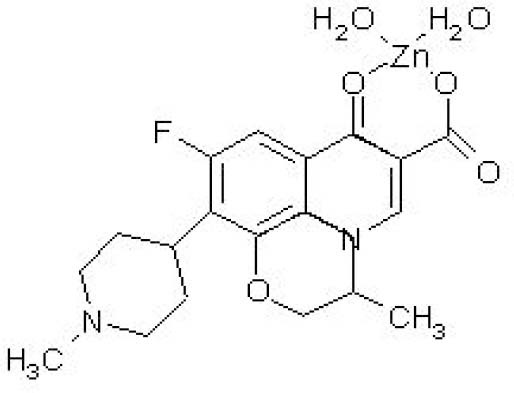
The proposed structure of synthesized ofloxacinzinc complex.
Assessment of interaction of DNA with ofloxacin-zinc complex with spectroscopic titrations
Fig. 2 represents the absorption spectrums of OZC in the absence and presence of increasing amounts of DNA at ri=([DNA]/[OZC])=0.0-1.0. As it is observed, the OZC have three peaks at 330, 292 and 258 nm. By addition of DNA the peaks of 258 and 292 nm exhibited hyperchromism and weak blue shift that may be due to the interaction of aromatic chromophore ligand of OZC and DNA, while no significant hyperchromism and blue shift was observed for peak at 330 nm. The absorption spectrums of OZC in the region 258-330 nm is due to the intraligand (IL) π-π* transition of OFL chromophore. For investigation of OZC-DNA interaction the changes of peak at 292 nm was selected.
Fig. 2.
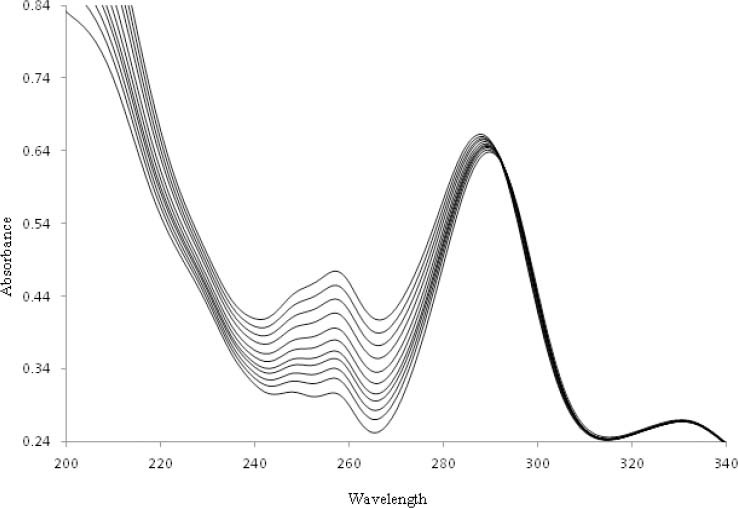
Absorption spectrum of 5.0 × 10⁻⁵ M of ofloxacin-zinc complex (OZC) in absence and presence of DNA with ri=(DNA)/(OZC)=0.0, 0.1, 0.2, 0.3, 0.4, 0.5, 0.6, 0.7, 0.8, 0.9, and 1.0 at 25 °C.
The addition of increasing amounts of DNA to the solution of OZC resulted in the weak hyperchromicity (H) and little blue shift (~ 4 nm) of the absorption maxima in the UV–Vis spectrum of OZC (peak at 292 nm). This increase in absorbance of OZC provides the first indication of the formation of ground-state complex between the OZC and ct-DNA. But this relative small change in hyperchromicities and blue shift of OZC upon introducing CT-DNA reveals that, this complex interaction with CT-DNA may be through the outside-binding mode (44).
In other words, the OZC interaction with DNA may be through an electrostatic and hydrogen binding between the oxygen moieties of the OFL and the nucleotides (45). In order to obtain the equilibrium binding constant (Kb) of DNA-OZC complex, the following equilibrium was considered.
ct-DNA + L = ct-DNA – L
where, L denotes to ligand (L= OZC). The Kb can be measured from the changes in absorbance at a fixed wavelength of 292 nm, by using the equation (I). The equilibrium constant binding of DNA-OZC at 25 °C was found to be 8.9 (± 1.1) × 103 M-1 (n=3). We have also checked the effect of addition of ct-DNA on free OFL. The results showed that after addition of ct-DNA, a concomitant decrease in absorbance, opposite to that of the OZC, occur. The results indicated that the OZC interacts with DNA via a different mode in comparison with free OFL. Therefore, the equilibrium constant binding of free OFL and DNA was measured and obtained as 6.3 × 10² M-1.
Thermodynamic measurements
The determination of thermodynamic parameters of drug–DNA complex is so interesting for determining the responsible factors of overall binding affinity and specificity of the drug (9,46).
The first step in most investigations is determining the equilibrium binding constant (Kb), experimentally and hence the observed Gibbs free energy change, ΔGbind (ΔGb=-RT ln Kb). In this experiment, binding-induced changes in the spectral properties of the OZC were monitored by using UV–Vis spectroscopy at 278-298 K.
The ln K values obtained at four different temperatures were plotted against the reciprocal of temperature according to the van’t Hoff equation. For OZC the change in the enthalpy due to interaction was -53.93 kJ mol-1 and change in entropy was -105.34 J mol-1 K-1.
The negative ΔG value (-23.32 kJ mol-1) of interaction of ct-DNA with the complex indicates the spontaneity of the complexation. The decrease in entropy may be due to the interaction of OZC with DNA and form a stable complex via electrostatic and outside hydrogen binding interaction (47). Due to the interaction of the complex with the DNA backbone, the structure of the double helix is distorted to a more random one.
The thermodynamic parameters like changes in free energy (ΔG), enthalpy (ΔH) and entropy (ΔS) due to ligand binding provide an insight into the binding mode. Hydrogen bonds, van der Waals, hydrophobic and electrostatic interactions are the major interactions that play a key role in molecular recognition. It is found that, the interaction process is enthalpy driven and the major contribution of ΔG comes from negative ΔH. However, a negative enthalpy change and a negative entropy change indicate that significant immobilization of ct-DNA and the ligand occurs in an initial step which involves van der Waals and hydrogen associations and result in negative ΔS (48). In the subsequent interacting complex, the small negative ΔH contribute to the overall ΔG may be associated to electrostatic interaction and hydrogen binding (49).
The fluorescence quenching studies
The study of fluorescence quenching may help to evaluate the type of fluorophore–quencher interactions. In dynamic quenching, the fluorophore and quencher has a collision during the life time of the excited state of fluorophore, while in static quenching the fluorophore and quencher form a non-fluorescence complex. For distinguishing of static and/or dynamic quenching two methods were used, the assessment of binding constants of fluorophore-quencher in different temperatures and, the assessment of lifetime measurements (50). In this paper, the lifetime measurements were selected to elucidate the quenching mechanism by using Stern–Volmer equation (Eq. II) (50,51):

where, F0 is the fluorescence intensity of OZC in the absence and F is the fluorescence intensity of OZC in the presence of the quencher. KSV is the Stern–Volmer quenching constant, kq is the quenching rate constant of the biomolecule and is 2.0 × 10¹⁰ L mol-1s-1 for a scattering collision quenching constant (52), τ0 is the lifetime of the fluorophore without quencher, and [Q] is the concentration of quencher (DNA).
The fluorescence emission spectra of OZC in different concentrations of DNA are shown in Fig. 3. The OZC was excited at wavelength of 300 nm and emitted a strong fluorescence peak at 497 nm. When a fixed concentration of OZC was titrated with increasing amounts of DNA, a remarkable decrease and a slight blue shift at the maximum wavelength of OZC fluorescence emission were observed.
Fig. 3.
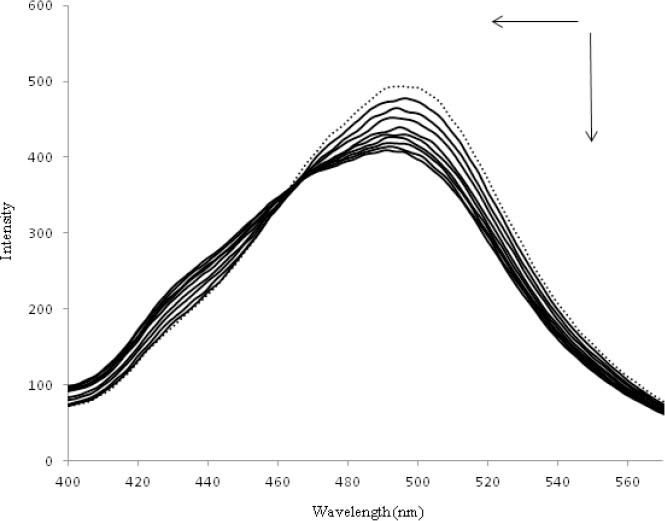
Fluorescence spectra of the ofloxacin-zinc complex in the absence (dotted line) and presence of the increasing amounts of DNA in Tris-HCl buffer solution at 25 °C. ri=(DNA)/(ACC)=0.0, 0.1, 0.2, 0.3, 0.4, 0.5, 0.7, 0.8, 0.9, 1.0.
The results indicated that DNA could quench the intrinsic fluorescence of OZC and the binding of OZC to DNA indeed exists. From the Stern–Volmer plot the values of KSV=1.07 × 10⁶ M-1 and kq=1.07 × 10¹⁴ M-1 s-1 were obtained (Fig. 4a). As the value of kq is greater than of the maximum scattering collision quenching constant, it is concluded that the quenching mechanism of OZC by DNA is a static quenching procedure. Moreover, the quenching of fluorescence emission of OZC was used for the measurement of equilibrium binding constant (Kb) and the numbers of binding sites (n) of DNA–OZC complex by the equation (III) (53):
Fig. 4.
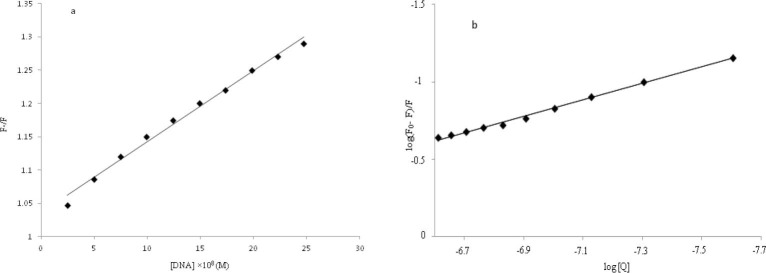
a; The Stern–Volmer plots of F0/F versus (Q) at the 298 K, b; a plot of log (F0- F)/F versus log (Q).

where, Kb and n are the equilibrium binding constant and the number of binding sites in base pairs, respectively. Thus, a plot (Fig. 4b) of log (F0- F)/F versus log [Q] yielded the Kb equal to 8.16 (± 0.85) × 103 (for three replicates) and n=0.53. The value of n approximately equal to 0.5 suggesting that there were 2 classes of binding sites for OZC towards DNA.
The reported values of the binding constants for some typical intercalators such as ethidium bromide and acridine orange were 2.6 × 10⁶ L mol-1 and 4 × 10⁵ L mol-1 (54), respectively. In this work, the binding constant of the DNA–OZC was 8.16 × 10³ L mol-1 at 298 K, which was smaller than the values of typical intercalators, ethidium bromide and acridine orange, and confirmed the non-intercalation interaction.
Fourier transform infrared measurements
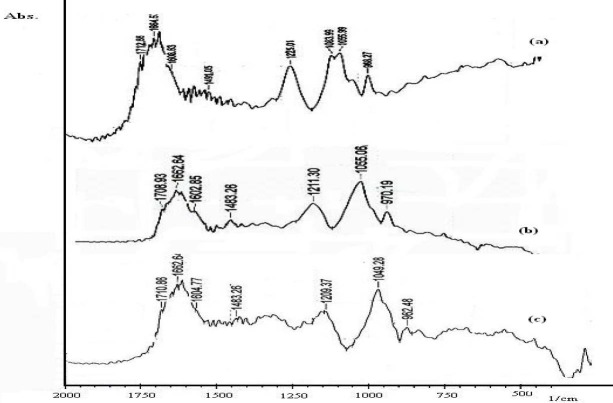
We used FT-IR to determine OZC binding sites, sequence preference and the structural variations of OZC–DNA complex in an aqueous solution. The IR spectral features for OZC–DNA interaction are presented in Fig. 5. The vibrational bands of DNA at 1712, 1664, 1608 and 1491 cm−1 are assigned to guanine (G), thymine (T), adenine (A) and cytosine (C) nitrogenous bases, respectively. Bands at 1225 and 1083 cm−1 denote to phosphate asymmetric and symmetric vibrations, respectively. The band at 1055 cm−1 is assigned to the sugar vibration. The OZC–phosphate interaction can be characterized from the change of intensity and shifting of the phosphate asymmetric band at 1225 cm−1 and symmetric band at 1083 cm−1, in the spectra of the OZC–DNA complex (spectrum a).
Fig. 5.
The IR spectral features for ofloxacin-zinc complex–DNA interaction, (spectrum a) pure DNA at concentration of 2.5 × 10⁻³ M, (spectrum b) R’i =1/40, and (spectrum c) R’i =1/4.
In the presence of OZC at R’i=1/40, shifting for the bands at 1712 (guanine) to 1708, 1664 (thymine) to 1662, 1608 (adenine) to 1602 were observed, and the band of 1084 (symmetric stretching phosphate) disappeared. The observed shifting was accompanied by a decrease in intensities of guanine band (9%), thymine band (6%), and adenine band (11%). A minor loss of intensity of DNA in plane vibrations can be attributed to partial helix stabilization as the result of OZC–DNA complexation (spectrum b).
Similar spectral changes were observed in the spectrum of complexation of Al-curcumin with DNA (5). As OZC concentration increased (R’i=1/4), shifting of the bands at 1712 (guanine) to 1710, 1664 (thymine) to 1662, 1608 (adenine) to 1604, 1491 (cytosine) to 1483, were observed and the band of 1084 (–PO2 symmetric) disappeared. Also a major decrease in the intensities of –PO2 symmetric and asymmetric bands were observed (spectrum c).
However these results indicate the major interaction of OZC without side binding and backbone phosphate groups. However according to the FT-IR spectra two modes of interaction are predominant, a weak electrostatic interaction of OZC with backbone phosphates and an outside hydrogen binding between –NH2 moiety of guanine and adenine base pairs and OZC.
Circular dichroism measurements
In order to understand the interaction of OZC with DNA, CD spectral properties were investigated. Owing to the cationic nature of OZC at pH=7.3 and to the polyanionic nature of ct-DNA, it can be anticipated that the electrostatic interaction may be the predominant mode (55). To stress this issue, the effects of OZC on the structure and conformation of ct-DNA were further analyzed by circular dichroism. The CD spectra of ct-DNA following addition of increasing amounts of OZC are shown in Fig. 6.
Fig. 6.
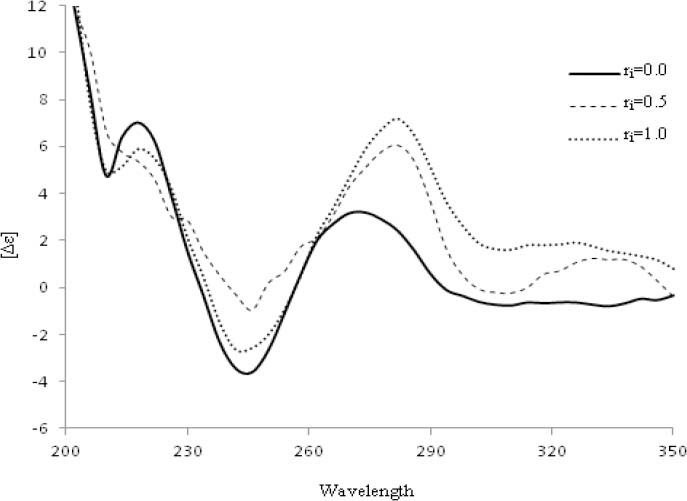
The circular dichroism spectrum of ct-DNA (5.0 × 10⁻⁵ M) in absence (solid line) and presence of 2.5 × 10⁻⁵ and, 5.0 × 10⁻⁵ M of ofloxacin-zinc complex.
In this experiment, the R’i values typically ranged from 0.0 to 1.0. It is observed that addition of the various OZC causes significant and distinct spectral perturbations of CD spectrum of ct-DNA. OZC causes disappearance of the negative band at 240 nm; an isodichroic point is observed at 262 nm suggesting the occurrence of equilibrium between free and bound DNA complex.
The disappearance of the negative peak indicates that a transition of the secondary DNA structure from B- to A-form occurs (56). This effect was attributed to the intrastrand linking of the adjacent guanines so that the DNA conformation is modified and destacking of the adjacent guanines bases occurs (57). As R’i is increased, a significant increase of the positive band and a dramatic red shift (8 nm) of the positive band is observed.
Electrochemical behavior of ofloxacin-zinc complex
The cyclic voltammograms of 5.0 × 10⁻⁵ M of Zn (solid red line), OFL (solid black line), OZC in absence of DNA (blue dash line) and OZC in the presence of DNA (black round dote line) in Tris-HCl buffer (pH=7.3) at the surface of HMDE is shown in Fig. 7. At forward sweep potentials (-0.2 to −1.6 V with scan rate of 50 mV S−1), one irreversible cathodic peak in potential of −1.45 V was obtained for OFL (Peak NO. II) and in backward sweep potentials (−1.6 to 0.0) no peak was observed. For OZC in the absence of DNA three peaks were observed (I, II′ and III). As can be observed from Fig. 7, the peak potentials of reduction and oxidation of zinc ion (I and III) in its complex form were shifted and their peak currents increased.
Fig. 7.
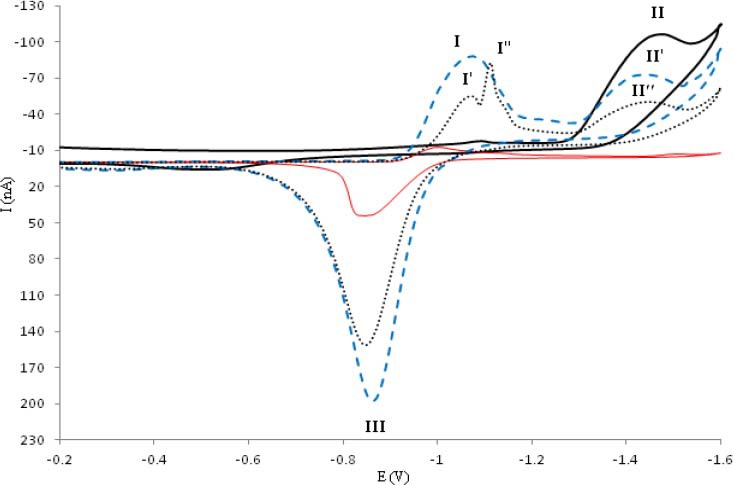
The cyclic voltammogram of 5.0 × 10⁻⁵ M of Zn (solid red line), ofloxacin (solid black line), ofloxacinzinc complex in absence of DNA (blue dashed line) and ofloxacin-zinc complex in the presence of DNA (black round dotted line) in Tris-HCl buffer (pH=7.3) at the surface of hanging mercury drop electrode at scan rate of 50 mV s-1.
Our earlier studies on differential pulse voltammetric behavior of several metal ions in the absence and presence of several complexing agents at HMDE show that, in the presence of complexing agents, both cathodic and anodic current peaks of metal ions significantly were increased. This enhancement of peak currents of metal ions might be due to the adsorption phenomena of metal-ligand complexes at HMDE (58,59,60,61). However in this study the current peak II′ (peak of OFL) was reduced in OZC. The cyclic voltammetric of peak II related to the reduction of OFL by following mechanism (Schem I):
Schem I.
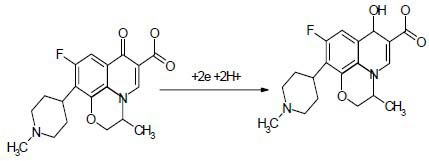
The reduction mechanism of ofloxacin under physiological pH.
By the addition of DNA, all cathodic and anodic peaks of OZC (I, II′, III) decreased and slightly shifted towards the negative and positive potentials. In addition, the peak of (I) shifted to negative potentials and divided into two peaks (I′ and I′′). This could be due to the presence of two modes of equilibrium interactions of OZC with base pairs and backbone phosphate of DNA.
A part of OZC interacts via electrostatic (peak I′′) and a part of OZC interacts via hydrogen binding with DNA (peak I′). In other words, the peak I′′ relates to the direct interaction of Zn ion of OZC with phosphate moiety and therefore, the peak potential more shifted to negative potentials, while the peak I′ represent the interaction of other parts of OZC with DNA.
As the changes in peak reduction of OZC at potential −1.05 (I) is complex, therefore, the reduction of peak II′ was considered for the evaluation of electrochemical behavior of OZC in the presence of DNA. The dependence of cathodic peak current of OZC to the scan rate (ν) in the absence and the presence of excess of DNA was examined at HMDE. Under selected experimental conditions, by increasing the scan rate, all cathodic and anodic peak currents of OZC in the absence of DNA considerably increased, while in the presence of 5.0 × 10⁻⁵ M of DNA all peak currents slowly increased.
The negative shift of reduction peak potential (NO. II′) with increasing scan rate (ν) demonstrated an irreversible electrode process for peak NO II′. The plots of peak current (NO II′) versus ν and ν1/2 for OZC in the absence and the presence of DNA showed that the peak current varies linearly with the scan rate, ν, rather than with ν1/2. The results indicated that the mass transport of OZC and OZC-DNA complex to the HMDE surface is an adsorptive controlled process.
The electrochemical titration is more valuable to quantify the interaction parameters of an electro active molecule with DNA in comparison with other methods (62). By addition of different amounts of DNA to the voltammetric cell containing 5 × 10⁻⁵ M of OZC, the cathodic peak currents of OZC begin to decrease and the formal potential shifts to more positive values which suggest the interaction of the OZC with DNA.
When  cyclic voltammetric currents of OZC decreased and were stable (see Fig. 8). The decrease of all anodic and cathodic peak currents is due to the decrease of diffusion coefficients of the OZC-DNA species and equilibrium concentration of OZC in the solution.
Fig. 8.
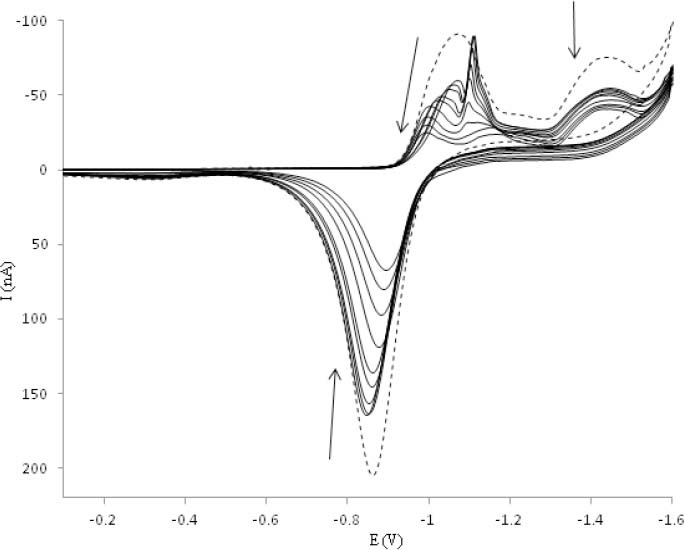
Cyclic voltammetric titration of 5.0 × 10⁻⁵ M of ofloxacin-zinc complex with DNA (DNA concentration varied from 0.0 to 5.0 × 10⁻⁴ M).
According to these observations, it seems that the decrease of peak currents of OZC after an addition of excess DNA are caused by the interaction of OZC to the bulky, slowly diffusing DNA, which results in a considerable decrease in the apparent diffusion coefficient.
The binding constant (K), binding site size (s), diffusion coefficients of free (Df), and bound (Db) per molecules can be obtained from a non-linear regression analysis of the experimental data (ipc versus [R] plot) according to Eq. (IV).

where,  and Ct, is the total concentration of analyt. In fact, B represents the appropriate, concentration-independent terms in the voltammetric expression and is calculated by the eq. (V).

where, A is area of electrode surface, ν is linear scan rate (mv s-1). In our previous works, we completely proved the Eq. (IV) and explained all parameters of equations (IV) and (V) (5,33,55,62,63). Since ipc, total concentration of OZC (Ct) and nucleotide phosphate concentration (NP) are experimentally measurable and (αn)f, (αn)b, have already been acquired as mentioned above, the binding constant (K) and binding site size (s) of the OZC-DNA, Df and Db can be obtained from a non-linear regression analysis of the experimental data (ipc versus R=[NP]/[Ct] plot) according to Eq. (V). The nonlinear fit analysis of three replicates yielded Kb =1.2 (± 0.45) × 104, s =0.74 (± 0.04), Df=3.3 (± 0.24)×10-4 Cm2 S-1, and Db=8.5 (± 0.94) × 10-6 Cm2 S-1.
Cytotoxicity effects of the OFL and OZC on cancer cell lines
In order to find out the OFL and OZC have a general cytotoxic and/or specific cytotoxic effect, three cell lines from variety of tissue sources were selected. In this study we used the SKNMC cell line that is a neuroepithelioma cell and derived from a metastatic supra-orbital human brain tumor, Caco-2 cell line that is a continuous line of heterogeneous human epithelial colorectal adenocarcinoma cells, and MCF-7 that is derived from breast adenocarcinoma.
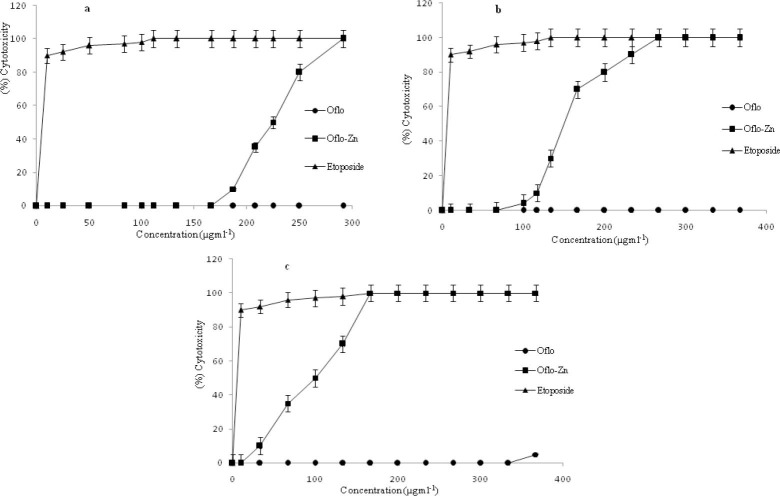
Therefore, we studied in-vitro anti proliferative and cytotoxic effects of OFL and OZC against these three cell lines, by Trypan blue and LDH assay methods. The results were shown in Figs. 9a-9c. On the basis of obtained results, after 72 h of incubation, the OFL and OZC significantly reduced the viability of three cell lines at different concentrations compared with the control group, and these effects became stronger when we increased the time of incubation. On the other hand, the studied cytotoxicity treatments resulted in a dose and time-dependent manner. Furthermore, the observed results from effective concentrations of OFL and OZC were accompanied with differences for various cancer cell lines.
Fig. 9.
Cytotoxic effects of ofloxacin and ofloxacin-zinc complex on: a; MCF-7, b; Caco2, and c; SKNMC cell lines after 72 h treatment.
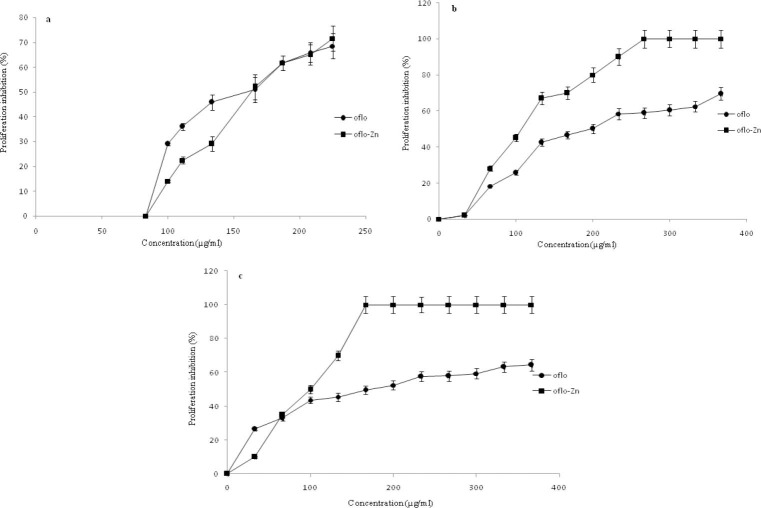
In other words the cytotoxic effects of OZC on MCF-7 cell line were considerably lower than this effect on the cell lines. To examine the influence of OFL and OZC on cancer cell proliferation, the cells were treated with increasing concentrations for 72 h. The results were shown in Figs. 10a-10c. The obtained data of counting by a Coulter counter showed that OFL and OZC induced inhibition of cell proliferation, resulting in a considerable reduction in cell growth by increasing the dose as compared with the control group.
Fig. 10.
Antiproliferative effects of ofloxacin and ofloxacin-zinc complex on: a; MCF-7, b; Caco2, and c; SKNMC cell lines after 72 h treatment.
The results revealed that the OFL and OZC inhibited viability of SKNMC and Caco-2 cell lines at 33 μg mL-1 significantly, while this effect for cell line MCF-7 occurred at higher concentrations (100 μg mL-1).
The IC50 values of OFL and OZC (the concentration required for 50% viability inhibition) is shown in Table 1. In agreement with 50% inhibition of cell proliferation (the concentration of the compounds that is required for half maximal inhibition), the order of sensitivity of the cell lines to OZC was SKNMC>CaCo2>MCF-7. In general, SKNMC, CaCo2 and MCF-7 cell lines exhibited both decreasing viability and proliferation in a dose and time-dependent manner under experimental conditions. In other words, the OZC has more effect on SKMNC cell lines compared to other two cell lines.
DISCUSSION
Today, it is well established that the structural modifications of fluoroquinolones may be responsible for the transformation of an antibacterial into an anticancer agent (64). The cytotoxic effects of fluoroquinolones are based on systematic structural modifications of canonical antibacterial fluoroquinolones (11).
According to this fact that the DNA-binder drugs often exhibit cytotoxic properties, the fluoroquinolone structures have been manipulated in order to yield more efficient DNA binders. Therefore, the pyrazoloquinoline, quinobenzoxazine, and pyridobenzophenoxazine derivatives have been synthesized as DNA intercalators (65) and some of which exhibited excellent in vitro cytotoxic activity against broad cancer cell lines (66). Additionally the metal complexes of fluoroquinolones are considered as other DNA binders. In this regards the role of metal ions in the biological activities and also interaction at DNA are well established. For example some fluoroquinolones–copper complexes (such as ciprofloxacin, levo-floxacin, gatifloxacin and ofloxacin) have been exhibited high affinity towards DNA binding (67,68,69,70) and biological activity, while some Mn2+ and Al3+-fluoroquinolone complexes (such as norfloxacin, sparfloxacin) have shown moderate or poor biological activity and DNA affinities (14,71).
In addition, the complexes of ciprofloxacin and norfolxacin with Zn2+ ion have shown a high potential of cytotoxic and antibacterial activity (12,63). These may be due to the higher affinities towards the DNA. However, our results indicated that the OZC may interact with DNA via electrostatic and outside hydrogen binding and this may support the greater in-vitro cytotoxicity of OZC compared to OFL alone. The observed hypochromism (258, 292 nm) and one isosbestic point (298 nm) in the absorption spectra are indicative of interaction of OZC with ct-DNA (72).
These observations contrast with previous reports by Shen and coworkers, in which one fluoroquinolon molecule such as ofloxacin binds preferentially to the single-stranded DNA. When DNA was paired, binding of ofloxacin was weak and exhibited no base preference (73). Our results, however, show a strong interaction between OZC and ct-DNA. Fluorescence spectra are extremely sensitive to the environment of fluorophore. After adding DNA, changes were apparent in both the shape and intensity of the emission spectrum of OZC at 497 nm.
In addition to the hypochromism in the absorption spectrum, changes in the fluorescence emission spectrum strongly indicated an interaction between OZC and DNA. The equilibrium binding constant and the number of binding sites in base pairs, which is equivalent to the Stern Volmer quenching constant in the static quenching mechanism, was obtained from the slope and intercept of the plot of log (F0- F)/F versus log [Q] and calculated to be 8.16 (± 0.85) × 103 and 0.53, respectively.
The value of n approximately equal to 0.5, suggest that there were 2 classes of binding sites for OZC towards DNA. The aforementioned FT-IR results can be discussed in terms of preferential sites of binding between DNA and OZC in solution at pH=7.3. The FT-IR data confirm interaction of OZC with bases and backbone phosphate, although the data establish some concentration ratio-dependent differences.
As shown in the result section, the appearances of the CD spectrum of ct-DNA were changed when interacted with OZC. This observation provides evidence that both the electrostatic and the outside binding of OZC occur at the DNA. This study shows that OZC undergoes oxidation and reduction at a HMDE. The oxidation and reduction of OZC is a combination of reversible and irreversible process and occurs in a single step. Using cyclic voltammetry the formation of OZC-DNA complex was detected.
The higher cytotoxic effects of OZC on MCF-7, Caco-2 and SKNMC cell lines in comparison with the free OFL revealed a different mechanism of action than the general mechanism of fluoroquinolones on the bacterial type II topoisomerases DNA gyrase and topoisomerase IV. In agreement with this study, our study shows that DNA binding could be considered as one of the underlying mechanisms..
CONCLUSION
The results revealed that the synthesized OZC can bind to ct-DNA with two modes of electrostatic and outside hydrogen binding. A strong interaction happened between OZC and ct-DNA. The interaction of OZC with ct-DNA is an exothermal reaction. A significant immobilization of ct-DNA and OZC occurred involving outside hydrogen binding that results in a negative ΔS. Also, the negative ΔH may arise from the electrostatic interactions. The fluorescence quenching of OZC by ct-DNA showed that this is a static quenching procedure. The OZC interacted with backbone phosphate and outside binding which caused a transform of B-DNA to A-DNA. The in vitro anti proliferative and cytotoxic effects of OFL and OZC revealed that OZC exhibited better anti proliferative and cytotoxic activities in comparison with the OFL alone. The results indicated the OFL interact with DNA via a different mode in comparison with. Taking all together, we concluded that the metal-fluoroquinolones complexes interact more with DNA in comparison with the free fluoroquinolones and therefore have more therapeutic effects.
ACKNOWLEDGMENTS
We gratefully acknowledge Vice Chancellor for Research and Technology of Kermanshah University of Medical Sciences for the financial support of this project. This work was performed in partial fulfillment of the requirements for a Pharm. D thesis by Neda Ebrahimi-Dishabi at the Faculty of Pharmacy, Kermanshah University of Medical Sciences, Kermanshah, Iran.
REFERENCES
- 1.Baraldi PG, Bovero A, Fruttarolo F, Preti D, Tabrizi MA, Pavani MG, et al. DNA minor groove binders as potential antitumor and antimicrobial agents. Medic Res Rev. 2004;24:475–528. doi: 10.1002/med.20000. [DOI] [PubMed] [Google Scholar]
- 2.Denny WA. DNA minor groove alkylating agents. Current Med Chem. 2001;8:533–544. doi: 10.2174/0929867003373283. [DOI] [PubMed] [Google Scholar]
- 3.Nelson SM, Ferguson LR, Denny WA. Non-covalent ligand/DNA interactions: Minor groove binding agents. Mut Res. 2007;623:24–40. doi: 10.1016/j.mrfmmm.2007.03.012. [DOI] [PubMed] [Google Scholar]
- 4.Kashanian S, Gholivand MB, Ahmadi F, Taravati A, Hosseinzadeh Colagar A. DNA interaction with Al–N,N-bis(salicylidene) 2,2-phenylendiamine complex. Spectrochim Acta A. 2007;67:472–478. doi: 10.1016/j.saa.2006.08.017. [DOI] [PubMed] [Google Scholar]
- 5.Ahmadi F, Alizadeh AA, Shahabadi N, Rahimi-Nasrabadi M. Study binding of Al–curcumin complex to ds-DNA, monitoring by multi spectroscopic and voltammetric techniques. Spectrochim Acta A. 2011;79:1466–1474. doi: 10.1016/j.saa.2011.05.002. [DOI] [PubMed] [Google Scholar]
- 6.Cross JT. Fluoroquinolones. Seminars in Pediatric Infectious Diseases. 2001;12:211–223. [Google Scholar]
- 7.Mitscher LA. Bacterial topoisomerase inhibitors: quinolone and pyridone antibacterial agents. Chem Rev. 2005;105:559–592. doi: 10.1021/cr030101q. [DOI] [PubMed] [Google Scholar]
- 8.Riahi S, Ganjali MR, Bagheri M. Theoretical investigation of interaction between Gatifloxacin and DNA: Implications for anticancer drug design. Mat Sci Engin C. 2009;29:1808–1813. [Google Scholar]
- 9.Ling X, Zhong W, Huang Q, Ni K. Spectroscopic studies on the interaction of pazufloxacin with calf thymus DNA. J Photochem Photobio B. 2008;93:172–176. doi: 10.1016/j.jphotobiol.2008.07.008. [DOI] [PubMed] [Google Scholar]
- 10.Sheng Z, Cao X, Peng Sh, Wang Ch, Li Q, Wang Y, et al. Ofloxacin induces apoptosis in micro-encapsulated juvenile rabbit chondrocytes by caspase-8-dependent mitochondrial pathway. Toxic Appl Pharm. 2008;226:119–127. doi: 10.1016/j.taap.2007.08.025. [DOI] [PubMed] [Google Scholar]
- 11.Foroumadi A, Ghodsi Sh, Emami S, Najjari S, Samadi NA, Faramarzi M, et al. Synthesis and antibacterial activity of new fluoroquinolones containing a substituted N-(phenethyl) piperazine moiety. Bioorg Med Chem Lett. 2006;16:3499–3503. doi: 10.1016/j.bmcl.2006.03.103. [DOI] [PubMed] [Google Scholar]
- 12.Patel M, Chhasatia M, Parmar P. Antibacterial and DNA interaction studies of with quinolone family member, ciprofloxacin. Europ J Med Chem. 2010;45:439–446. doi: 10.1016/j.ejmech.2009.10.024. [DOI] [PubMed] [Google Scholar]
- 13.Patel MN, Joshi HN, Patel ChR. DNA interaction, in-vitro antimicrobial and SOD-like activity of copper (II) complexes with norfloxacin and terpyridines. J Organomet Chem. 2012;701:8–16. [Google Scholar]
- 14.Batista DGJ, da Silva PB, Stivanin L, Lachter DR, Silva RS, Felcman J, et al. Co(II), Mn(II) and Cu(II) complexes of fluoroquinolones: Synthesis, spectroscopical studies and biological evaluation against Trypanosomacruzi. Polyhedron. 2011;30:1718–1725. [Google Scholar]
- 15.Sandstrom K, Warmlander S, Leijon M, Graslund A. 1H NMR studies of selective interactions of norfloxacin with double-stranded DNA. Biochem Biophys Res Commun. 2003;304:55–59. doi: 10.1016/s0006-291x(03)00504-7. [DOI] [PubMed] [Google Scholar]
- 16.Wiles JA, Wang Q, Lucien E, Hashimoto A, Song Y, Cheng J, et al. Isothiazoloquinolones containing functionalized aromatic hydrocarbons at the 7-position: synthesis and in-vitro activity of a series of potent antibacterial agents with diminished cytotoxicity in human cells. Bioorg Med Chem Lett. 2006;16:1272–1276. doi: 10.1016/j.bmcl.2005.11.065. [DOI] [PubMed] [Google Scholar]
- 17.Pfeiffer ES, Hiasa H. Replacement of ParC α4 helix with that of GyrA increases the stability and cytotoxicity of topoisomerase IV-quinolone-DNA ternary complexes. Antimicrob Age Chemother. 2004;48:608–611. doi: 10.1128/AAC.48.2.608-611.2004. [DOI] [PMC free article] [PubMed] [Google Scholar]
- 18.Pansuriya PB, Patel MN. Synthesis, spectral, thermal, DNA interaction and antimicrobial properties of novel Cu(II) heterochelates. Appl Organomet Chem. 2007;21:739–749. [Google Scholar]
- 19.Mouton Y, Leroy O. Ofloxacin. Inter J Antimicrob Age. 1991;1:57–74. doi: 10.1016/0924-8579(91)90001-t. [DOI] [PubMed] [Google Scholar]
- 20.Macıas B, Villa MV, Rubio I, Castin eiras A, Borras J. Complexes of Ni(II) and Cu(II) with ofloxacin, crystal structure of a new Cu(II) ofloxacin complex. J Inorg Biochem. 2001;84:163–170. doi: 10.1016/s0162-0134(01)00182-9. [DOI] [PubMed] [Google Scholar]
- 21.Lee DS, Han HJ, Kim K, Park WB, Cho JK, Kim JH. Dissociation and complexation of fluoroquinolone analogues. J Pharmaceut Biomed Anal. 1994;12:157–164. doi: 10.1016/0731-7085(94)90025-6. [DOI] [PubMed] [Google Scholar]
- 22.Patel MN, Gandhi DS, Parmar PA. DNA interaction and in-vitro antibacterial studies of fluoroquinolone based platinum (II) complexes. Inorg Chem Commun. 2012;15:248–251. [Google Scholar]
- 23.Chen C, Chen K, Long Q, Ma M, Ding F. Structural characterization and DNA-binding properties of Sm (III) complex with ofloxacin using spectroscopic methods. Spectroscopy. 2009;23:103–111. [Google Scholar]
- 24.Akinremi CA, Obaleye JA, Amolegbe SA, Adediji JF, Bamigboye MO. Biological activities of some Fluoroquinolones-metal complexes. Inter J Med Biomed Res. 2012;1:24–34. [Google Scholar]
- 25.Turel I, Kljun J, Perdih F, Morozova E, Bakulev V, Kasyanenko N, et al. First ruthenium organometallic complex of antibacterial agent ofloxacin. crystal structure and interactions with DNA. Inorg Chem. 2010;49:10750–10752. doi: 10.1021/ic101355d. [DOI] [PMC free article] [PubMed] [Google Scholar]
- 26.Obaleye JA, Akinremi CA, Balogun EA, Adebayo JO, Omotowa B. Synthesis, characterisation, antimicrobial and toxicological studies of some metal complexes of norfloxacin and ofloxacin. Centre point (Sci Edit) 2010;16:37–56. [Google Scholar]
- 27.Drevensek P, Kosmrlj J, Giester G. X-Ray crystallographic, NMR and antimicrobial activity studies of magnesium complexes of fluoro quinolones–racemic ofloxacin and its S-form, levofloxacin. J Inorg Biochem. 2006;100:1755–1763. doi: 10.1016/j.jinorgbio.2006.06.011. [DOI] [PubMed] [Google Scholar]
- 28.Vieira LMM, de Almeida MV, Lourenço MCS, Bezerra FAFM, Fontes APS. Synthesis and antitubercular activity of palladium and platinum complexes with fluoroquinolones. Europ J Med Chem. 2009;44:4107–4111. doi: 10.1016/j.ejmech.2009.05.001. [DOI] [PubMed] [Google Scholar]
- 29.Shaikh AR, Giridhar R, Megraud F, Ram Yadav M. Metalloantibiotics: Synthesis, characterization and antimicrobial evaluation of bismuth-fluoroquinolone complexes against Helicobacter pylori. Acta Pharm. 2009;59:259–271. doi: 10.2478/v10007-009-0027-6. [DOI] [PubMed] [Google Scholar]
- 30.Sagdinca S, Bayarý S. Spectroscopic studies on the interaction of ofloxacin with metals. J Mol Struc. 2004;691:107–113. [Google Scholar]
- 31.Macias B, Villa MV, Sastre M, Castiñeiras A, Borras J. Complexes of Co(II) and Zn(II) with ofloxacin. Crystal structure of (Co(oflo)2(MeOH)2]·4MeOH. J Pharm Sci. 2002;91:2416–2423. doi: 10.1002/jps.10234. [DOI] [PubMed] [Google Scholar]
- 32.Ahmadi F, Alizadeh AA, Bakhshandeh-Saraskanrood F, Jafari B, Khodadadian M. Experimental and computational approach to the rational monitoring of hydrogen-bonding interaction of 2-Imidazolidinethione with DNA and guanine. Food Chem Toxicol. 2010;48:29–36. doi: 10.1016/j.fct.2009.09.010. [DOI] [PubMed] [Google Scholar]
- 33.Singh R, Jadeja RN, Thounaojam MC, Patel T, Devka RT, Chakraborty D. Synthesis, DNA binding and antiproliferative activity of ternary copper complexes of moxifloxacin and gatifloxacin against lung cancer cells. Inorg Chem Commun. 2012;23:78–84. [Google Scholar]
- 34.Elia MC, Storer RD, Harmon LS, Kraynak AR, McKelvey TW, Hertzog PR, et al. Cytotoxicity as measured by trypan blue as a potentially confounding variable in the in-vitro alkaline elution/rat hepatocyte assay. Mutat Res Environ Mut Related Sub. 1993;291:193–205. doi: 10.1016/0165-1161(93)90159-w. [DOI] [PubMed] [Google Scholar]
- 35.Linford NJ, Dorsa DM. 17 β-Estradiol and the phytoestrogen genistein attenuate neuronal apoptosis induced by the endoplasmic reticulum calcium-ATPase inhibitor thapsigargin. J Steroids. 2002;67:1029–1040. doi: 10.1016/s0039-128x(02)00062-4. [DOI] [PubMed] [Google Scholar]
- 36.Mosmann T. Rapid colorimetric assay for cellular growth and survival: application to proliferation and cytotoxicity assays. J Immunol Methods. 1993;65:55–63. doi: 10.1016/0022-1759(83)90303-4. [DOI] [PubMed] [Google Scholar]
- 37.Kashanian S, Askari S, Ahmadi F, Omidfar K, Ghobadi S, Abasi Tarighat F. In-vitro study of DNA interaction with clodinafop-propargyl herbicide. DNA Cell Biol. 2008;27:581–586. doi: 10.1089/dna.2008.0740. [DOI] [PubMed] [Google Scholar]
- 38.Ahmadi F, Jamali N, Moradian R, Astinchap B. Binding studies of pyriproxyfen to DNA by multi spectroscopic atomic force microscopy and molecular modeling methods. DNA Cell Biol. 2012;31:259–268. doi: 10.1089/dna.2011.1303. [DOI] [PubMed] [Google Scholar]
- 39.Turel I. The interactions of metal ions with quinolone antibacterial agents. Coord Chem Rev. 2002;232:27–47. [Google Scholar]
- 40.Sadeek SA. Synthesis, thermogravimetric analysis, infrared, electronic and mass spectra of Mn(II), Co(II), and Fe(III) norfloxacin complexes. J Mol Struc. 2005;753:1–12. [Google Scholar]
- 41.Nakamoto K. New York: Wiley; 1986. Infrared and raman spectra of inorganic and coordination compounds; pp. 169–184. [Google Scholar]
- 42.Deacon GB, Phillips RJ. Relationships between the carbon-oxygen stretching frequencies of carboxylate complexes and the type of carboxylate coordination. Coord Chem Rev. 1980;33:227–250. [Google Scholar]
- 43.Ligia Maria M, Vieira A, Mauro V, de Almeida A, Maria Cristina SM, Lourenço Flavio Augusto FM, et al. Fontes Synthesis and antitubercular activity of palladium and platinum complexes with fluoroquinolones. Europ J Med Chem, 2009;44:4107–4111. doi: 10.1016/j.ejmech.2009.05.001. [DOI] [PubMed] [Google Scholar]
- 44.Nakabayashi Y, Watanabe Y, Nakao T, Yamauchi O. Interactions of mixed ligand ruthenium(II) complexes containing an amino acid and 1,10-phenanthroline with DNA. Inorg Chim Acta. 2004;357:2553–2560. [Google Scholar]
- 45.Mudasir WK, Tri Wahyuni E, Inoue H, Yoshioka N. Base-specific and enantioselective studies for the DNA binding ofiron(II) mixed-ligand complexes containing 1,10-phenanthrolineand dipyrido(3,2-a:2’,3’-c) phenazine. Spectrochim Acta A. 2007;66:163–170. doi: 10.1016/j.saa.2006.02.037. [DOI] [PubMed] [Google Scholar]
- 46.Chaires JB. A thermodynamic signature for drug-DNA binding mode. Arch Biochem Biophys. 2006;453:26–31. doi: 10.1016/j.abb.2006.03.027. [DOI] [PubMed] [Google Scholar]
- 47.Sun D, Xu X, Liu M, Sun X, Zhang J, Li L, et al. Microcalorimetric and spectrographic studies on the interaction of DNA with betaxolol. Inter J Pharm. 2010;386:165–171. doi: 10.1016/j.ijpharm.2009.11.015. [DOI] [PubMed] [Google Scholar]
- 48.Kashanian S, Heidary Zeidali S, Omidfar K, Shahabadi N. Multi-spectroscopic DNA interaction studies of sunset yellow food additive. Mol Biol Rep. 2012;39:10045–10051. doi: 10.1007/s11033-012-1873-8. [DOI] [PubMed] [Google Scholar]
- 49.Ghosh KS, Sahoo BK, Jana D, Dasgupta S. Studies on the interaction of copper complexes of (-)-epicatechin gallate and (-)-epigallocatechin gallate with calf thymus DNA. J Inorg Biochem. 2008;102:1711–1718. doi: 10.1016/j.jinorgbio.2008.04.008. [DOI] [PubMed] [Google Scholar]
- 50.Lakowicz JR. second ed. New York: PlenumPress; 1999. Principles of Fluorescence Spectroscopy; pp. 237–265. [Google Scholar]
- 51.Zhang YZ, Zhou B, Zhang XP, Huang P, Li CH, Liu Y. Interaction of malachite green with bovine serum albumin: determination of the binding mechanism and binding site by spectroscopic methods. J Hazard Mater. 2009;163:1345–1352. doi: 10.1016/j.jhazmat.2008.07.132. [DOI] [PubMed] [Google Scholar]
- 52.Lakowicz JR, Weber G. Quenching of fluorescence by oxygen. Probe for structural fluctuations in macromolecules. Biochimie. 1973;12:4161–4170. doi: 10.1021/bi00745a020. [DOI] [PMC free article] [PubMed] [Google Scholar]
- 53.Shakir M, Azam M, Parveen S, Khan AU, Firdaus F. Synthesis and spectroscopic studies on complexes of N, N0-bis-(2-pyridinecarboxaldimine)-1, 8- diaminonaphthalene (L); DNA binding studies on Cu(II) complex. Spectrochim Acta A. 2009;71:1851–1856. doi: 10.1016/j.saa.2008.07.002. [DOI] [PubMed] [Google Scholar]
- 54.Cao Y, He XW. Studies of interaction between safranine T and double helix DNA by spectral methods. Spectrochim Acta A. 1998;54:883–892. doi: 10.1016/s1386-1425(97)00277-1. [DOI] [PubMed] [Google Scholar]
- 55.Ahmadi F, Jamali N. Study of DNA-deltamethrin binding by voltammetry, competitive fluorescence, thermal denaturation, circular dichroism, and atomic force microscopy techniques. DNA Cell Biol. 2012;31:811–819. doi: 10.1089/dna.2011.1442. [DOI] [PubMed] [Google Scholar]
- 56.Su Son G, Yeo JA, Kim MS, Kim SK, Holmen A, kerman BA, et al. Binding mode of norfloxacin to calf thymus DNA. J Am Chem Soc. 1998;120:6451–6457. [Google Scholar]
- 57.Selvakumar B, Rajendiran V, Uma Maheswari P, Stoeckli-Evans H, Palaniandavar M. Structures, spectra, and DNA-binding properties of mixed igand copper(II) complexes of iminodiacetic acid: The novel role of diimine co-ligands on DNA conformation and hydrolytic and oxidative double strand DNA cleavage. J Inorg Biochem. 2006;100:316–330. doi: 10.1016/j.jinorgbio.2005.11.018. [DOI] [PubMed] [Google Scholar]
- 58.Ahmadi F, Bakhshandeh-Saraskanrood F. Simultaneous determination of ultra trace of uranium andcadmium by adsorptive cathodic stripping voltammetry using H-point standard addition method. Electroanalysis. 2010;22:1207–1216. [Google Scholar]
- 59.Abbasi Sh, Sohrabi A, Naghipour A, Gholivand MB, Ahmadi F. Determination of ultra trace amounts of uranium (vi) by adsorptive stripping voltammetry using L-3-(3, 4-dihydroxy phenyl)alanine as a selective complexing agent. Anal Lett. 2008;41:1128–1143. [Google Scholar]
- 60.Hosseinzadeh L, Abassi Sh, Ahmadi F. Adsorptive cathodic stripping voltammetry determination of ultra trace of lead in different real samples. Anal Lett. 2007;40:2693–2707. [Google Scholar]
- 61.Gholivand MB, Ahmadi F, Sohrabi A. Adsorptive stripping voltammetric determination of ultra trace of zinc and lead with carbidopa as complexing agent in food and water samples. Electroanalysis. 2007;19:2465–2471. [Google Scholar]
- 62.Ahmadi F, Jafari B. Voltammetry and spectroscopy study of in-vitro interaction of fenitrothion with DNA. Electroanalysis. 2011;23:675–682. [Google Scholar]
- 63.Ahmadi F, Saberkari M, Abiri R, Mohammadi-Motlagh H. In-vitro Evaluation of Zn–norfloxacin complex as a potent cytotoxic and antibacterial agent, proposed model for DNA binding. Appl Biochem Biotech. 2013;170:988–1009. doi: 10.1007/s12010-013-0255-6. [DOI] [PubMed] [Google Scholar]
- 64.Ahmadi F, Jahangard-Yekta S, Heidari-Moghadam A, Aliabadi AR. Application of two-layer ONIOM for studying the interaction of N-substituted piperazinylfluoroquinolones with ds-DNA. Comput Theor Chem. 2013;1006:9–18. [Google Scholar]
- 65.Sissi C, Palumbo M. The Quinolone Family: From Antibacterial to Anticancer Agents. Curr Med Chem. 2003;3:439–450. doi: 10.2174/1568011033482279. Anti-Cancer Agents. [DOI] [PubMed] [Google Scholar]
- 66.Clement JJ, Burres N, Jarvis K, Chu DT, Swiniarski J, Alder J. Biological Characterization of a Novel Antitumor Quinolone. Cancer Res. 1995;55:830–835. [PubMed] [Google Scholar]
- 67.Hernández-Gil J, Perelló L, Ortiz R, Alzuet G, González-Álvarez M, Liu-González M. Synthesis, structure and biological properties of several binary and ternary complexes of copper(II) with ciprofloxacin and 1,10 phenanthroline. Polyhedron. 2009;28:138–144. [Google Scholar]
- 68.Feio MJ, Pereira E, Gameiro P, Sousa I, Claro V, Lino Pereira J, et al. Synthesis, characterization and antibacterial studies of a copper(II) levofloxacin ternary complex. J Inorg Biochem. 2012;110:64–71. doi: 10.1016/j.jinorgbio.2012.02.003. [DOI] [PubMed] [Google Scholar]
- 69.Patel MN, Parmar PA, Gandhi DS. Square pyramidal copper(II) complexes with forth generation fluoroquinolone and neutral bidentate ligand: Structure, antibacterial, SOD mimic and DNA-interaction studies. Bioorg Med Chem. 2010;18:1227–1235. doi: 10.1016/j.bmc.2009.12.037. [DOI] [PubMed] [Google Scholar]
- 70.Živec P, Perdih F, Turel I, Giester G, Psomas G. Different types of copper complexes with the quinolone antimicrobial drugs ofloxacin and norfloxacin: Structure, DNA- and albumin-binding. J Inorg Biochem. 2012;117:35–47. doi: 10.1016/j.jinorgbio.2012.08.008. [DOI] [PubMed] [Google Scholar]
- 71.Alkaysi HN, Abdel-Hay MH, Sheikh Salem M, Gharaibeh AM, Na’was TE. Chemical and microbiological investigations of metal ion interaction with norfloxacin. Inter J Pharm. 1992;87:73–77. [Google Scholar]
- 72.Su Son G, Yeo JA, Kim MS, Kim SK, Holmen A, Akerman B, et al. Binding mode of norfloxacin to calf thymus DNA. J Am Chem Soc. 1998;120:6451–6457. [Google Scholar]
- 73.Shen LL, Baranowski J, Pernet AG. Mechanism of inhibition of DNA gyrase by quinolone antibacterials: specificity and cooperativity of drug binding to DNA. Biochemistry. 1989;28:3879–3885. doi: 10.1021/bi00435a038. [DOI] [PubMed] [Google Scholar]


