Abstract
Background and Objective:
Bone mineral density measurements with absorptiometry dual-energy X-ray absorptiometry (DXA) is the gold standard for diagnosing low bone mass and risk for fragility fractures. DXA is not available at every center, and physicians require an alternative method of diagnosis before referring patients. We conducted this study to assess and compare total cortical thickness (TCT) and its relation to the T score by DXA and its correlation-ship in the diagnosis of osteoporosis.
Patients and Methods:
Total cortical thickness was carried out in 50 Saudi Arabian females ≥ 45 years with DXA scans and 25 patients with age of ≤ 35 years whose radiographs of the upper tibia were available for analysis. Postero-medial cortical thickness of the tibia was measured 13 cm from the joint line and an average was calculated. The average T score of the spine and the hip was taken. A comparison was made between age, T score, and the TCT. Inter cortical distance (ICD) was measured and compared in both groups. Data were analyzed for predictive value for diagnosis of osteopenia and osteoporosis.
Results:
There was a significant association between the T score and the TCT and age. As the age advanced the T score and TCT was very low (<0.05, 95% confidence interval [CI] <0.2). Forty patients were osteopenic and 10 osteoporotic. The T score in the former was − 1.33 ± 0.71 and the later was − 3.22 ± 0.56 (P < 0.0001 95% CI: <−1.67) and the TCT was 0.655 ± 0.06 versus 0.51 ± 0.05 (P < 0.0001 95% CI: <−0.17). In women ≤35 years the average TCT was 0.804 ± 0.155 cm and IMD was 3.34 ± 0.45 cm.
Conclusions:
We conclude that if TCT is less than the threshold value of ≤ 0.5 cm, patients should be referred for further investigations with DXA. We believe that further studies are needed to confirm our findings and in areas where DXA is not available, based on the TCT measurement anti-osteoporotic therapy could be initiated when other risk factors for osteoporosis is present.
Keywords: Dual-energy X-ray absorptiometry diagnosis, osteoporosis, tibial cortical thickness
INTRODUCTION
Low bone mass (Osteopenia and Osteoporosis) is common in the Saudi Arabian population, and dual-energy X-ray absorptiometry (DXA) is the gold standard for diagnosis of osteoporosis. DXA is still not available in many clinics, and even primary health care centers where majority of the elderly population go for their age-related ailments. As the DXA is unavailable many such patients with osteoporosis is missed and end up with fragility fractures, increasing the morbidity and mortality.
Before the evolution of the DXA, osteoporosis was diagnosed by way of plain radiographs, based on analysis of the trabecular pattern in the upper femur and calcaneum or cortical thinning of metacarpals and long bones.[1,2,3,4]
Barnett and Nordin,[1] reported that accurate measurements can be made on standard radiographs of the femur, the second metacarpal bone and the spine. But for the long bones, medial and lateral cortices are thickest point, hence can be utilized.[5,6,7] Bloom[8] suggested that a combined cortical thickness at the humeral site was significantly superior to the metacarpal sites in the diagnosis of osteoporosis.
It is well established that weight bearing exercise increased bone mineral density (BMD) and cortical thickness[9] and studies have shown that influence of cortical bone on fracture risk is significant.[10,11,12,13] We believe that an assessment of cortical bone on a weight bearing long bone could be the ideal area to be assessed for predicting osteoporosis and fragility fractures. The objective of this study is to compare the total cortical thickness (TCT) and DXA and find any correlation exists.
PATIENTS AND METHODS
The data collected for each patient included age, sex, radiographs and DXA records from the picture archiving and communication system (syngo. plaza - Siemens Healthcare, USA). Plain radiographs of the antero-posterior and lateral views of the tibia were available for analysis with DXA (Hologic, Waltham, MA, USA). Two measurements were taken of the medial and the posterior cortex of the tibia from 13 cm from the joint line with a precision of 0.1 mm [Figures 1 and 2]. The average of the two measurements was taken and termed as tibial cortical thickness. For the comparison, average measurements of T score of the Hip and spine were taken. Intra-cortical width and TCT was measured at 13 cm in the antero-posterior view in patients of ≤35 years who had a preexisting radiograph of the tibia in the syngo.plaza - Siemens Healthcare, USA - System. ICD was measured in both groups at 13 cm from the top of the tibia.
Figure 1.
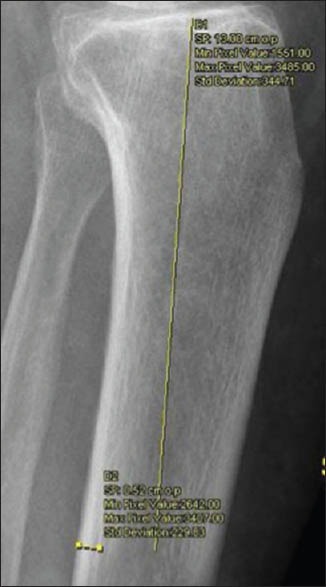
Measurement of medial tibial cortical thickness
Figure 2.
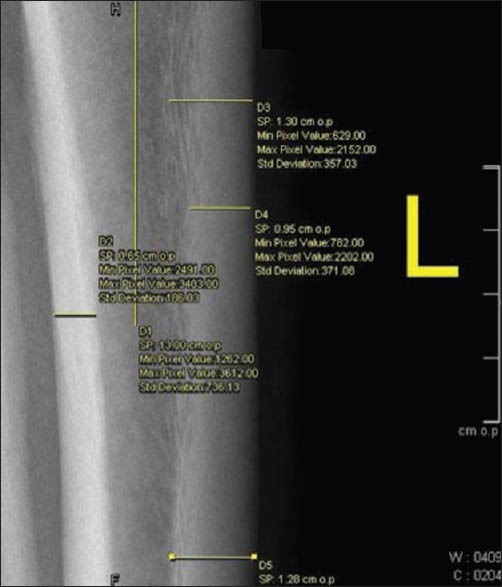
Measurement of posterior tibial cortical thickness
Data analyses were performed with SPSS software, version 19.0 (SPSS, Chicago, IL, USA). TCT was plotted against average of DXA and Pearson correlation coefficients were obtained. Pearson correlation coefficients are reported to suggest the strength of the relationship between TCT and the average DXA.
RESULTS
The average age of patients was 61.3 ± 10.2 years. Patients were divided into four groups ≤50, 51–60, 61–70 and over 70 years [Table 1]. There was a significant association between the T score and the TCT and age. As the age advanced, the T score and TCT was very low (<0.05, 95% confidence interval [CI] <0.2). Table 2 gives a comparison between the control group of patients ≤ 35 years and the study group ≥50 years. The difference between patients below ≤35 and ≥50 years was significant for both parameters at P value for TCT <0.001 CI 95% <0.2264 and IMW was <0.001 CI 95% <0.8233. Forty patients were osteopenic and 10 osteoporotic. The T score in the former was −1.33±0.71 and the later was -3.22 ± 0.56 (P < 0.0001 95% CI <−1.67) and the TCT was 0.655 ± 0.06 versus 0.51 ± 0.05 (P < 0.0001 95% CI <−0.17) [Table 3]. Pearson correlation coefficients between the TCT values and the T scores by DXA showed the value of R was 0.77. This is a strong positive correlation, which means that high X variable scores go with high Y variable scores and vice versa. A value of R2, the coefficient of determination was 0.59 [Figure 3].
Table 1.
Comparison of TCT and T score between four groupss
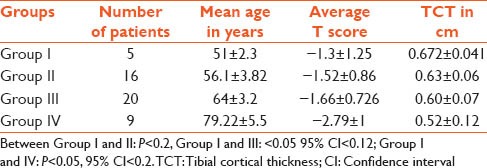
Table 2.
Analysis of Tibial; Cortical Thickness and ICD between the patients ≤35 and ≥50 years
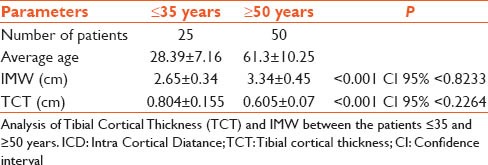
Table 3.
TCT in patients with osteopenia and osteoporosis

Figure 3.
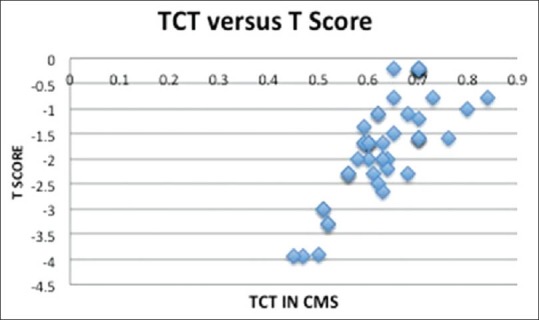
Pearson correlation coefficients between the total cortical thickness values and the T scores by dual-energy X-ray absorptiometry
DISCUSSION
Our study has shown that on the basis of plain radiographs of the tibia, a diagnosis of osteopenia and osteoporosis could be made easily. Despite global drive and growing awareness, osteoporosis remains under-diagnosed till it presents with fragility fracture. DXA remains the gold standard screening tool, but, unfortunately, it is not available in all the centers especially in developing the world. Hence there is a need of a way by which diagnosis of osteoporosis could be made, and treatment started and referred to centers where DXA is available. Prior to DXA scanning, physicians would rely either on analyzing trabecular patterns of proximal femur and calcaneum or cortical thinning of metacarpals and long bones.[1,2,3,4]
Recent advances in digital technology with better precision had given rise to renewed interest in understanding the co-relation between cortical thickness. Mather et al.[14] measured cortical thickness of the proximal humerus in plain radiograph and found strong co-relation with DXA. Similarly, Tingart et al.[15] concluded measurement of cortical thickness of the proximal humerus is reproducible and a thickness <4 mm is highly indicative of low BMD.
In the current study, we select to study postero-medial thickness of the tibia as it is a weight bearing bone that should better correlate prediction of osteoporosis. Studies of El Maghraoui and Roux[16] on human subjects noted that the lumber and femur measures of osteoporosis may not fully represent osteoporosis in upper limb.
Our technique of cortical thickness measurement involves a combined thickness of posterior and medial cortex and dividing it with a mean diameter of the bone (calculated in antero-posterior and lateral view). It differs from the technique of Virtama and Telkka[2] as early as 1962, defined cortical index of humeral shaft as cortical thickness divided by bone diameter. They found a significant correlation between cortical index and bone density estimated from the dry weight of bone.
In the present study, Pearson correlation coefficients between the TCT values and the T scores by DXA showed a strong positive correlation. We found that if the TCT is <0.5 cm the chances of low BMD are very high. Interobserver and intraobserver measurement of TCT in our study showed excellent reliability and reproducibility. This may be attributed to the selection of posterior and medial cortex of tibia 13 cm distal to the knee joint line where cortex is homogenous, dense and well delineated due to stress of weight bearing.
Our study suggests that digital radiographs of elderly patients who visit clinics where DXA is not available a plain radiograph will be enough to diagnosis osteoporosis by way of TCT. TCT is a simple, reproducible and reliable adjunctive test and can be a useful test to stratify patients who may need further investigations for osteoporosis. Besides, this technique may help to understand the quality of bone and the information can be employed in preoperative planning of surgical technique and implant selection in trauma victims with fracture of lower extremity.
Importance of cortical thickness was first reported by Barnett and Nordin in the year 1960.[1] Meema and Meema[6] later found that, a combined cortical thickness (medial and lateral cortex) of the distal humerus below 6 mm was shown to be abnormally low and strongly indicative of osteoporosis. Cheung et al.[17] utilized peripheral quantitative computed tomography scan to measure cortical thickness and found a significant co-relation with BMD.
Our study has few limitations as a pilot study there is a small number of patients belonging to the same ethnicity and defined geographical area. Secondly a larger prospective study is required for further validation. We conclude that if TCT is less than the threshold value of ≤ 0.5 cm, the likelihood of a significant decrease in bone density is very high, and such patients should be referred for further investigations with DXA. We further believe that more studies are needed in the future with large sample to confirm our findings, which could be implemented in routine use, in areas where DXA is not available.
Footnotes
Source of Support: Nil
Conflict of Interest: None declared.
REFERENCES
- 1.Barnett E, Nordin BE. The radiological diagnosis of osteoporosis: A new approach. Clin Radiol. 1960;11:166–74. doi: 10.1016/s0009-9260(60)80012-8. [DOI] [PubMed] [Google Scholar]
- 2.Virtama P, Telkka A. Cortical thickness as an estimate of mineral content of human humerous and femur. Br J Radiol. 1962;35:632–3. doi: 10.1259/0007-1285-35-417-632. [DOI] [PubMed] [Google Scholar]
- 3.Singh M, Nagrath AR, Maini PS. Changes in trabecular pattern of the upper end of the femur as an index of osteoporosis. J Bone Joint Surg Am. 1970;52:457–67. [PubMed] [Google Scholar]
- 4.Sadat-Ali M, El-Hassan AY, Ibrahim EM, Al-Frehi H, Al-Muhanna F. Postmenopausal osteoporosis in Saudi women: A pilot screening. Ann Saudi Med. 1993;13:272–4. doi: 10.5144/0256-4947.1993.272. [DOI] [PubMed] [Google Scholar]
- 5.Bloom RA, Laws JW. Humeral cortical thickness as an index of osteoporosis in women. Br J Radiol. 1970;43:522–7. doi: 10.1259/0007-1285-43-512-522. [DOI] [PubMed] [Google Scholar]
- 6.Meema HE, Meema S. Measurable roentgenologic changes in some peripheral bones in senile osteoporosis. J Am Geriatr Soc. 1963;11:1170–82. doi: 10.1111/j.1532-5415.1963.tb02689.x. [DOI] [PubMed] [Google Scholar]
- 7.Morgan DB, Spiers FW, Pulvertaft CN, Fourman P. The amount of bone in the metacarpal and the phalanx according to age and sex. Clin Radiol. 1967;18:101–8. doi: 10.1016/s0009-9260(67)80137-5. [DOI] [PubMed] [Google Scholar]
- 8.Bloom RA. A comparative estimation of the combined cortical thickness of various bone sites. Skeletal Radiol. 1980;5:167–70. doi: 10.1007/BF00347258. [DOI] [PubMed] [Google Scholar]
- 9.Nilsson M, Ohlsson C, Sundh D, Mellström D, Lorentzon M. Association of physical activity with trabecular microstructure and cortical bone at distal tibia and radius in young adult men. J Clin Endocrinol Metab. 2010;95:2917–26. doi: 10.1210/jc.2009-2258. [DOI] [PubMed] [Google Scholar]
- 10.Mazess RB. Fracture risk: A role for compact bone. Calcif Tissue Int. 1990;47:191–3. doi: 10.1007/BF02555918. [DOI] [PubMed] [Google Scholar]
- 11.Ritzel H, Amling M, Pösl M, Hahn M, Delling G. The thickness of human vertebral cortical bone and its changes in aging and osteoporosis: A histomorphometric analysis of the complete spinal column from thirty-seven autopsy specimens. J Bone Miner Res. 1997;12:89–95. doi: 10.1359/jbmr.1997.12.1.89. [DOI] [PubMed] [Google Scholar]
- 12.Bell KL, Loveridge N, Power J, Garrahan N, Meggitt BF, Reeve J. Regional differences in cortical porosity in the fractured femoral neck. Bone. 1999;24:57–64. doi: 10.1016/s8756-3282(98)00143-4. [DOI] [PubMed] [Google Scholar]
- 13.Greenspan SL, Maitland-Ramsey L, Myers E. Classification of osteoporosis in the elderly is dependent on site-specific analysis. Calcif Tissue Int. 1996;58:409–14. doi: 10.1007/BF02509439. [DOI] [PubMed] [Google Scholar]
- 14.Mather J, MacDermid JC, Faber KJ, Athwal GS. Proximal humerus cortical bone thickness correlates with bone mineral density and can clinically rule out osteoporosis. J Shoulder Elbow Surg. 2013;22:732–8. doi: 10.1016/j.jse.2012.08.018. [DOI] [PubMed] [Google Scholar]
- 15.Tingart MJ, Apreleva M, von Stechow D, Zurakowski D, Warner JJ. The cortical thickness of the proximal humeral diaphysis predicts bone mineral density of the proximal humerus. J Bone Joint Surg Br. 2003;85:611–7. doi: 10.1302/0301-620x.85b4.12843. [DOI] [PubMed] [Google Scholar]
- 16.El Maghraoui A, Roux C. DXA scanning in clinical practice. QJM. 2008;101:605–17. doi: 10.1093/qjmed/hcn022. [DOI] [PubMed] [Google Scholar]
- 17.Cheung AM, Adachi JD, Hanley DA, Kendler DL, Davison KS, Josse R, et al. High-resolution peripheral quantitative computed tomography for the assessment of bone strength and structure: A review by the Canadian Bone Strength Working Group. Curr Osteoporos Rep. 2013;11:136–46. doi: 10.1007/s11914-013-0140-9. [DOI] [PMC free article] [PubMed] [Google Scholar]


