

SUMMARY
Reprogramming somatic cells to induced pluripotency by Yamanaka factors is usually slow and inefficient, and is thought to be a stochastic process. We identified a privileged somatic cell state, from which acquisition of pluripotency could occur in a non-stochastic manner. Subsets of murine hematopoietic progenitors are privileged, whose progeny cells predominantly adopt the pluripotent fate with activation of endogenous Oct4 locus after 4–5 divisions in reprogramming conditions. Privileged cells display an ultrafast cell cycle of ~8 hours. In fibroblasts, a subpopulation cycling at a similar ultrafast speed is observed after 6 days of factor expression, and is increased by p53-knockdown. This ultrafast-cycling population accounts for >99% of the bulk reprogramming activity in wildtype or p53-knockdown fibroblasts. Our data demonstrate that the stochastic nature of reprogramming can be overcome in a privileged somatic cell state, and suggest that cell cycle acceleration toward a critical threshold is an important bottleneck for reprogramming.
INTRODUCTION
Somatic cells can be reprogrammed into pluripotency by expression of defined transcription factors (Lowry et al., 2008; Park et al., 2008; Takahashi et al., 2007; Takahashi and Yamanaka, 2006; Wernig et al., 2007). Although most cell types can be reprogrammed, this dramatic cell fate conversion occurs only at low frequency following long latency, even when all cells are engineered to express the reprogramming factors (Carey et al., 2010; Stadtfeld and Hochedlinger, 2010; Wernig et al., 2008). The prevailing theory for this low efficiency and long latency is a stochastic model, which calls upon stochastic changes to help subvert the various barriers limiting the fate transitions (reviewed in (Hanna et al., 2010; Stadtfeld and Hochedlinger, 2010; Yamanaka, 2009)). Mathematic modeling suggests the existence of a single major bottleneck event, although additional non rate-limiting events may also exist (Hanna et al., 2009; Hanna et al., 2010; Smith et al., 2010; Stadtfeld and Hochedlinger, 2010; Yamanaka, 2009). However, the nature of such a bottleneck event has not been clearly defined.
Although the reprogramming behavior of many cell types follow a stochastic model, it is possible that rare and/or transient somatic cells may exist in a post-bottleneck state and can progress toward reprogramming in a non-stochastic manner. We term such putative post-bottleneck somatic cells the privileged cells for reprogramming. Owing to the absence of the rate-limiting stochastic events, these somatic cells should display certain unique reprogramming behaviors (Figure 1): a privileged somatic cell should produce progeny that mainly progress toward pluripotency rather than adopting alternative cell fates; their progeny should transition into pluripotency rapidly in a largely synchronous fashion. Figure 1 depicts the key differences between privileged and stochastic reprogramming. Identification of a post bottleneck cell state would help define the nature of the stochastic events restricting Yamanaka reprogramming.
Figure 1. Comparison between stochastic and privileged reprogramming.
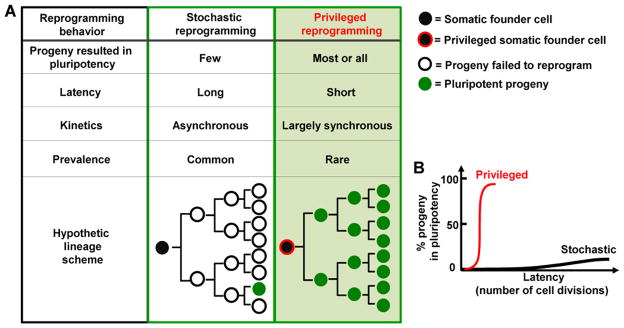
(A) Hypothetic cell lineages with respect to the somatic founder cells and pluripotent progeny. The number of cell generations depicted is for illustration purpose and does not represent the actual situations. (B) Contrasting stochastic and privileged reprogramming with regard to their efficiency and latency.
In this study, we provide evidence for the existence of privileged somatic cells and describe a key feature of the privileged cell state is an unusually fast cell cycle. The fast cycling cells could exist naturally or be induced from fibroblasts by Yamanaka factors and are responsible for essentially all reprogramming activities. Our data suggest a modified view for the role of cell cycle regulation in reprogramming, and refine the conventional stochastic versus elite models of reprogramming.
RESULTS
Non-stochastic reprogramming from a subpopulation of bone marrow GMP cells
To identify the existence of privileged somatic cells, we first took a live-cell imaging approach, with which the behaviors of single cells can be faithfully tracked with high resolution (Megyola et al., 2013). We focused on the well-defined granulocyte monocyte progenitors (GMP) since they support rapid and efficient reprogramming (Eminli et al., 2009; Megyola et al., 2013), and are more likely to contain privileged cells. Specifically, GMPs from mice that carry both Rosa26:rtTA and Oct4:GFP alleles were used as source cells for reprogramming (FACS-sorting scheme in Figure S1B), so that activation of endogenous Oct4 locus can be detected as green fluorescence in live cells. The Yamanaka factors were introduced by a doxycycline (Dox) inducible polycistronic lentivirus (Carey et al., 2009), so that factor expression could be initiated by adding Dox, with image acquisition starting about one hour later (time required to calibrate the imaging system). The reprogramming cultures were imaged at 5–15 minute intervals for ~five days, when Oct4:GFP+ cells display typical features of mouse pluripotent cells. These Oct4:GFP+ cells, although still Dox-dependent, progress with reprogramming highly efficiently (Table S1) without any obvious bottleneck restrictions, reaching a pluripotent state that can support chimeric mice formation and germline transmission (Megyola et al., 2013).
Using this imaging approach, we mapped the entire fate transition process from single founder GMPs to Oct4:GFP+ progeny (Movie S1, Figure S1A, Figure 2A), and constructed 14 successfully reprogrammed cell lineages from 5 independent experiments. Strikingly, these reprogrammed GMP lineages displayed a behavior that is consistent with features of the privileged state (Figure 1). All live progeny from these GMPs turned on Oct4:GFP, yielding multiple sister colonies with homogeneous Oct4:GFP fluorescence (Movie S1). No progeny retained hematopoietic appearance or became “stuck” in intermediate steps, which is prevalent in the stochastic reprogramming systems (Chen et al., 2013; Mikkelsen et al., 2008). Since we added Dox within one hour of imaging, and that it would take time before factor expression amounted to significant levels, we could ascertain with good confidence that the initial somatic cell state was captured in the imaging process. Taken together, live-cell imaging at single-cell resolution supports that some GMPs exist in a privileged state (Figure 2A, Figure S1A and Movie S1).
Figure 2. Non-stochastic reprogramming from a subset of GMPs.

(A) A representative lineage map from a single GMP to Oct4:GFP+ progeny. The color of the circles corresponds to the color of arrows in Movie S1 and Figure S1A. Lines denote lineage relationship. Filled green circles denote Oct4:GFP fluorescence as detectible by time-lapse imaging. The numbers (hours:minutes) at each branching point indicate the time when mitosis occurred and were used to derive cell cycle lengths. Red blocks on the horizontal block arrow indicate reporter signals of a G1 phase reporter (see Figure S2 and Movie S2). (B) GMPs were transduced with Dox-inducible Yamanaka factors and single cell sorted into 96-well plates in reprogramming conditions (scheme in Figure S5A). Representative images of the reprogramming product of a single GMP are shown. Note the presence of multiple sister colonies and many of the round-shaped cells in the vicinity of Oct4:GFP+ colonies are also GFP+ (zoom in, red arrows). (C) GMP and LKS cells from H2B-GFP mice were reprogrammed as single cells. Representative images of the reprogramming culture from a single GMP (top row) or LKS cell (bottom row) after 6 days of Dox induction are shown. Note the presence of H2B-GFP+, alkaline phosphatase (AP) negative cells in LKS-initiated culture, but not in the GMP-initiated culture. Slight increase in colony sizes was noted after fixation/staining. (D) GMP-initiated reprogramming culture were trypsinized after 6 days of Dox-induction and stained with a CD45 antibody. A representative FACS plot shows that CD45+ hematopoietic cells and Oct4:GFP+ cells make up ~97% of the culture. (E) The number of mitotic divisions before Oct4:GFP became detectible by imaging (n=38). See also Figures S1, S2, S5A, Table S1 and Movies S1, S2.
To further validate that a subset of GMPs are privileged, factor transduced GMPs were FACS sorted as single cells into 96-well plates to achieve clonal reprogramming (experimental scheme in Figure S5A). When 420 total wells were examined after 5 days of Dox induction, 71 wells (17%) gave rise to Oct4:GFP+ colonies. The majority of wells (97%) positive for Oct4:GFP+ colonies did not contain noticeable numbers of cells bearing hematopoietic morphology (Figure 2B), confirming our observation that most progeny became reprogrammed using the imaging approach (Movie S1). Many of these wells contained multiple sister colonies with small numbers of round-shaped cells (also Oct4:GFP+) in close proximity to the larger colonies (Figure 2B), which we have described previously to result from the dynamic migrative behavior associated with pluripotency (Megyola et al., 2013). To ensure all GMP-derived cells were scored, we repeated single cell reprogramming with GMPs from a transgenic mouse line that expresses an H2B-GFP fusion protein (Hadjantonakis and Papaioannou, 2004), so that all progeny could be identified based on their expression of H2B-GFP (Figure S1C). In wells that contained GMP-derived colonies, all H2B-GFP+ cells were part of or close to mESC-like colonies and positive for alkaline phosphatase activity (Figure 2C, upper panel). In contrast, single lineage−Kit+Sca+ HSPCs (referred to as LKS cells, sorting strategy in Figure S1B) gave rise to many H2B-GFP+ cells that scattered away from the colonies and were negative for alkaline phosphatase activity (Figure 2C, lower panel). These data from clonal reprogramming conditions indicate that a subset of GMPs produce essentially all-reprogrammed progeny.
To further ensure all GMP-derived progeny were analyzed, including some that might have adopted alternative cell fate, we trypsinized the entire reprogramming culture initiated from GMPs and assessed the complete cellular constituents by FACS on day 6 of factor expression. We used a pan hematopoietic marker, CD45, to mark the somatic cell state and Oct4:GFP for the pluripotent state. Consistent with the observation that the progeny of 17% of GMPs all turned on Oct4:GFP+, the entire culture was largely binary consisting of two major populations: the CD45+ hematopoietic cells and the Oct4:GFP+ reprogrammed cells (Figure 2D, Figure S1D). These two populations accounted for ~97% of all cells in the culture with the remaining 3% likely being the feeder cells as indicated by their non-characteristic scattering profile (Figure S1D). This analysis demonstrates that alternative cell fates are not prevalent in GMP-initiated reprogramming.
Another anticipated feature of non-stochastic reprogramming is a synchronous short latency, which could be reflected as either the number of cell divisions or amount of time preceding endogenous pluripotency activation (Figure 1B). We assessed these parameters using the imaging data and found that most of these progeny (85%, total n=38) activated endogenous Oct4 after 4 to 5 cell divisions (Figure 2E). The remaining 15% of events took 6 or 7 cell divisions, but not more. Expressed in absolute amount of time, all progeny became Oct4:GFP+ (detectible by fluorescence microscopy) within 46.0±6.8 hours (n=38), indicating a largely uniform fast kinetics. Importantly, this latency is highly consistent among the 14 GMP lineages obtained across five experiments. These results support the privileged nature of the founder GMPs, and demonstrate that Yamanaka reprogramming could occur much more rapidly and synchronously than previously appreciated (Hanna et al., 2009).
Taken together, the data above demonstrate that a subset of GMPs exist as privileged cells for Yamanaka reprogramming.
Privileged GMPs display an ultrafast cell cycle
We next asked whether the privileged cells display any unusual characteristics. We examined the live-cell imaging data, quantified the timing of events in the GMP-initiated reprogramming lineages and noticed that the first cell cycle (defined as the time between the first and second mitotic divisions from the initial cells, diagram in Figure S1A, Figure 2A) on average took only ~8 hours (Figure 3A). In contrast, a typical mammalian cell cycle lasts 16–24 hours or longer (Lodish et al., 2000). mESCs and iPSCs display one of the fastest cell cycles which lasts ~12 hours owning to a truncated G1 phase (Hanna et al., 2010; Wang and Blelloch, 2009). Thus, it was striking that the first cell cycle during privileged reprogramming was even substantially faster than that of mESCs. The three subsequent cell cycles were also fast, but became increasingly longer and stabilized at the speed of ~12 hours per cycle (Figure 3A). Using a cell cycle phase reporter (Sakaue-Sawano et al., 2008), we observed a short G1 duration (~2 hours) for the first cell cycle (Figure 3B, Movie S2, Figure S2). This data suggest that G1 shortening underlies the fast cell cycle. Importantly, since this ultrafast cycle occurred within the first 10 hours of Dox addition and the subsequent cycles actually lengthened when factors were continued to be induced (Figure 3A), the fast cycling property should be intrinsic to the subset of GMPs and independent from Yamanaka factors. Indeed, ~20% of all GMPs examined (n=54) display such an ultrafast cell cycle. Thus, privileged GMPs are associated with an ultrafast initial cell cycle.
Figure 3. Privileged GMPs display an ultrafast cell cycle.

(A) Cell cycle lengths of successfully reprogrammed GMP lineages. Each dot represents a mitotic event which gave rise to Oct4:GFP+ cells. More dots were scored for cell cycles 2 and 3 due to cell number increase following previous divisions. Within the same imaging experiments, the first cell cycle of random GMPs (n=54) was also measured. Pooled data of 14 lineages from 5 independent imaging experiments are shown. *p<0.001. (B) A G1 phase reporter was used to measure G1 duration by time-lapse imaging. Each dot represents a mitotic event that gave rise to Oct4:GFP+ cells. (C) Representative FACS plots of GMPs immediately after CFSE label (top) and following 24 hours of dye dilution (bottom). The gating strategy for sorting fast and slow cycling cells is shown. (D) The fast and slow cycling GMPs were single cell sorted into 96-well plates in reprogramming conditions. The number of wells that contained Oct4:GFP+ colonies and the total number of plated wells are indicated, separated by a slash. See also Figures S2, S3, Table S2 and Movie S2.
If privileged GMPs are distinguished by an ultrafast cell cycle, one would predict that prospectively isolated faster cycling GMPs reprogram with higher efficiency than their slower cycling counterparts. To test this, we fractionated GMPs based on their cell cycle speed using a dye dilution approach (Koche et al., 2011; Takizawa et al., 2011). Specifically, GMPs were labeled with a stable dye CFSE and the number of divisions each cell experienced was indicated by the remaining amount of dye after proliferation-based dye dilution (Figure S3). Thus, the cells that retained the least amount of dyes represented the most rapidly cycling cells (Figure 3C). With this strategy, we sorted factor-transduced GMPs into CFSE-low and CFSE-high single cells (representing relatively fast and slow cycling GMPs, respectively) (Figure 3C), and compared their reprogramming efficiency (Figure 3D). The fast-cycling GMPs reprogrammed with higher efficiency than the slower cycling ones (Figure 3D, Table S2A–B). To rule out the possibility that this difference was due to the cycling status affecting viral transduction (even though lentivirus infect both cycling and quiescent cells), we confirmed this finding using GMPs from a mouse strain harboring a knock-in cassette of the same polycistron (referred to as the iPS mouse) (Carey et al., 2010) (Table S2C). Taken together, the data above support that privileged GMPs are associated with an ultrafast cell cycle, and the subpopulation of faster cycling GMPs reprogram more efficiently.
Accelerating hematopoietic progenitor cell cycling increases reprogramming efficiency and induces the emergence of privileged cells
The unusual cell cycle speed associated with privileged GMPs raises the possibility that the ultrafast cell cycle represents a path to overcome the bottleneck restricting reprogramming. We reasoned that, for a cell that cycles slowly and reprograms inefficiently, increasing its cycling speed may enhance its reprogramming and privileged cells could be potentially induced. LKS cells cycle slowly and contain much fewer ultrafast cycling cells as compared to GMPs (Figure 4A black bars, Figure S4, Table S3). Accordingly, LKS cells reprogrammed with much lower (7.6-fold) efficiency than GMPs in single cell reprogramming assays (Figure 4B black bars and Table S4), consistent with a previous report (Eminli et al., 2009). Importantly, LKS cells mostly reprogrammed in a stochastic manner, i.e. single LKS cells gave rise to both reprogrammed cells and substantial numbers of non-reprogrammed cells (Figure 2C, bottom panel).
Figure 4. Accelerating HSPC cycling increases reprogramming efficiency and induces the emergence of privileged cells.

(A) The cell cycle speed of LKS and GMP cells were measured, either fresh (black bars) or after 5 days of culture (red bars). The percentage of cells with indicated cell cycle speed is plotted (details in Extended Experimental Procedures and Figure S4). Note that fresh GMPs and cultured LKS cells contain ultrafast cycling cells (red boxes), which were low/absent in fresh LKS cells and cultured GMPs. (B) The reprogramming efficiency of fresh or cultured LKS and GMP cells were compared in single cell reprogramming assays. The number of wells that contained Oct4:GFP+ colonies and the total number of plated wells are indicated, separated by a slash. (C) Singly sorted LKS cells were cultured for 5 days and its somatic progeny transferred into reprogramming conditions for another 5 days (scheme shown in Figure S5B). Shown is one representative well dominated by Oct4:GFP+ colonies and lacked hematopoietic-like cells. ~15% of the wells containing Oct4:GFP+ colonies (or 3.6% of total wells) displayed this privileged reprogramming behavior. Images were captured with 10x magnification. See also Figures S4, S5 and Tables S3, S4.
While the fast cycling of GMPs is required to sustain rapid tissue turn over, stem cells remain largely quiescent to sustain lifelong tissue homeostasis and injury repair and only begin cycling in response to proper cues (Greco and Guo, 2010). Thus we tested whether culturing LKS cells in growth factors/cytokines increases the ultrafast cycling cells (Figure S4). Indeed, after 5 days of culture, an ultrafast cycling population (>16%) emerged from the LKS culture to a level even higher than freshly isolated GMPs (Figure 4A red bars). In contrast, GMPs cultured under the same condition resulted in a drastic loss of the ultrafast cells (Figure 4B, red bars). We then tested the reprogramming efficiency of these cultured cells in the stringent clonal reprogramming assay (scheme in Figure S5B). As a comparison, the transduced LKS or GMP cells from the same experiment were single cell sorted and reprogrammed directly without pre-culture (scheme in Figure S5A). Consistent with the increase in the ultrafast cycling population, cultured LKS cells became highly efficient (24.3%) in reprogramming, more so than the freshly isolated GMPs (18.3%) (Figure 4B red bars, Table S4). In addition, the drastic decrease of the ultrafast cycling population in cultured GMPs was accompanied by a steep drop of reprogramming efficiency to 0.5% (Figure 4B). These data indicate that changes in cycling speed parallel the changes in reprogramming efficiency.
The cultivation turned a single LKS cell into tens to hundreds of cells (scheme in Figure S5B). Sampling a pool of the mixed progeny from many LKS cells revealed ultrafast cycling behavior in a fraction of them (Figure 4A). It is conceivable that if the ultrafast cycling behavior is shared by the daughters of a common LKS cell, privileged reprogramming might occur simultaneously from the many daughter cells. To test this, we transferred the somatic progeny from single LKS cells into reprogramming conditions (Figure S5B). After 5 days of Dox induction, we observed the astounding appearance of privileged reprogramming (Figure 4C, Table S4). In ~15% of the wells that contained Oct4:GFP+ colonies (or 3.6% of total wells), hematopoietic-like cells were absent. Instead, numerous Oct4:GFP+ colonies dominated these wells. Again, we confirmed that all progeny were accounted for by using clonal LKS cells from the H2B-GFP transgenic mice (Figure S5C–D). As such, reprogramming from these somatic cells was no longer a slow or rare event, but instead fast and prevalent. These wells provide further validation for the existence and unique behavior of privileged cells. Thus, mitogenic activation of the slowly cycling LKS cells increased the ultrafast cycling population as well as their reprogramming efficiency. This activation also induced the emergence of privileged cells for reprogramming.
Ultrafast cycling cells emerge from fibroblasts after prolonged factor induction and harbor the majority of reprogramming activity
To extend our finding of the ultrafast cycling cells in the hematopoietic system, we examined reprogramming from mouse embryonic fibroblasts (MEFs). Since it is well established that MEFs reprogram with low efficiency (~0.1%) and long latency (>8 days), we did not anticipate a substantial fraction of MEFs naturally cycle at the ultrafast speed. Instead, we asked whether an ultrafast cycling population can be induced by Yamanaka factors. Since MEFs do not proliferate well at clonal density, we estimated their cycling speed following a similar dye dilution approach (Figure S3). Specifically, we transduced MEFs with the Dox-inducible factors and added Dox to induce their expression. On day 4 of Dox treatment, the cultures were trypsinized, labeled with CFSE and plated back in the presence of Dox to allow the dye to be diluted for 2 additional days (Figure S6A). This time frame was chosen based on the observation that >7 days of Dox induction led to the appearance of a small percentage of Oct4:GFP+ cells (although Oct4:GFP+ colonies were not visible at this time), while 6 days of Dox treatment yielded no such cells (Figure S6B). Consistent with MEFs being a more heterogeneous population, the CFSE peak immediately following dye labeling was wider than that of hematopoietic progenitors (compare Figure 5A and Figure 3C). Strikingly, a small population of cells (1–8%) that retained much less CFSE emerged after a total of 6 days of Dox treatment (Figure 5A, red box). In contrast, such a population was not observed in the absence of Dox from the same transduced MEFs (Figure S6C), indicating that the CFSE-low population was induced by factor expression. The mean CFSE fluorescence intensity for this minor population was at least 20-fold less than that of the bulk cells, suggesting the fast cells had undergone on average 4 more divisions than the bulk MEFs. Given the bulk MEFs divide every 25–30 hours (Sage et al., 2000; Wang et al., 2001; White and Dalton, 2005), and would divide on average once to twice during 48 hours, the CFSE-low cells must have undergone ~5–6 divisions during the 48 hours of dye dilution period. This estimation suggests that some of the CFSE-low cells had divided at a speed close to 8 hours per cycle. Thus, an ultrafast cycling population emerges from MEFs in the presence of prolonged factor expression.
Figure 5. Ultrafast cycling cells emerge from fibroblasts after Yamanaka factor expression and harbor the majority of reprogramming activity.

Factor transduced MEFs were treated with Dox for 4 days, labeled with CFSE and allowed for dye-dilution for 48 hours in the presence of Dox. (A) The levels of CSFE in non-labeled MEFs (negative), right after labeling (post-label), or following 48 hours of dilution (post-dilution) are shown. The gates for fast, medium (med) and slow cycling cells are shown. Note that the fluorescence intensity difference between fast and medium populations indicates >4 division (div.) differences. (B) Reprogramming efficiency of cells sorted on CFSE. Oct4:GFP+ colonies were scored on day 20 from initial Dox induction (n=3 per condition, error bars indicate standard deviation). (C) Representative images of the reprogramming cultures from cells of different cycling speed. Phase and Oct4:GFP images were captured at 10x magnification and alkaline phosphatase (AP) stained dishes were from whole 60mm plates. See also Figure S6.
We then asked whether the ultrafast cycling cells are more efficient in reprogramming. Cells of three different CFSE levels (reflecting different cycling speed) were FACS-sorted and their reprogramming efficiencies compared. Due to their poor ability to endure clonal culture and overall low reprogramming efficiency, we were unable to perform clonal reprogramming assays with MEFs. Instead, we used the generally-adopted definition for reprogramming efficiency, which is the number of Oct4:GFP+ colonies divided by the number of cells plated. The fast-cycling cells displayed ~1150 fold increase in reprogramming efficiency as compared to the cells cycling at a medium speed characteristic of the bulk culture (Figure 5B–C). The slow populations completely lacked reprogramming activity (Figure 5B–C). Overall, we estimated that the minor but fast population contained ~99.7% of the reprogramming activity of the entire culture.
Taken together, an ultrafast cycling population was induced in MEF-initiated reprogramming after 6 days of factor expression. The reprogramming activity was exclusively confined to the rapidly cycling cells.
p53-knockdown expands the ultrafast cycling population, which harbors the majority of reprogramming activity among p53-knockdown MEFs
Although genetic perturbations that result in hastened proliferation have been well documented to increase reprogramming efficiency (Banito et al., 2009; Hong et al., 2009; Ruiz et al., 2011; Utikal et al., 2009), it remains unclear whether the role of cell cycle acceleration is to increase the number of daughter cells, each of which possesses an independent probability to reprogram, or to confer a higher probability selectively to a subset of cells to accomplish the fate transition.
To distinguish these two possibilities, we examined reprogramming in the context of p53 knockdown, which enhances reprogramming via a cell division-dependent mechanism (Hanna et al., 2009). Indeed, higher reprogramming efficiency occurred with p53 knockdown (Figure 6A–B). We then performed CFSE dilution assay to measure the ultrafast cycling fractions (Figure 6C). Consistent with a role of p53 in regulating cell cycle, p53 knockdown led to overall decreased CFSE level (i.e. increased cycling) among the bulk population, as evidenced by a shift of the main CFSE peak toward left (Figure 6C). As in control knockdown, a distinct fast cycling population retaining much less CFSE was clearly identifiable in p53-knockdown cells. Importantly, this fast cycling population increased with p53 knockdown as compared to the control (Figure 6C–D). These data indicate that p53-knockdown increases the number of cells cycling past a certain threshold speed.
Figure 6. The ultrafast cycling population from MEFs is increased by p53 knockdown and account for most reprogramming activity.
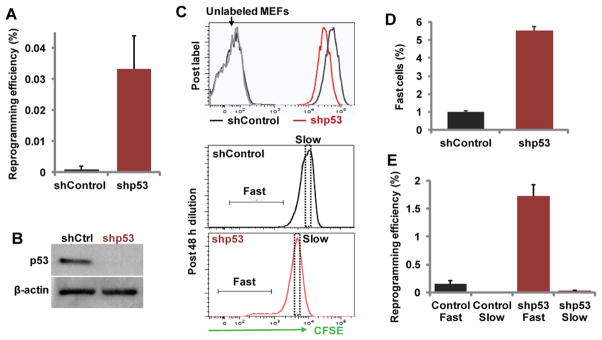
MEFs were transduced with either control (shCtrl) or shRNAs targeting p53 (shp53), along with the Dox-inducible reprogramming factors. (A) p53-knockdown increased reprogramming in un-fractionated MEFs. (B) Western blot analysis confirmed p53 protein down-regulation by p53-targeting shRNAs. (C–D) Factor-transduced MEFs on 4 days of Dox treatment were labeled with CFSE (top) and allowed to dilute the dye for another 48 hours. The cultures were then trypsinized and CFSE intensity analyzed by FACS. (C) Representative FACS plots are shown for CSFE levels right after labeling, or following 48 hours of dye-dilution. Gating for fast and slow cells are shown. (D) Quantification of fast cycling cells (n=3 per condition). (E) Reprogramming efficiency of the sorted fast and slow cycling MEFs as shown in (C) (n=3 per condition). Error bars indicate standard deviation.
We then asked whether reprogramming activity is confined within the fast-cycling population, or non-discriminatively in p53-knockdown cultures. With p53 knockdown, the great majority of the reprogramming activity was again confined to the fast cells, similar to the situation in controls (Figure 6E). These data demonstrate that p53 impacts reprogramming by controlling the emergence of the ultrafast cycling cells. Outside of the fast cycling population, however, other cells do not become more likely to reprogram. Taken together, our data suggest a model that cell cycle acceleration toward a critical threshold as an important bottleneck for reprogramming.
Molecular characterization confirms enhanced cell cycle as the predominant feature of a unique cell state
To gain insights into the molecular nature of the unique cell state associated with the extraordinary efficiency to transition into pluripotency, we performed transcriptome analysis by RNA sequencing (RNA-seq) (Pan et al., 2013). The transcriptomes of fast GMPs and the fast cells arising from MEFs after 6 days of Dox induction (referred to as “fast MEFs” from now on) were compared to slow GMPs, slow MEFs, bulk MEFs and established iPSCs. Principle component analysis (PCA) showed that biological replicates of the same cell states cluster in close proximity (Figure 7A). Furthermore and as expected, fast MEFs are enriched for genes associated with MEFs permissive to reprogramming, whereas the slow MEFs display signatures associated with MEFs refractory to reprogramming (Polo et al., 2012) (Figure S7A). These data indicate that our RNA-seq data are of good quality.
Figure 7. Molecular characterization of the cellular states.

(A) Principle Component Analysis (PCA) was performed on RNA sequencing data. Isolation of fast and slow cells was performed as described above. Dox-independent reprogrammed cells (iPS) and bulk MEFs (MEF) were included as controls. Three to five replicates were used for each cell type. (B) The endogenous Sox2 level was measured by qRT-PCR using primers specific for its 3′UTR region. Two biological replicates for each cell type are shown. (C) Gene Set Enrichment Analysis (GSEA) was performed comparing the fast cells (FastGMP and FastMEF) versus the slow cells (MEF and SlowMEF). The top 25 Gene Ontology (GO) categories enriched in both fast cell populations are shown. (D) qRT-PCR analysis of p57 mRNA level in HSPCs. (E) Western blot analysis confirms p57 protein down-regulation by p57 targeting shRNAs. (F) Reprogramming efficiency of LKS and GMP cells following treatment with control (shCtrl) or p57 targeting shRNAs (shp57). Error bars indicate standard deviation. See also Figure S7.
Activation of endogenous Sox2 was known to mark the beginning of the non-stochastic phase of reprogramming (Buganim et al., 2012). However, neither GMPs nor fast MEFs expressed endogenous Sox2, contrasting iPSCs (Figure 7B, Figure S7B). Thus, the fast cycling cells exist in a cell state earlier than that marked by endogenous Sox2 activation, indicating that the non-stochastic trajectory of reprogramming can be attained earlier than that demonstrated previously (Buganim et al., 2012).
The high reprogramming efficiency of both fast GMPs and fast MEFs implies that they may share certain molecular similarities that contribute to their unique reprogramming behavior, even though they are well separated on the PCA plot (Figure 7A). To identify such similarities, we performed Gene Set Enrichment Analysis (GSEA) comparing the fast populations with the bulk MEFs and the slow MEFs, which were similar in gene expression (Figure 7A). Strikingly, when all gene ontology (GO) categories were examined, those associated with enhanced cell proliferation appear to be the predominant feature (Figure 7C, Figure S7C). Other enriched GO categories reflect enhanced RNA transcription/processing and protein translation, which are consistent with molecular needs in association with fast cell cycle. Of note, enhanced cell cycle and protein translation were also enriched in fast GMPs as compared to slow GMPs albeit to a lesser extent (data not shown) due to their overall similarity in gene expression (Figure 7A). In addition to unbiased GSEA analysis, we also examined enrichment in mesenchymal-epithelial transition (MET), apoptosis and metabolism. Results show that fast GMPs and fast MEFs are depleted for mesenchymal signatures (Table S5). There is no consistent difference in apoptosis gene sets, whereas metabolism gene sets enriched in fast cells are predominantly related to nucleoside metabolism, again supporting a difference primarily in cell cycle (Table S5). These molecular analyses suggest that fast cell cycle is indeed the major attribute shared between the two cell states capable of high efficiency reprogramming. Loss of mesenchymal gene expression appears as an additional contributor, which is important in early reprogramming (Li et al., 2010; Samavarchi-Tehrani et al., 2010).
To further understand the molecular regulator(s) of the privileged cell state, we thus focused on cell cycle regulators, and asked which cell cycle genes are differentially expressed between LKS and GMP cells, which display drastically different cell cycle and reprogramming behaviors (Figure 4). We examined all expressed cyclins, cyclin dependent kinases (CDKs) and CDK inhibitors using published data (Krivtsov et al., 2006). The only gene that showed a major difference was Cdkn1c, or p57 (Figure S7D–F). p57 is a G1/S-blocking CDK inhibitor that was expressed >10 fold higher in the slow cycling LKS cells as compared to GMPs, a result confirmed by qRT-PCR (Figure 7D). We next tested whether reduced p57 promotes LKS cell reprogramming. We inhibited p57 expression by sequence specific shRNAs and confirmed down-regulation of the protein (Figure 7E). p57 shRNAs in LKS cells led to significantly higher reprogramming (Figure 7F, LKS), consistent with previous reports that loss of p57 leads to enhanced HSC cycling (Matsumoto et al., 2011; Zou et al., 2011). In contrast, similar treatment in GMPs did not yield further increase in reprogramming (Figure 7F, GMP), suggesting the endogenous p57 level in GMPs is already sufficiently low. These data support p57 as one of the molecular roadblocks limiting HSPCs to enter a privileged cell state.
DISCUSSION
We demonstrated that Yamanaka reprogramming could occur non-stochastically from a privileged somatic cell state. Our data support a model in which privileged and stochastic reprogramming co-exist as part of a continuum (Figure S7G). Since the privileged cell state is highly efficient in reprogramming, it might suggest an “elite” status. However, the privileged state differs from the conventional “elite” cells in several key aspects. First, the conventional “elite” model assigns different probability of reprogramming to different cells and assumes it as a fixed property (Hanna et al., 2009; Hanna et al., 2010; Yamanaka, 2009). Our model suggests the privileged state is rather dynamic, which could exist naturally but also be gained via alternative means. Yamanaka factors may facilitate the emergence of a similar state which could be viewed as an “acquired privilege”. Our data also suggest that the exact molecular means to reach a privileged state might be different in different cell types. Specifically, p57 prevents LKS cells to become privileged, but it is conceivable that other cell types may utilize alternative means to reach the extreme speed of cycling. Although inhibition of p57 in HSCs enhances their cycling (Matsumoto et al., 2011; Zou et al., 2011), MEFs deficient in p57 do not become overtly proliferative (Takahashi et al., 2000). Consistently, shRNA inhibition of p57 in MEFs resulted in no detectible increase in ultrafast cycling cells or iPS colony numbers (data not shown). Second, the conventional “elite” cells are considered for their ability to produce any pluripotent progeny without a specific latency. In contrast, our privileged cells produce essentially all pluripotent progeny with a synchronous short latency. Depending on when and which cells reach a privileged state (somatic or acquired) within a cell lineage, reprogramming could occur with varying efficiency and latency (Figure S7G). Privileged somatic cells represent an extreme case when the bottleneck is overcome prior to their exposure to Yamanaka factors.
One of the key features of the privileged cell state is an unusually fast cell cycle, a mechanism distinct from previously suggested ones, since GMPs are non-epithelial (Aasen et al., 2008; Li et al., 2010; Samavarchi-Tehrani et al., 2010), do not endogenously express any of the Yamanaka factors (Kim et al., 2008; Krivtsov et al., 2006; Wakao et al., 2011), are more differentiated than stem cells (Eminli et al., 2009; Stadtfeld and Hochedlinger, 2010) and do not have reduced MBD3 levels (Luo et al., 2013; Rais et al., 2013) (Figure S7H–J). The cellular states of naturally fast cycling somatic cells, such as GMPs, and those arise from MEFs in response to Yamanaka factors are drastically different (Figure 7A). However, the fact that both types of fast cycling cells display extraordinarily high reprogramming efficiency suggests that a fast cell cycle kinetic has a dominant role in determining how the epigenome responds to remodeling. A connection between cell cycle and fate outcome has been noted in other cellular systems (Kueh et al., 2013; Pauklin and Vallier, 2013; Pop et al., 2010; Tsunekawa et al., 2012). Detailed studies are required to reveal the connections linking cell cycle dynamics to epigenetic remodeling.
Although ultrafast cell cycle is a key feature of the privileged state and ultrafast cycling cells reprogram much more efficiently, we also notice that not all fast cycling cells become reprogrammed. A number of reasons, both biological and technical, could limit the observation of reprogramming even though the major bottleneck may have been overcome. Biologically, this may relate to proper establishment of E-cadherin mediated cell-cell adhesion (Chen et al., 2010; Li et al., 2010; Megyola et al., 2013; Redmer et al., 2011; Samavarchi-Tehrani et al., 2010) and optimal level or stoichiometry of continued factor expression (Carey et al., 2011; Papapetrou et al., 2009). Such events could impact a large number of cells that collectively reduce the overall reprogramming efficiency. Technically, although the CSFE dilution method greatly enriches for ultrafast cycling cells based on divisional history, it is not an absolute or instant measure of cell cycle speed. The resolving power of this method is heavily influenced by the inherent populational heterogeneity and the duration of dye dilution. This explains why much larger difference was seen between populations isolated from MEFs as compared to that between different GMPs (GMPs are more homogeneous and were allowed a shorter period for dye dilution). Defining the additional requirements for the ultrafast cycling cells to secure the transition into pluripotency will help further elucidating the mechanisms of reprogramming.
EXPERIMENTAL PROCEDURES
Mice and cells for reprogramming
All mouse work was approved by the Institutional Animal Care and Use Committee of Yale University. The Oct4:GFP x Rosa26:rtTA mice were derived by crossing Oct4:GFP mice with Rosa26:rtTA mice (Eminli et al., 2009; Megyola et al., 2013) and were used to isolate/derive hematopoietic cells, MEFs and ESCs. The iPS mouse (R26rtTA; Col1a14F2A) (Carey et al., 2010) (stock# 011004) and H2B-GFP transgenic line (stock# 006069) were purchased from the Jackson Laboratory.
Cell sorting, culture and reprogramming
Hematopoietic populations were sorted as previously (Guo et al., 2010). Hematopoietic growth factors included 100 ng/ml mSCF, 50 ng/ml mIL3, 50 ng/ml Flt3L and 50 ng/ml mTPO (PeproTech) and were added to a serum free base medium X VIVO15 (BioWhittaker). Reprogramming conditions included inactivated MEF feeders, complete mESC medium and 2 μg/ml of Dox (Sigma). CFSE was purchased from Life Technologies. A working concentration of 7.5–8 μM was used following manufacturer’s instruction. CFSE labeled GMPs after 24 hours of dye dilution were sorted for the brightest and dullest 15–20% of cells as slow and fast GMPs, respectively. CFSE labeled MEFs were cultured in mESC medium with Dox for 48 hours before sorting. MEFs cultured in the absence of Dox were used as controls.
Transcriptome analysis by RNA sequencing
1,000 of each cell types were directly sorted into lysis buffer in 96-well plates for RNA isolation. The mRNA selection and reverse transcription was performed as described previously with some modifications (Pan et al., 2013). Additional details are described in Extended Experimental Procedures. The data can be accessed at GEO database with accession number GSE53074.
Supplementary Material
HIGHLIGHTS.
Reprogramming occurs non stochastically from a privileged somatic cell state.
Subsets of granulocyte-monocyte progenitors (GMPs) are privileged.
Privileged GMPs cycle with an ultrafast speed: about 8 hours per cycle.
Cells of similar cycling speed are induced prior to reprogramming of fibroblasts.
Acknowledgments
This work was supported by NIH grants K01 DK082982 (to S.G.), R01CA149109 (to J.L.), P30 DK0724429 and R01 DK086267 (to D.S.K.), R01HL106184 (to P.G.G.), U54 CA143798 (to R.F.), P01GM099130 (to S.M.W.) the State of Connecticut (to J.L., R.F. and S.M.W.) and the Packard Fellowship for Science and Engineering (to R.F.).
Footnotes
Supplemental Information includes Extended Experimental Procedures, seven figures, five tables and two movies.
Publisher's Disclaimer: This is a PDF file of an unedited manuscript that has been accepted for publication. As a service to our customers we are providing this early version of the manuscript. The manuscript will undergo copyediting, typesetting, and review of the resulting proof before it is published in its final citable form. Please note that during the production process errors may be discovered which could affect the content, and all legal disclaimers that apply to the journal pertain.
References
- Aasen T, Raya A, Barrero MJ, Garreta E, Consiglio A, Gonzalez F, Vassena R, Bilic J, Pekarik V, Tiscornia G, et al. Efficient and rapid generation of induced pluripotent stem cells from human keratinocytes. Nat Biotechnol. 2008;26:1276–1284. doi: 10.1038/nbt.1503. [DOI] [PubMed] [Google Scholar]
- Banito A, Rashid ST, Acosta JC, Li S, Pereira CF, Geti I, Pinho S, Silva JC, Azuara V, Walsh M, et al. Senescence impairs successful reprogramming to pluripotent stem cells. Genes Dev. 2009;23:2134–2139. doi: 10.1101/gad.1811609. [DOI] [PMC free article] [PubMed] [Google Scholar]
- Buganim Y, Faddah DA, Cheng AW, Itskovich E, Markoulaki S, Ganz K, Klemm SL, van Oudenaarden A, Jaenisch R. Single-cell expression analyses during cellular reprogramming reveal an early stochastic and a late hierarchic phase. Cell. 2012;150:1209–1222. doi: 10.1016/j.cell.2012.08.023. [DOI] [PMC free article] [PubMed] [Google Scholar]
- Carey BW, Markoulaki S, Beard C, Hanna J, Jaenisch R. Single-gene transgenic mouse strains for reprogramming adult somatic cells. Nat Methods. 2010;7:56–59. doi: 10.1038/nmeth.1410. [DOI] [PMC free article] [PubMed] [Google Scholar]
- Carey BW, Markoulaki S, Hanna J, Saha K, Gao Q, Mitalipova M, Jaenisch R. Reprogramming of murine and human somatic cells using a single polycistronic vector. Proc Natl Acad Sci U S A. 2009;106:157–162. doi: 10.1073/pnas.0811426106. [DOI] [PMC free article] [PubMed] [Google Scholar]
- Carey BW, Markoulaki S, Hanna JH, Faddah DA, Buganim Y, Kim J, Ganz K, Steine EJ, Cassady JP, Creyghton MP, et al. Reprogramming factor stoichiometry influences the epigenetic state and biological properties of induced pluripotent stem cells. Cell Stem Cell. 2011;9:588–598. doi: 10.1016/j.stem.2011.11.003. [DOI] [PubMed] [Google Scholar]
- Chen J, Liu H, Liu J, Qi J, Wei B, Yang J, Liang H, Chen Y, Wu Y, Guo L, et al. H3K9 methylation is a barrier during somatic cell reprogramming into iPSCs. Nat Genet. 2013;45:34–42. doi: 10.1038/ng.2491. [DOI] [PubMed] [Google Scholar]
- Chen T, Yuan D, Wei B, Jiang J, Kang J, Ling K, Gu Y, Li J, Xiao L, Pei G. E-cadherin-mediated cell-cell contact is critical for induced pluripotent stem cell generation. Stem Cells. 2010;28:1315–1325. doi: 10.1002/stem.456. [DOI] [PubMed] [Google Scholar]
- Eminli S, Foudi A, Stadtfeld M, Maherali N, Ahfeldt T, Mostoslavsky G, Hock H, Hochedlinger K. Differentiation stage determines potential of hematopoietic cells for reprogramming into induced pluripotent stem cells. Nat Genet. 2009;41:968–976. doi: 10.1038/ng.428. [DOI] [PMC free article] [PubMed] [Google Scholar]
- Greco V, Guo S. Compartmentalized organization: a common and required feature of stem cell niches? Development. 2010;137:1586–1594. doi: 10.1242/dev.041103. [DOI] [PMC free article] [PubMed] [Google Scholar]
- Guo S, Lu J, Schlanger R, Zhang H, Wang JY, Fox MC, Purton LE, Fleming HH, Cobb B, Merkenschlager M, et al. MicroRNA miR-125a controls hematopoietic stem cell number. Proc Natl Acad Sci U S A. 2010;107:14229–14234. doi: 10.1073/pnas.0913574107. [DOI] [PMC free article] [PubMed] [Google Scholar]
- Hadjantonakis AK, Papaioannou VE. Dynamic in vivo imaging and cell tracking using a histone fluorescent protein fusion in mice. BMC Biotechnol. 2004;4:33. doi: 10.1186/1472-6750-4-33. [DOI] [PMC free article] [PubMed] [Google Scholar]
- Hanna J, Saha K, Pando B, van Zon J, Lengner CJ, Creyghton MP, van Oudenaarden A, Jaenisch R. Direct cell reprogramming is a stochastic process amenable to acceleration. Nature. 2009;462:595–601. doi: 10.1038/nature08592. [DOI] [PMC free article] [PubMed] [Google Scholar]
- Hanna JH, Saha K, Jaenisch R. Pluripotency and cellular reprogramming: facts, hypotheses, unresolved issues. Cell. 2010;143:508–525. doi: 10.1016/j.cell.2010.10.008. [DOI] [PMC free article] [PubMed] [Google Scholar]
- Hong H, Takahashi K, Ichisaka T, Aoi T, Kanagawa O, Nakagawa M, Okita K, Yamanaka S. Suppression of induced pluripotent stem cell generation by the p53-p21 pathway. Nature. 2009;460:1132–1135. doi: 10.1038/nature08235. [DOI] [PMC free article] [PubMed] [Google Scholar]
- Kim JB, Zaehres H, Wu G, Gentile L, Ko K, Sebastiano V, Arauzo-Bravo MJ, Ruau D, Han DW, Zenke M, et al. Pluripotent stem cells induced from adult neural stem cells by reprogramming with two factors. Nature. 2008;454:646–650. doi: 10.1038/nature07061. [DOI] [PubMed] [Google Scholar]
- Koche RP, Smith ZD, Adli M, Gu H, Ku M, Gnirke A, Bernstein BE, Meissner A. Reprogramming factor expression initiates widespread targeted chromatin remodeling. Cell Stem Cell. 2011;8:96–105. doi: 10.1016/j.stem.2010.12.001. [DOI] [PMC free article] [PubMed] [Google Scholar]
- Krivtsov AV, Twomey D, Feng Z, Stubbs MC, Wang Y, Faber J, Levine JE, Wang J, Hahn WC, Gilliland DG, et al. Transformation from committed progenitor to leukaemia stem cell initiated by MLL-AF9. Nature. 2006;442:818–822. doi: 10.1038/nature04980. [DOI] [PubMed] [Google Scholar]
- Kueh HY, Champhekhar A, Nutt SL, Elowitz MB, Rothenberg EV. Positive feedback between PU.1 and the cell cycle controls myeloid differentiation. Science. 2013;341:670–673. doi: 10.1126/science.1240831. [DOI] [PMC free article] [PubMed] [Google Scholar]
- Li R, Liang J, Ni S, Zhou T, Qing X, Li H, He W, Chen J, Li F, Zhuang Q, et al. A mesenchymal-to-epithelial transition initiates and is required for the nuclear reprogramming of mouse fibroblasts. Cell Stem Cell. 2010;7:51–63. doi: 10.1016/j.stem.2010.04.014. [DOI] [PubMed] [Google Scholar]
- Lodish H, Berk A, Zipursky SL. In Cell-Cycle Control in Mammalian Cells. New York: W. H. Freeman; 2000. Molecular Cell Biology. [Google Scholar]
- Lowry WE, Richter L, Yachechko R, Pyle AD, Tchieu J, Sridharan R, Clark AT, Plath K. Generation of human induced pluripotent stem cells from dermal fibroblasts. Proc Natl Acad Sci U S A. 2008;105:2883–2888. doi: 10.1073/pnas.0711983105. [DOI] [PMC free article] [PubMed] [Google Scholar]
- Luo M, Ling T, Xie W, Sun H, Zhou Y, Zhu Q, Shen M, Zong L, Lyu G, Zhao Y, et al. NuRD blocks reprogramming of mouse somatic cells into pluripotent stem cells. Stem Cells. 2013;31:1278–1286. doi: 10.1002/stem.1374. [DOI] [PubMed] [Google Scholar]
- Matsumoto A, Takeishi S, Kanie T, Susaki E, Onoyama I, Tateishi Y, Nakayama K, Nakayama KI. p57 is required for quiescence and maintenance of adult hematopoietic stem cells. Cell Stem Cell. 2011;9:262–271. doi: 10.1016/j.stem.2011.06.014. [DOI] [PubMed] [Google Scholar]
- Megyola CM, Gao Y, Teixeira AM, Cheng J, Heydari K, Cheng EC, Nottoli T, Krause DS, Lu J, Guo S. Dynamic Migration and Cell-Cell Interactions of Early Reprogramming Revealed by High Resolution Time-lapse Imaging. Stem Cells. 2013 doi: 10.1002/stem.1323. [DOI] [PMC free article] [PubMed] [Google Scholar]
- Mikkelsen TS, Hanna J, Zhang X, Ku M, Wernig M, Schorderet P, Bernstein BE, Jaenisch R, Lander ES, Meissner A. Dissecting direct reprogramming through integrative genomic analysis. Nature. 2008;454:49–55. doi: 10.1038/nature07056. [DOI] [PMC free article] [PubMed] [Google Scholar]
- Pan X, Durrett RE, Zhu H, Tanaka Y, Li Y, Zi X, Marjani SL, Euskirchen G, Ma C, Lamotte RH, et al. Two methods for full-length RNA sequencing for low quantities of cells and single cells. Proc Natl Acad Sci U S A. 2013;110:594–599. doi: 10.1073/pnas.1217322109. [DOI] [PMC free article] [PubMed] [Google Scholar]
- Papapetrou EP, Tomishima MJ, Chambers SM, Mica Y, Reed E, Menon J, Tabar V, Mo Q, Studer L, Sadelain M. Stoichiometric and temporal requirements of Oct4, Sox2, Klf4, and c-Myc expression for efficient human iPSC induction and differentiation. Proc Natl Acad Sci U S A. 2009;106:12759–12764. doi: 10.1073/pnas.0904825106. [DOI] [PMC free article] [PubMed] [Google Scholar]
- Park IH, Zhao R, West JA, Yabuuchi A, Huo H, Ince TA, Lerou PH, Lensch MW, Daley GQ. Reprogramming of human somatic cells to pluripotency with defined factors. Nature. 2008;451:141–146. doi: 10.1038/nature06534. [DOI] [PubMed] [Google Scholar]
- Pauklin S, Vallier L. The cell-cycle state of stem cells determines cell fate propensity. Cell. 2013;155:135–147. doi: 10.1016/j.cell.2013.08.031. [DOI] [PMC free article] [PubMed] [Google Scholar]
- Polo JM, Anderssen E, Walsh RM, Schwarz BA, Nefzger CM, Lim SM, Borkent M, Apostolou E, Alaei S, Cloutier J, et al. A molecular roadmap of reprogramming somatic cells into iPS cells. Cell. 2012;151:1617–1632. doi: 10.1016/j.cell.2012.11.039. [DOI] [PMC free article] [PubMed] [Google Scholar]
- Pop R, Shearstone JR, Shen Q, Liu Y, Hallstrom K, Koulnis M, Gribnau J, Socolovsky M. A key commitment step in erythropoiesis is synchronized with the cell cycle clock through mutual inhibition between PU.1 and S-phase progression. PLoS biology. 2010:8. doi: 10.1371/journal.pbio.1000484. [DOI] [PMC free article] [PubMed] [Google Scholar]
- Rais Y, Zviran A, Geula S, Gafni O, Chomsky E, Viukov S, Mansour AA, Caspi I, Krupalnik V, Zerbib M, et al. Deterministic direct reprogramming of somatic cells to pluripotency. Nature. 2013;502:65–70. doi: 10.1038/nature12587. [DOI] [PubMed] [Google Scholar]
- Redmer T, Diecke S, Grigoryan T, Quiroga-Negreira A, Birchmeier W, Besser D. E-cadherin is crucial for embryonic stem cell pluripotency and can replace OCT4 during somatic cell reprogramming. EMBO Rep. 2011;12:720–726. doi: 10.1038/embor.2011.88. [DOI] [PMC free article] [PubMed] [Google Scholar]
- Ruiz S, Panopoulos AD, Herrerias A, Bissig KD, Lutz M, Berggren WT, Verma IM, Izpisua Belmonte JC. A high proliferation rate is required for cell reprogramming and maintenance of human embryonic stem cell identity. Curr Biol. 2011;21:45–52. doi: 10.1016/j.cub.2010.11.049. [DOI] [PMC free article] [PubMed] [Google Scholar]
- Sage J, Mulligan GJ, Attardi LD, Miller A, Chen S, Williams B, Theodorou E, Jacks T. Targeted disruption of the three Rb-related genes leads to loss of G(1) control and immortalization. Genes Dev. 2000;14:3037–3050. doi: 10.1101/gad.843200. [DOI] [PMC free article] [PubMed] [Google Scholar]
- Sakaue-Sawano A, Kurokawa H, Morimura T, Hanyu A, Hama H, Osawa H, Kashiwagi S, Fukami K, Miyata T, Miyoshi H, et al. Visualizing spatiotemporal dynamics of multicellular cell-cycle progression. Cell. 2008;132:487–498. doi: 10.1016/j.cell.2007.12.033. [DOI] [PubMed] [Google Scholar]
- Samavarchi-Tehrani P, Golipour A, David L, Sung HK, Beyer TA, Datti A, Woltjen K, Nagy A, Wrana JL. Functional genomics reveals a BMP-driven mesenchymal-to-epithelial transition in the initiation of somatic cell reprogramming. Cell Stem Cell. 2010;7:64–77. doi: 10.1016/j.stem.2010.04.015. [DOI] [PubMed] [Google Scholar]
- Smith ZD, Nachman I, Regev A, Meissner A. Dynamic single-cell imaging of direct reprogramming reveals an early specifying event. Nat Biotechnol. 2010;28:521–526. doi: 10.1038/nbt.1632. [DOI] [PMC free article] [PubMed] [Google Scholar]
- Stadtfeld M, Hochedlinger K. Induced pluripotency: history, mechanisms, and applications. Genes Dev. 2010;24:2239–2263. doi: 10.1101/gad.1963910. [DOI] [PMC free article] [PubMed] [Google Scholar]
- Takahashi K, Nakayama K, Nakayama K. Mice lacking a CDK inhibitor, p57Kip2, exhibit skeletal abnormalities and growth retardation. Journal of biochemistry. 2000;127:73–83. doi: 10.1093/oxfordjournals.jbchem.a022586. [DOI] [PubMed] [Google Scholar]
- Takahashi K, Tanabe K, Ohnuki M, Narita M, Ichisaka T, Tomoda K, Yamanaka S. Induction of pluripotent stem cells from adult human fibroblasts by defined factors. Cell. 2007;131:861–872. doi: 10.1016/j.cell.2007.11.019. [DOI] [PubMed] [Google Scholar]
- Takahashi K, Yamanaka S. Induction of pluripotent stem cells from mouse embryonic and adult fibroblast cultures by defined factors. Cell. 2006;126:663–676. doi: 10.1016/j.cell.2006.07.024. [DOI] [PubMed] [Google Scholar]
- Takizawa H, Regoes RR, Boddupalli CS, Bonhoeffer S, Manz MG. Dynamic variation in cycling of hematopoietic stem cells in steady state and inflammation. J Exp Med. 2011;208:273–284. doi: 10.1084/jem.20101643. [DOI] [PMC free article] [PubMed] [Google Scholar]
- Tsunekawa Y, Britto JM, Takahashi M, Polleux F, Tan SS, Osumi N. Cyclin D2 in the basal process of neural progenitors is linked to non-equivalent cell fates. The EMBO journal. 2012;31:1879–1892. doi: 10.1038/emboj.2012.43. [DOI] [PMC free article] [PubMed] [Google Scholar]
- Utikal J, Polo JM, Stadtfeld M, Maherali N, Kulalert W, Walsh RM, Khalil A, Rheinwald JG, Hochedlinger K. Immortalization eliminates a roadblock during cellular reprogramming into iPS cells. Nature. 2009;460:1145–1148. doi: 10.1038/nature08285. [DOI] [PMC free article] [PubMed] [Google Scholar]
- Wakao S, Kitada M, Kuroda Y, Shigemoto T, Matsuse D, Akashi H, Tanimura Y, Tsuchiyama K, Kikuchi T, Goda M, et al. Multilineage-differentiating stress-enduring (Muse) cells are a primary source of induced pluripotent stem cells in human fibroblasts. Proc Natl Acad Sci U S A. 2011;108:9875–9880. doi: 10.1073/pnas.1100816108. [DOI] [PMC free article] [PubMed] [Google Scholar]
- Wang Y, Blelloch R. Cell cycle regulation by MicroRNAs in embryonic stem cells. Cancer Res. 2009;69:4093–4096. doi: 10.1158/0008-5472.CAN-09-0309. [DOI] [PMC free article] [PubMed] [Google Scholar]
- Wang Z, Yu R, Melmed S. Mice lacking pituitary tumor transforming gene show testicular and splenic hypoplasia, thymic hyperplasia, thrombocytopenia, aberrant cell cycle progression, and premature centromere division. Mol Endocrinol. 2001;15:1870–1879. doi: 10.1210/mend.15.11.0729. [DOI] [PubMed] [Google Scholar]
- Wernig M, Lengner CJ, Hanna J, Lodato MA, Steine E, Foreman R, Staerk J, Markoulaki S, Jaenisch R. A drug-inducible transgenic system for direct reprogramming of multiple somatic cell types. Nat Biotechnol. 2008;26:916–924. doi: 10.1038/nbt1483. [DOI] [PMC free article] [PubMed] [Google Scholar]
- Wernig M, Meissner A, Foreman R, Brambrink T, Ku M, Hochedlinger K, Bernstein BE, Jaenisch R. In vitro reprogramming of fibroblasts into a pluripotent ES-cell-like state. Nature. 2007;448:318–324. doi: 10.1038/nature05944. [DOI] [PubMed] [Google Scholar]
- White J, Dalton S. Cell cycle control of embryonic stem cells. Stem Cell Rev. 2005;1:131–138. doi: 10.1385/SCR:1:2:131. [DOI] [PubMed] [Google Scholar]
- Yamanaka S. Elite and stochastic models for induced pluripotent stem cell generation. Nature. 2009;460:49–52. doi: 10.1038/nature08180. [DOI] [PubMed] [Google Scholar]
- Zou P, Yoshihara H, Hosokawa K, Tai I, Shinmyozu K, Tsukahara F, Maru Y, Nakayama K, Nakayama KI, Suda T. p57(Kip2) and p27(Kip1) cooperate to maintain hematopoietic stem cell quiescence through interactions with Hsc70. Cell Stem Cell. 2011;9:247–261. doi: 10.1016/j.stem.2011.07.003. [DOI] [PubMed] [Google Scholar]
Associated Data
This section collects any data citations, data availability statements, or supplementary materials included in this article.