Abstract
Background:
In the literature, music education has been shown to enhance auditory perception for children and young adults. When compared to young adult non-musicians, young adult musicians demonstrate increased auditory processing, and enhanced sensitivity to acoustic changes. The evoked response potentials associated with the interpretation of sound are enhanced in musicians. Studies show that training also changes sound perception and cortical responses. The earlier training appears to lead to larger changes in the auditory cortex.
Aims:
Most cortical studies in the literature have used pure tones or musical instrument sounds as stimuli signals. The aim of those studies was to investigate whether musical education would enhance auditory cortical responses when speech signals were used. In this study, the speech sounds extracted from running speech were used as sound stimuli.
Study Design:
Non-randomized controlled study.
Methods:
The experimental group consists of young adults up to 21 years-old, all with a minimum of 4 years of musical education. The control group was selected from young adults of the same age without any musical education. The experiments were conducted by using a cortical evoked potential analyser and /m/, /t/ /g/ sound stimulation at the level of 65 dB SPL. In this study, P1 / N1 / P2 amplitude and latency values were measured.
Results:
Significant differences were found in the amplitude values of P1 and P2 (p<0.05). The differences among the latencies were not found to be significantly important (p>0.05).
Conclusion:
The results obtained in our study indicate that musical experience has an effect on the nervous system and this can be seen in cortical auditory evoked potentials recorded when the subjects hear speech.
Keywords: Auditory cortex, cortical auditory, evoked potentials, evoked responses, musical training
In the literature, music education has been shown to enhance auditory perception for children and young adults (1–3). Compared to young adult non-musicians, young adult musicians demonstrate increased auditory processing, and enhanced sensitivity to acoustic changes. The evoked response potentials associated with the interpretation of sound are enhanced in musicians. Studies show that training also changes sound perception and cortical responses. Earlier training appears to lead to larger changes in the auditory cortex (4–6). Learning to read in a language involves auditory processing because, in order to learn to read, children must be able to break a word into its phonemes. Hence, if phonemic awareness is increased in children, this may lead to increased reading skills. In the literature, it has been reported that pre-school children’s phonemic awareness and early reading skills are correlated with musical training.
Studies have also shown that the earlier maturation of evoked potentials in children is correlated to musical training (5, 7, 8). Most cortical studies in the literature used pure tones or musical instrument sounds as stimuli. However, in the literature, there are studies showing musicians’ advantages for encoding both music and speech (9, 10). A neural basis for this musician benefit has been demonstrated in the sub cortical encoding of sounds. The brain stem responses for musicians and non-musicians were similar when quiet, but noise had a more disruptive effect on the morphology, size, timing, and frequency of non-musicians’ responses compared to musicians’ (10, 11). The aim of that study was to investigate whether musical education would enhance auditory cortical responses when speech signals were used. Therefore, speech sounds extracted from running speech were used as sound stimuli in this study.
MATERIALS AND METHODS
This work has been approved by the Institutional Ethics Committee. A signed informed consent form was obtained from each participant following a detailed explanation of the procedures that they may undergo. The thirteen subjects in the experimental group were young adults between the ages of 15.6 and 23.6 years. The average age was 18.61 and the standard deviation was 2.1 years. They were students in the musical high school or in the musical department of the university and had received a minimum of 4 years of musical education. The longest duration of musical educations was 13 years, and all individuals regularly play their musical instruments for a minimum of 3 hours per day. The control group consisted of nine subjects selected from young adults of the same age without any musical education. All of the participants in the control group were students in the Audiology Department of the University. The age of the control group was between 18.3 and 20 years. The average and standard deviations were 18.68 and 0.3, respectively. The characteristics of the groups are given in Table 1.
TABLE 1.
The characteristics of the control and experimental groups
| Control group | Experimental group | |
|---|---|---|
| n | 9 | 13 |
| Gender | 7 Female | 7 Female |
| 2 Male | 6 Male | |
| Age (years) | 18.68±0.3 | 18.61±2.1 |
| Musical experience (years) | 0 | 7.73±3.74 |
The subjects participating in this study were selected according to a procedure. For this purpose, for all cases, standard Ear, Nose and Throat (ENT) examination, audiometric and impedansmetric test batteries were carried out. Subjects with any hearing problem were discarded.
The experiments were conducted by using The HEARLab System Cortical Evoked Potential Analyser (Frye Electronics, Inc; Tigard, Oregon, USA). The /m/, /t/ and /g/ speech sounds from running speech were used as sound stimulation. The presentation level of sound stimuli was at 65 dB Sound Pressure Level (SPL). The measurement parameters of the HEARlab System Cortical Evoked Potential Analyser used during this study are given in Table 2.
TABLE 2.
The measurement parameters of the HEARlab System Cortical Evoked Potential Analyzer
| Acoustic stimulation ACA measurement parameters | |
|---|---|
| Stimuli type | Speech sounds from running speech |
| Duration | /m/ 30 ms |
| /g/ 20 ms | |
| /t/ 30 ms | |
| Repetition period | 1125 ms |
| Number of epochs | 200–220 |
| Polarity | Alternate |
| Level | 65 dB |
ACA: aided cortical assessment
Measurement set up
Listeners were seated in a double-walled sound chamber with the one loudspeaker positioned 30 inches from the test ear at an azimuth of 90 degrees. The stimuli were presented through the front loudspeaker at the 65dB SPL level. Measurement set up is shown in Figure 1.
FIG. 1.
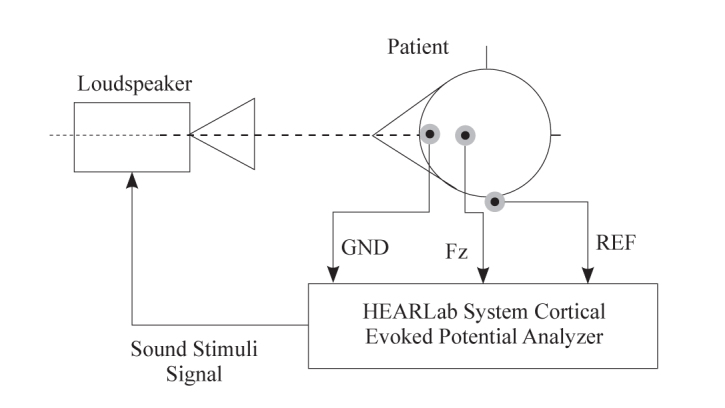
The CAEP measurement setup
Cortical auditory evoked potentials (CAEP) data were recorded from Ag-AgCl scalp electrode Fz (10–20 International System, mastoid earlobe reference, forehead ground). Placements of the electrodes are given in Figure 2.
FIG. 2.
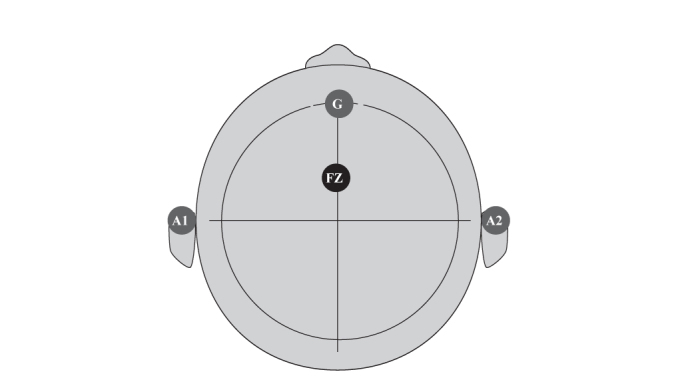
Electrode placement diagram
If the subject was right-handed, A1 was used as a reference point; if the subject was left-handed, A2 was the reference.
In this study, P1/N1 /P2 amplitudes and the latency values were examined. Cortical responses were epoched and averaged in each condition with the HEARLab measurement system. Then, cortical response peaks (P1, N1 and P2) were chosen from each subject’s averaged waveform displayed at the screen of the system. Finally, amplitude and latency information were determined according to the chosen cortical response peak.
Statistical analysis
First, the normality of parameters was tested by Shapiro-Wilk analysis using SPSS 13.0 for Windows (IBM Corporation, New York, USA) and found to be normal. Then, Independent-Samples T Test was performed using SPSS 13.0 for Windows to test the statistical significance of the peak latency and the amplitude value differences between groups. The value of p≤0.05 was considered to be significant.
RESULTS
The bar graph in Figure 3 gives the mean amplitudes of P1, N1, and P2 components when /m/ was used as the speech sound stimulus. The value of mean amplitude of P1 when /m/ was used as the stimulus (P1m) was 1.0061μV for the control group and 2.1115μV for the experimental group. The value of mean amplitude of N1 when /m/ was used as the stimulus (N1m) was −3.5411μV for the control group and −3.0685μV for the experimental group. The value of the mean amplitude of P2 when /m/ was used as the stimulus (P2m) was 1.6533μV for the control group and 4.0538μV for the experimental group.
FIG. 3.
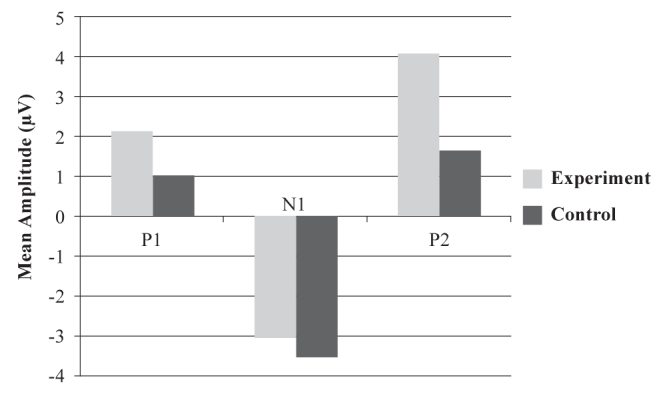
Mean amplitudes of P1m, N1m, and P2m components
The mean amplitudes of P1, N1, and P2 components are given in the bar graph in Figure 4 when /g/ was used as the speech sound stimulus. The mean amplitude of P1 when /g/ was used as the stimulus (P1g) was 1.0067μV for the control group and 3.3954μV for the experimental group. The value for N1 when /g/ was used as the stimulus (N1g) was −1.4944μV for the control group and −0.7477μV for the experimental group. The mean amplitude of P2 when /g/ was used as the stimulus (P2g) was 3.2422μV for the control group and 5.3700μV for the experimental group.
FIG. 4.
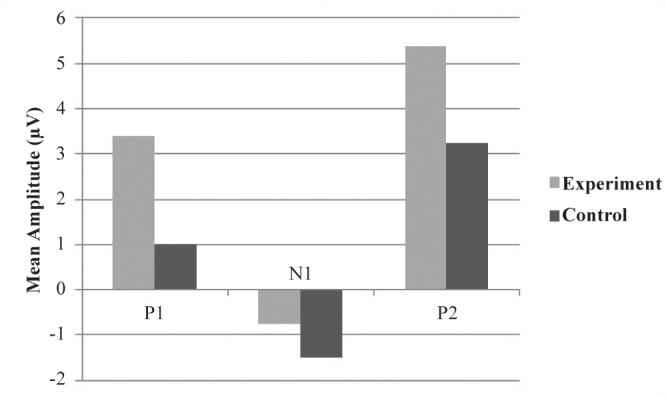
Mean amplitudes of P1g, N1g, and P2g components
The bar graph in Figure 5 shows the mean amplitudes of P1, N1, and P2 components when /t/ was used as the speech sound stimulus. The value of mean amplitude of P1 when /t/ was used as the stimulus (P1t) was 0.9567μV for the control group and 2.9700μV for the experimental group. The value of mean amplitude of N1 when /t/ was used as the stimulus (N1t) was −2.9278μV for the control group and −2.3662μV for the experimental group. The value of mean amplitude of P2 when /t/ was used as a stimulus (P2t) was 2.4833μV for the control group and 4.8454μV for the experimental group.
FIG. 5.
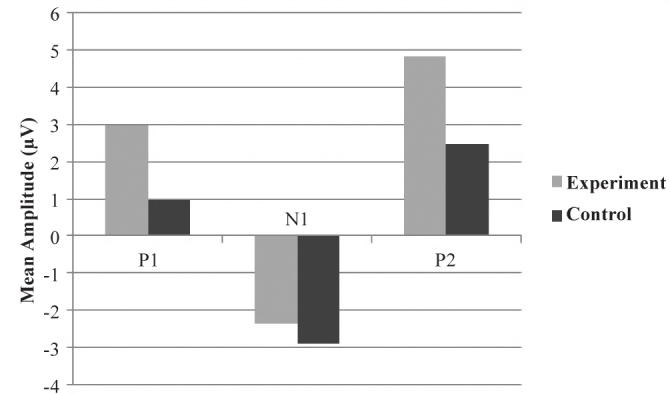
Mean amplitudes of P1t, N1t, and P2t components
The latency values were also measured and given in the following figures. The bar graph in Figure 6 gives the mean latencies of P1, N1, and P2 components when /m/ was used as the sound stimulus. The value of mean latencies of P1 was 62 milliseconds (ms) for the control group and 77.46 ms for the experimental group. The value of mean latencies of N1 was 100.445 ms for the control group and 123.38 ms for the experimental group. The value of mean latencies of P2 was 167.78 ms for the control group and 185.77 ms for the experimental group.
FIG. 6.
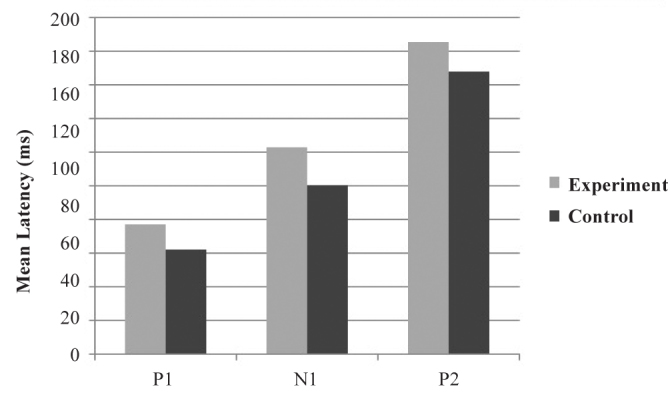
Mean latencies of P1m, N1m, and P2m components
When /g/ was used as the speech sound stimulus, the mean latencies of P1, N1, and P2 components were found, as shown in the bar graph in Figure 7. The value of mean latencies of P1 was 42.55 ms for the control group and 64.46 ms for the experimental group. The value of mean latencies of N1 was 78.22 ms for the control group and 104.15 ms for the experimental group. The value of mean latencies of P2 was 151.67 ms for the control group and 170.23 ms for the experimental group.
FIG. 7.
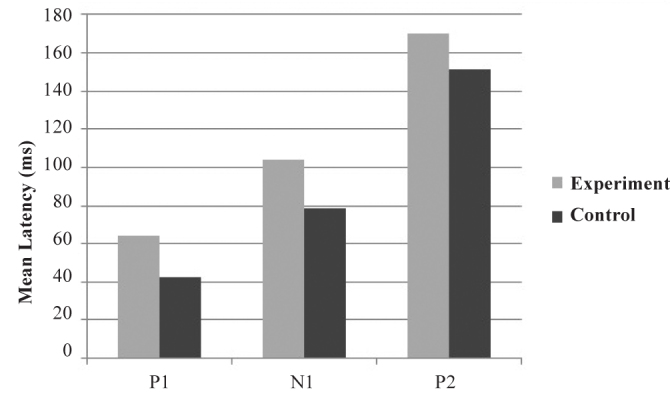
Mean latencies of P1g, N1g, and P2g components
The bar graph in Figure 8 gives the mean latencies of P1, N1, and P2 components when /t/ was used as the speech sound stimulus. The value of mean latencies of P1 was 46.33 ms for the control group and 64.077 ms for the experimental group. The value of mean latencies of N1 was 86.33 ms for the control group and 103 ms for the experimental group. The value of mean latencies of P2 was 158.89 ms for the control group and 165 ms for the experimental group.
FIG. 8.
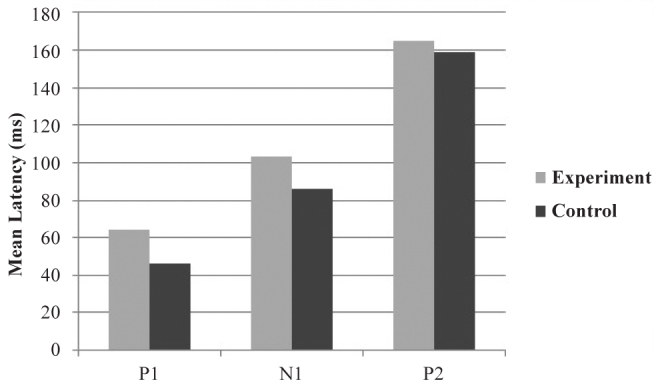
Mean latencies of P1t, N1t, and P2t components
The T test revealed a significant main effect (p<0.05) between groups for amplitude values. Amplitude differences between groups are shown in Table 3. P1g, P1t, P2m, P2g, and P2t amplitude values were found to be significantly greater in musical young adults (p<0.05).
TABLE 3.
T test results of amplitudes of P1, N1, and P2 components
| Group | n | Mean (μV) | Std. Deviation | t | df | p | |
|---|---|---|---|---|---|---|---|
| P1m | Control | 9 | 1.0061 | 1.82165 | 1.3897 | 20 | 0.1799 |
| Experimental | 13 | 2.1115 | 1.84274 | (p>0.05) | |||
| P1g | Control | 9 | 1.0067 | 1.84765 | 2.4943 | 20 | 0.0215 |
| Experimental | 13 | 3.3954 | 2.41938 | (p<0.05) | |||
| P1t | Control | 9 | 0.9567 | 1.94247 | 2.1424 | 20 | 0.0446 |
| Experimental | 13 | 2.9700 | 2.30487 | (p<0.05) | |||
| N1m | Control | 9 | −3.5411 | 1.86358 | 0.6222 | 20 | 0.5408 |
| Experimental | 13 | −3.0685 | 1.67317 | (p>0.05) | |||
| N1g | Control | 9 | −1.4944 | 2.48813 | 0.8296 | 20 | 0.4166 |
| Experimental | 13 | −0.7477 | 1.74765 | (p>0.05) | |||
| N1t | Control | 9 | −2.9278 | 1.24963 | 0.7047 | 20 | 0.4891 |
| Experimental | 13 | −2.3662 | 2.14208 | (p>0.05) | |||
| P2m | Control | 9 | 1.6533 | 1.31937 | 3.3099 | 20 | 0.0035 |
| Experimental | 13 | 4.0538 | 1.87130 | (p<0.05) | |||
| P2g | Control | 9 | 3.2422 | 2.46911 | 2.1756 | 20 | 0.0417 |
| Experimental | 13 | 5.3700 | 2.10093 | (p<0.05) | |||
| P2t | Control | 9 | 2.4833 | 2.71420 | 2.2083 | 20 | 0.0391 |
| Experimental | 13 | 4.8454 | 2.28685 | (p<0.05) |
P1m: The mean amplitude of P1 when /m/ was used as stimulus; P1g: The mean amplitude of P1 when /g/ was used as stimulus; P1t: The mean amplitude of P1 when /t/ was used as stimulus; N1m: The mean amplitude of N1 when /m/ was used as stimulus; N1g: The mean amplitude of N1 when /g/ was used as stimulus; N1t: The mean amplitude of P1 when /t/ was used as stimulus; P2m: The mean amplitude of P2 when /m/ was used as stimulus; P2g: The mean amplitude of P2 when /g/ was used as stimulus; P2t: The mean amplitude of P2 when /t/ was used as stimulus
Latency differences between groups are shown in Table 4. None of the component latencies were found to be significantly different between groups (p>0.05).
TABLE 4.
T test results of the latencies of P1, N1, and P2 components
| Group | N | Mean (ms) | Std. Deviation | t | df | p | |
|---|---|---|---|---|---|---|---|
| P1m | Control | 9 | 62.0000 | 16.27882 | −1.55120322 | 20 | 0.136533678 |
| Experimental | 13 | 77.4615 | 26.53179 | p>0.05 | |||
| P1g | Control | 9 | 42.5556 | 20.18112 | 1.961249395 | 20 | 0.063922822 |
| Experimental | 13 | 64.4615 | 28.88372 | p>0.05 | |||
| P1t | Control | 9 | 46.3333 | 20.71835 | 1.458833621 | 20 | 0.160138341 |
| Experimental | 13 | 64.0769 | 32.01682 | p>0.05 | |||
| N1m | Control | 9 | 100.4444 | 21.34895 | −1.7929891 | 20 | 0.088113118 |
| Experimental | 13 | 123.3846 | 33.86871 | p>0.05 | |||
| N1g | Control | 9 | 78.2222 | 21.74729 | 1.761332729 | 20 | 0.093463744 |
| Experimental | 13 | 104.1538 | 40.07461 | p>0.05 | |||
| N1t | Control | 9 | 86.3333 | 20.97618 | 1.119844432 | 20 | 0.276048661 |
| Experimental | 13 | 103.0000 | 40.86563 | p>0.05 | |||
| P2m | Control | 9 | 167.7778 | 11.99768 | 1.573263245 | 20 | 0.131344595 |
| Experimental | 13 | 185.7692 | 32.60663 | p>0.05 | |||
| P2g | Control | 9 | 151.6667 | 10.74709 | 1.548528665 | 20 | 0.137174226 |
| Experimental | 13 | 170.2308 | 34.59565 | p>0.05 | |||
| P2t | Control | 9 | 158.8889 | 7.70462 | −0.37458929 | 20 | 0.711908345 |
| Experimental | 13 | 165.0000 | 48.16119 | p>0.05 |
P1m: The mean amplitude of P1 when /m/ was used as stimulus; P1g: The mean amplitude of P1 when /g/ was used as stimulus; P1t: The mean amplitude of P1 when /t/ was used as stimulus; N1m: The mean amplitude of N1 when /m/ was used as stimulus; N1g: The mean amplitude of N1 when /g/ was used as stimulus; N1t: The mean amplitude of P1 when /t/ was used as stimulus; P2m: The mean amplitude of P2 when /m/ was used as stimulus; P2g: The mean amplitude of P2 when /g/ was used as stimulus; P2t: The mean amplitude of P2 when /t/ was used as stimulus
DISCUSSION
In this study, the effects of professional musical education on cortical auditory evoked potentials were investigated. According to the results obtained in this study, statistically significant differences between the experimental and control groups were found to be within the amplitude value of P2 when /m/, /g/ and /t/ speech stimuli were used (p<0.05). These results are consistent with the studies in the literature. For example, Trainor et al. (5) used piano, pure ton and violin tones as stimuli signal. They compared the evoked response of adult and child musicians with non-musician counterparts. It was found that the P2-evoked response was larger in both adult and child musicians than in non-musicians and that auditory training enhances this component in non-musician adults. Although speech stimuli were used in our study, the results are similar to those in the literature.
In the study of Shahin et al. (12), highly skilled violinists and pianists and non-musician controls listened under conditions of passive attention to violin tones, piano tones, and pure tones matched in fundamental frequency to the musical tones. They found that, compared with non-musician controls, both musician groups evidenced larger P2 responses to the three types of tonal stimuli. In contrast, the amplitude of the N1 evoked by musical or pure tones did not differ between musicians and non-musicians. Kuriki et al. (2) examined the cortical auditory evoked responses in long-term trained musicians and compared them with those in the non-musician group. The single tone or accord tones of piano sounds were used as the stimuli. They found that the amplitude of the P2 response of auditory evoked potentials is modified by musical experience. In contrast, there was no significant alteration at the amplitude value of N1. The result of this study is also similar to our results. Here, in contrast to the amplitude value of P2, no significant difference in the amplitude of the N1 component was found between musicians and non-musicians. This observation of modification of the P2 amplitude is in agreement with the results of a previous CAEP study showing an enhancement of the P2 component in skilled musicians with long-term experience of the use of instruments (12). The amplitude of P2 was also enhanced after auditory training in non-musicians (13–15) and after cochlear implantation in patients (16). Thus, it can be concluded that the cortical activity underlying P2 is amenable to modulation by long-term musical experience.
In the study of Musacchia et al. (3), the speech syllable “da” was presented to 14 musicians and 12 non-musicians, and cortical response peak values were compared. The amplitude value of P1 was found to be significantly higher in musicians. Similarly, in our study, statistically significant differences between the experimental and control groups were found in the amplitude value of P1 when /g/ and /t/ speech stimuli were used (p<0.05). For /m/ speech stimulation, there was a difference, but it was not found to be statistically significant (p>0.05).
According to the results of our study, latency values were found to be significantly different between groups (p>0.05). In the literature, there are studies reporting latency differences (9, 3, 17). Musacchia et al. (3) found P1 and N1 peaks earlier in the musician group. However, similar results were not found in this study. In the study of Nikjeh et al. (17), it was found that musicians had longer P1 latencies for pure tones and smaller P1 amplitudes for harmonic tones than non-musicians (17). There were no P1 group differences for speech stimuli. Similarly, in our study, there were no statically significant differences for speech stimuli in the latency values between musicians and non-musicians.
Findings in the literature and our study support a general influence of music training on central auditory function and illustrate experience-facilitated modulation of the auditory neural system. Interestingly, the effects of experience are not limited to the children. Even adult non-musicians given auditory training showed an enhancement of cortical responses, as seen in adult musicians and children with musical education. These results imply that musical training in adulthood and even in old age may provide a benefit (5).
The result obtained in our study indicate that musical experiences have effects on the nervous system; this can be seen in cortical auditory evoked potentials recorded when the subjects heard speech. Studies in the literature also show that musical experience enhances encoding mechanisms that are relevant for musical sounds as well as for the processing of linguistic cues and multisensory information. It can be concluded that:
Musical training enhances auditory perception.
Musicians are more sensitive than non-musicians to instrument sounds that are played.
Musicians are also more sensitive than non-musicians to speech stimuli.
Musical training may enhance phonetic awareness. This may also lead to enhanced language and reading performance in children.
Footnotes
This study was presented at the 11th Congress of The European Federation of Audiology Societies (EFAS), 19–22 June 2013, Budapest, Hungary.
Ethics Committee Approval: Ethics committee approval was received for this study from institutional ethics committee.
Informed Consent: Written informed consent was obtained from patients who participated in this study.
Peer-review: Externally peer-reviewed.
Author contributions: Concept - Z.P., A.A.; Design - Z.P.; Supervision - A.A.; Resource - Z.P., A.A.; Materials - Z.P.; Data Collection&/or Processing - Z.P.; Analysis&/or Interpretation - Z.P.; Literature Search - Z.P.; Writing - Z.P.; Critical Reviews - Z.P., A.A.
Conflict of Interest: No conflict of interest was declared by the authors.
Financial Disclosure: The authors declared that this study has received no financial support.
REFERENCES
- 1.Weeks LH. Music and its effect on late auditory evoked potentials in elementary school aged children. Honors Theses, Paper 2, Honors College. 2011:13–9. [Google Scholar]
- 2.Kuriki S, Kanda S, Hirata Y. Effects of musical experience on different components of meg responses elicited by sequential piano-tones and chords. J Neurosci. 2006;26:4046–53. doi: 10.1523/JNEUROSCI.3907-05.2006. http://dx.doi.org/10.1523/JNEUROSCI.3907-05.2006. [DOI] [PMC free article] [PubMed] [Google Scholar]
- 3.Musacchia G, Strait D, Kraus N. Relationships between behavior, brainstem and cortical encoding of seen and heard speech in musicians and non-musicians. Hear Res. 2008;241:34–42. doi: 10.1016/j.heares.2008.04.013. http://dx.doi.org/10.1016/j.heares.2008.04.013. [DOI] [PMC free article] [PubMed] [Google Scholar]
- 4.Neville HJ, Andersson A, Bagdade O, Bell T, Currin J, Fanning J, et al. Effects of music training on brain and cognitive development in underprivileged 3- to 5-year-old children: Preliminary results. In: Asbury C, Rich B, editors. Learning, arts, and the brain. New York: Dana Press; 2008. pp. 105–16. [Google Scholar]
- 5.Trainor LJ, Shahin A, Roberts LE. Effects of musical training on the Audiotory Cortex in children. Ann N Y Acad Sci. 2003;999:506–513. doi: 10.1196/annals.1284.061. http://dx.doi.org/10.1196/annals.1284.061. [DOI] [PubMed] [Google Scholar]
- 6.Chermak GD. Music and auditory training. Hear J (Pathways) 2010;63:57–8. [Google Scholar]
- 7.Anvari S, Trainor LJ, Woodside J, Levy BA. Relations among musical skills, phonological processing, and early reading ability in preschool children. Journal of Exp Child Psychol. 2002;83:111–30. doi: 10.1016/s0022-0965(02)00124-8. http://dx.doi.org/10.1016/S0022-0965(02)00124-8. [DOI] [PubMed] [Google Scholar]
- 8.Lamb SJ, Gregory AH. The relationship between music and reading in beginning readers. J Educ Psychol. 1993;13:13–27. [Google Scholar]
- 9.Anderson S, Kraus N. Neural encoding of speech and music: Implications for hearing speech in noise. Semin Hear. 2011;32:129–41. doi: 10.1055/s-0031-1277234. http://dx.doi.org/10.1055/s-0031-1277234. [DOI] [PMC free article] [PubMed] [Google Scholar]
- 10.Kraus N, Chandrasekaran B. Music training for the development of auditory skills. Nat Rev Neurosci. 2010;11:599–605. doi: 10.1038/nrn2882. http://dx.doi.org/10.1038/nrn2882. [DOI] [PubMed] [Google Scholar]
- 11.Strait DL, Clark AP, Hittner E, Kraus N. Musical training during early childhood enhances the neural encoding of speech in noise. Brain Lang. 2012;123:191–201. doi: 10.1016/j.bandl.2012.09.001. http://dx.doi.org/10.1016/j.bandl.2012.09.001. [DOI] [PMC free article] [PubMed] [Google Scholar]
- 12.Shahin A, Bosnyak DJ, Trainor LJ, Larry E, Roberts LE. Enhancement of Neuroplastic P2 and N1c Auditory Evoked Potentials in Musicians. J Neurosci. 2003;23:5545–52. doi: 10.1523/JNEUROSCI.23-13-05545.2003. [DOI] [PMC free article] [PubMed] [Google Scholar]
- 13.Tremblay K, Kraus N, McGee T, Ponton C, Otis B. Central auditory plasticity: Changes in the N1-P2 complex after speech-sound training. Ear Hear. 2001;22:79–90. doi: 10.1097/00003446-200104000-00001. http://dx.doi.org/10.1097/00003446-200104000-00001. [DOI] [PubMed] [Google Scholar]
- 14.Atienza M, Cantero JL, Dominguez-Marin E. The time course of neural changes underlying auditory perceptual learning. Learn Mem. 2002;9:138–50. doi: 10.1101/lm.46502. http://dx.doi.org/10.1101/lm.46502. [DOI] [PMC free article] [PubMed] [Google Scholar]
- 15.Bosnyak DJ, Eaton RA, Roberts LE. Distributed auditory cortical representations are modified when non-musicians are trained at pitch discrimination with 40 Hz amplitude modulated tones. Cereb Cortex. 2004;14:1088–99. doi: 10.1093/cercor/bhh068. http://dx.doi.org/10.1093/cercor/bhh068. [DOI] [PubMed] [Google Scholar]
- 16.Purdy SC, Kelly AS, Thorne PR. Auditory evoked potentials as measures of plasticity in humans. Audiol Neurootol. 2001;6:211–5. doi: 10.1159/000046835. http://dx.doi.org/10.1159/000046835. [DOI] [PubMed] [Google Scholar]
- 17.Nikjeh DA, Lister JJ, Frisch SA. Preattentive cortical-evoked responses to pure tones, harmonic tones, and speech: influence of music training. Ear Hear. 2009;30:432–46. doi: 10.1097/AUD.0b013e3181a61bf2. http://dx.doi.org/10.1097/AUD.0b013e3181a61bf2. [DOI] [PubMed] [Google Scholar]


