

Abstract
Purpose
To determine the correlation in abdominal aortic stiffness obtained using magnetic resonance elastography (MRE) (μMRE) and MRI-based pulse wave velocity (PWV) shear stiffness (μPWV) estimates in normal volunteers of varying age; and also to determine the correlation between μMRE and μPWV.
Methods
In-vivo aortic MRE and MRI were performed on 21 healthy volunteers with ages ranging from 18 to 65 years to obtain wave and velocity data along the long-axis of the abdominal aorta. The MRE wave images were analyzed to obtain mean stiffness, and the phase contrast images were analyzed to obtain PWV measurements and indirectly estimate stiffness values from Moens-Korteweg equation.
Results
Both μMRE and μPWV measurements increased with age, demonstrating linear correlations with R2 values of 0.81 and 0.67, respectively. Significant difference (p≤0.001) in mean μMRE and μPWV between young and old healthy volunteers was also observed. Furthermore, a poor linear correlation of R2 value of 0.43 was determined between μMRE and μPWV in initial pool of volunteers.
Conclusion
The results of this study indicate linear correlations between μMRE and μPWV with normal aging of the abdominal aorta. Significant differences in mean μMRE and μPWV between young and old healthy volunteers were observed.
Keywords: Aortic Stiffness, Magnetic Resonance Elastography (MRE), PWV, aortic MRE
Backgroung
Arterial (aortic) stiffness is a well-recognized pathophysiological change that is altered due to various cardiovascular diseases including atherosclerosis (1-3). While many factors contribute to stiffening of arteries, aging is one of the most important causes (4). Presence of other conditions (e.g. systemic arterial hypertension), may exacerbate the process of arterial stiffening, independently or in conjunction with aging (4,5). Early detection of arterial stiffness could potentially impact the management and patient outcomes.
Currently, many techniques, both invasive (6-8) and non-invasive (9-11), are used clinically for the assessment of arterial stiffness, such as in the setting of systemic arterial hypertension. Techniques such as pulse tonometer, ultrasound-based and magnetic resonance imaging (MRI)-based measurement of pulse wave velocity (PWV) are commonly used methods among non-invasive modalities to estimate the stiffness of the aorta. These techniques provide indirect global measurements of stiffness (7,11-13). PWV measurement using pulse tonometer is based on peripheral pulse pressure, which is a poor reflection of central aortic pressure (11,14,15). Similarly, ultrasound-based and MR-based methods require estimation of aortic wall thickness and diameter for indirect measurement of aortic stiffness using Moens-Korteweg equation (11).
Magnetic resonance elastography (MRE) is a non-invasive phase contrast technique to determine stiffness by visualizing propagating waves in soft tissues (16-21). MRE is a three-stage process. In the first stage, vibrations are induced in the region of interest. Second, these vibrations are synchronized with the motion encoding gradients (MEG) to encode the external motion in the phase of an MR image, generating wave images. Finally, these wave images are mathematically converted to stiffness maps through a process known as inversion (16,22). Abdominal aortic MRE was initially described and used to compare aortic stiffness in the normotensive and hypertensive patients (3).
The aims of the study are to determine the correlations of both MRE-derived shear stiffness (μMRE) and MRI-based PWV shear stiffness (μPWV) measurements of the abdominal aorta in normal volunteers of varying ages and also to determine the correlation between μMRE and μPWV measurements.
Materials and Methods
In-vivo aortic MRE and MRI were performed on 21 healthy volunteers of age ranging from 18 to 65 years (average age: 36.5±15.3; male : female = 11 : 10) after approval of the institutional review board and obtaining written informed consent.
Image Acquisition
All imaging was performed using a commercially available 3 Tesla MRI system (TIM Trio, Siemens Healthcare, Erlangen, Germany). The volunteers were laid in the supine position and placed head first in the scanner. External vibrations were induced in the abdominal aorta using a pneumatic driver system by placing the passive driver just inferior to the xiphisternum as shown in figure 1 (3). The pneumatic driver system consists of two parts; an acoustic speaker also known as active driver, and a passive driver. The active driver is placed outside the scan room. The passive driver and active driver are connected through a plastic tube to send the 60Hz vibrations into the abdominal aorta as shown in figure 1.
Figure 1.
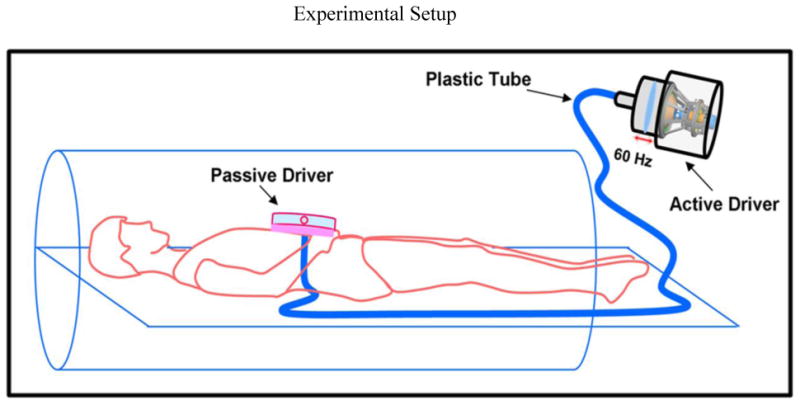
Schematic of the pneumatic driver system. Sound waves are non-invasively transmitted to the passive driver through the plastic tube and into the abdominal aorta.
Gradient recalled echo MRE (23) and phase contrast (PC)-MRI (24,25) sequences were performed to obtain wave and velocity data on the same sagittal slice of the aorta. The imaging parameters for MRE included: TE/TR = 21.3/25 ms, acquisition matrix = 128×64, FOV = 40 cm, slice thickness = 5 mm, flip angle = 16°, temporal resolution = 25ms, GRAPPA acceleration factor = 2 with 24 reference lines collected in the same scan and a MEG of 60Hz was applied separately in the x, y, and z direction. 4 MRE time offsets were collected to obtain the propagating waves in the aorta during a breathhold of 11 sec. The imaging parameters for the PC-MRI included: TE/TR = 2.1 /9.1 ms, venc = 150 cm/s, acquisition matrix = 192×144, FOV = 30×40 cm2, slice thickness = 5 mm, flip angle = 15°, number of cardiac phases = 128, GRAPPA acceleration factor = 2 with 24 reference lines collected in the same scan, number of averages = 2 and lines per segment = 15. PC-MRI images were acquired using retrospective gating under free breathing.
A T1-weighted–Sampling Perfection with Application of optimized Contrasts using different flip angle Evolution (T1w-SPACE) sequence (26) was performed to obtain high spatial resolution images to determine diameter and thickness of the abdominal aorta. The acquisition parameters for the T1w-SPACE included: TE/TR = 21/600 ms, echo spacing = 3.4 ms, FOV = 27.1×32 cm2, slice thickness = 1.1mm, acquisition matrix = 246×304, GRAPPA acceleration factor = 2 with 24 reference lines collected. The images were acquired using cardiac triggering and respiratory navigated acquisition. The heart rate during the above acquisitions for all the volunteers was in the range of 52-96 bpm.
Image Analysis
The sagittal images were masked to obtain the major portion of the abdominal aorta for both MRE and PC-MRI data analysis. However, the PC-MRI sagittal images were masked using a threshold limit to obtain the major portion of the abdominal (24), whereas in MRE the sagittal images were masked manually to obtain major portion of the abdominal aorta which included both the aortic wall and lumen (3). Then, MRE wave images were analyzed using MRE-Lab (Mayo Clinic, Rochester, MN) by applying local frequency estimation (LFE) inversion algorithm to obtain the shear stiffness of the aorta, μMRE (27,28). In LFE, the wave images were filtered using Butterworth band pass filter to remove the longitudinal component of motion and directionally filtered in 8 directions to remove the reflected waves (3). Then the first harmonic component of the displacement field was processed to obtain the stiffness map. Finally, an erode function in Matlab (Mathworks, Natic, MA) was used to erode the edges of the stiffness map by three pixels to avoid the errors at the edges caused by the MRE inversion algorithm. The mean effective shear stiffness and standard deviation (SD) were automatically calculated and reported using Matlab. Furthermore, additional MRE shear stiffness measurement was calculated by incorporating the thickness and inner radius of the abdominal as described by (29), which reported Et product, where E is the Young's modulus and t is the thickness of the aorta. In this study, E was converted to shear stiffness (μ) using equation 1 by assuming aorta (soft tissue) to be incompressible (i.e. Poisson's ratio (υ) = 0.5) and rewrote the equation to report μ instead of μt. Therefore, this new MRE shear stiffness measurement obtained by using thickness of the aorta is termed as μMREt.
| (1) |
The PC-MRI phase images were analyzed using custom-built software in Matlab to obtain the PWV measurements (5,24,30). In this process, first, the velocity profile is tracked along the major length of the aorta as shown in figure 2b. Second, the foot of the velocity profile is tracked at all locations along the length of the aorta. Figure 2(c, d) shows an example of the foot of the velocity profile tracked at locations in the aorta. Then the time taken by the foot of the velocity profile from one location to the other is tracked to plot the distance versus time; the slope of this plot provides the PWV. The detailed description of this PWV analysis was described elsewhere (24) in which the peak of the velocity profile was tracked, whereas the current method tracks the foot of the velocity profile. Furthermore, the high spatial resolution images were analyzed to determine diameter and thickness of the abdominal aorta at five different locations to obtain mean measurements, which were then plugged into Moens-Korteweg equation to estimate E. Then the Young's modulus was converted to shear stiffness as explained earlier to report μPWV.
Figure 2.
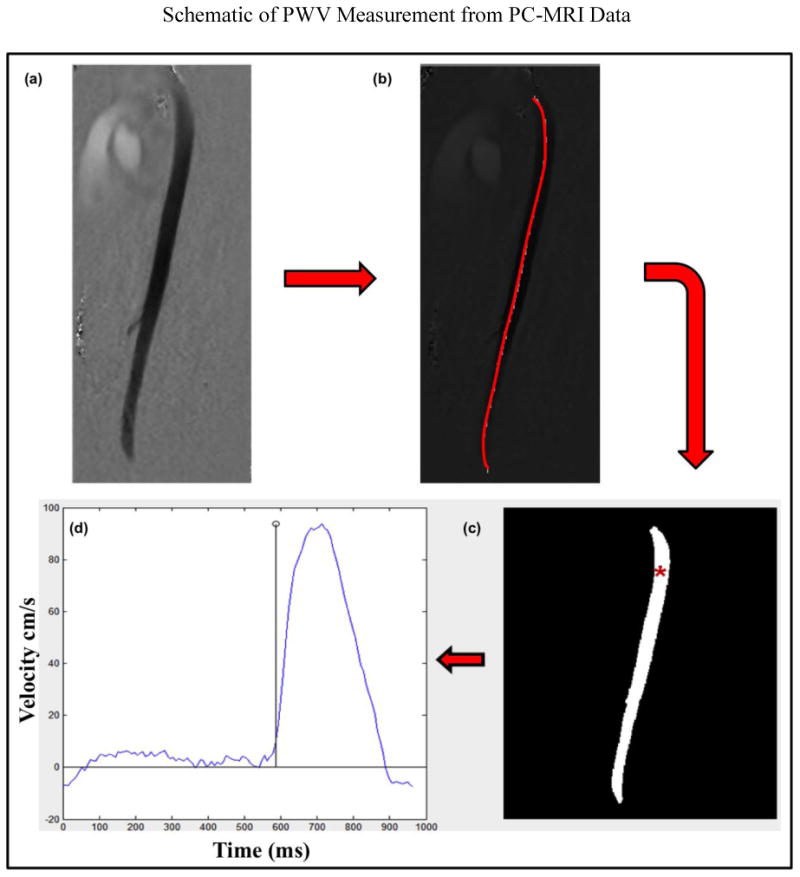
Shows the steps involved to estimate the PWV. (a) PC-MRI phase image at a particular phase of the cardiac cycle. (b) The red line indicates the major portion of the aorta that has been selected in the phase images of the PC-MRI data to determine the PWV. (c) Shows the foot of the velocity profile being tracked in the aorta with red asterisk showing an example at one of the locations. (d) Shows corresponding velocity profile at the asterisk location in one of the volunteers.
Statistical Analysis
A least squares linear regression was performed between μMRE and age; MRI-based PWV measurements and age; μPWV and age; μMRE and μMREt; μMRE and μPWV to determine the linear correlations. Analysis of variance (ANOVA) was performed using JMP10 (, SAS Institute Inc., Cary, NC) to test the linear association between the above described variables and a p-value <0.05 was considered to be significant. Volunteers were separated into two age group's i.e. young healthy volunteers (ages 18-40yrs) and old healthy volunteers (41-65yrs) based on previous studies (31-33). Student's t-test with unequal variance was performed to determine any significant difference (p<0.05) in μMRE between younger (ages 18-40yrs) and older healthy volunteers (ages 41-65yrs). Similarly, Student's t-test with unequal variance was performed to determine any significant difference (p<0.05) in MRI-based mean PWV values and in μPWV between younger (ages 18-40yrs) and older healthy volunteers (ages 41-65yrs).
Results
Greater mean aortic stiffness characterized old healthy volunteers. Figure 3 shows the magnitude image with a red contour delineating the abdominal aorta both in a younger healthy volunteer and an older healthy volunteer (a; g), as well as the corresponding snapshot of propagating in-plane waves (b-e; h-k) and MRE-weighted stiffness map from three encoding directions using the LFE inversion algorithm (f; l). The mean stiffness values in the younger volunteer and in the older volunteer shown in figure 3 were 4.0±0.9 kPa, and 7.4±2.1 kPa, respectively.
Figure 3.
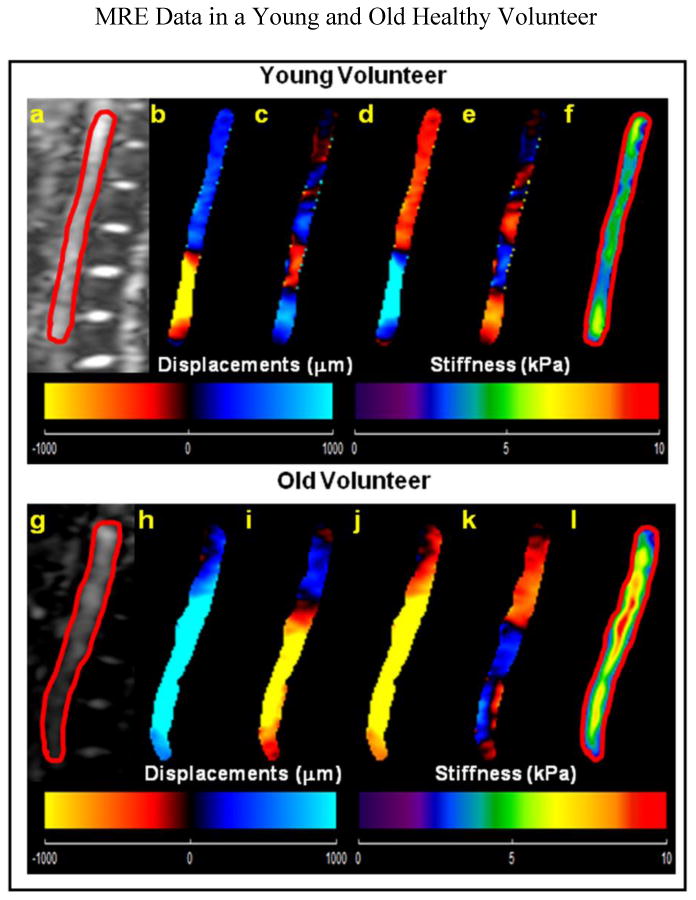
(a, g) Sagittal magnitude image with contour (red line) delineating the abdominal aorta in a young and in an old healthy volunteer respectively. Young Healthy Volunteer: (b–e): Snapshots of the four phases of the propagating waves. (f): The weighted stiffness map from x, y, and z encoding directions with a mean shear stiffness of 4.0±0.9 kPa. Old Healthy Volunteer: (h–k): Snapshots of the four phases of the propagating waves. (l): The weighted stiffness map from x, y, and z encoding directions with a mean shear stiffness of 7.4±2.1 kPa.
Greater aortic velocity also characterized old healthy volunteers. Figure 4 shows the plots of distance versus time of the foot of velocity profiles tracked in the aorta to estimate PWV in a younger healthy volunteer with a PWV of 4.15 m/s (a), and in an older healthy volunteer with a PWV of 6.96 m/s (b).
Figure 4.
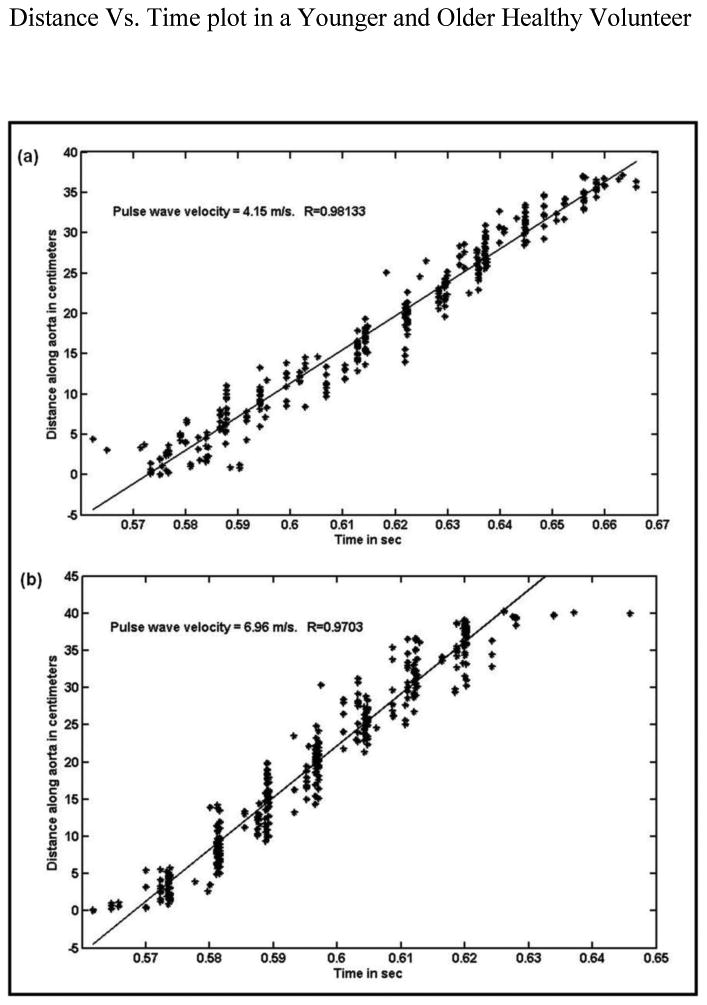
Plots of distance along the aorta (where foot of the velocity profile is tracked from one location to the other) as a function of time. (a) The slope from the plot provides PWV of 4.15m/s in a young healthy volunteer. (b): The slope from the plot provides PWV of 6.96m/s in an older healthy volunteer.
MRE-derived stiffness (μMRE) and PWV linearly increased with age. Figure 5(a) shows the plot of μMRE as a function of age, demonstrating linear correlation with an R2 value of 0.81, p<0.0001. Also from figure 5(a), we could clearly see the separation of stiffness values between young and old healthy volunteers indicated by red and green lines. Similarly, Figure 5(b) shows the plot of MRI-based PWV as a function of age with linear correlation of R2=0.65, p<0.0001 and a clear separation of PWV measurements between young and old healthy volunteers indicated by red and green lines. Figure 5(c) shows the plot of μPWV as a function of age with a linear correlation of R2=0.67, p<0.0001 and a clear separation of μPWV stiffness values indicated by red and green lines.
Figure 5.
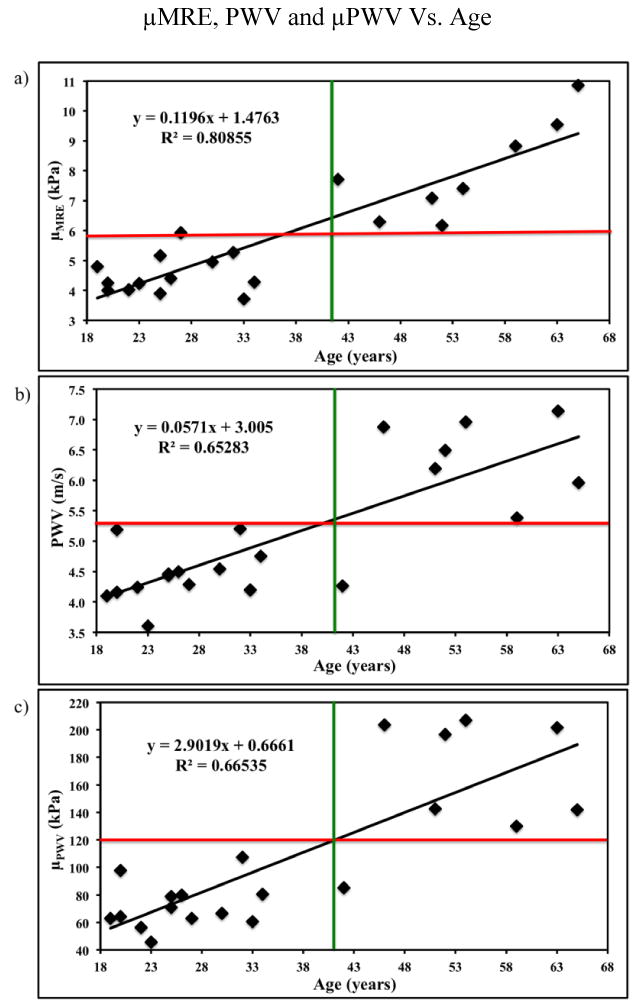
(a) Plot of MRE-derived stiffness (μMRE) as a function of age with a linear correlation of R2 value of 0.81. (b) Plot of MRI-based PWV as a function of age with a linear correlation of R2 value of 0.65. (c) Plot of the PWV based stiffness (μPWV) as a function of age with a linear correlation of R2 value of 0.67. The red and green lines show clear separation of stiffness measurements between young and old healthy volunteers.
Poor linear correlation was found between μMRE and μPWV, however, a very strong linear correlation was determined between μMRE and μMREt. Figure 6 shows the plot of μMRE and μPWV with a relative poor linear correlation of R2=0.43, p<0.001 in comparison to other R2 values. Figure 7 shows the plot of μMRE versus μMREt showing a very strong linear correlation of R2 = 0.95, p<0.0001. This correlation indicates that μMRE can be used as an indicator of measuring MRE-derived aortic stiffness, which does not require the measurements of inner radius and thickness of the aorta.
Figure 6.
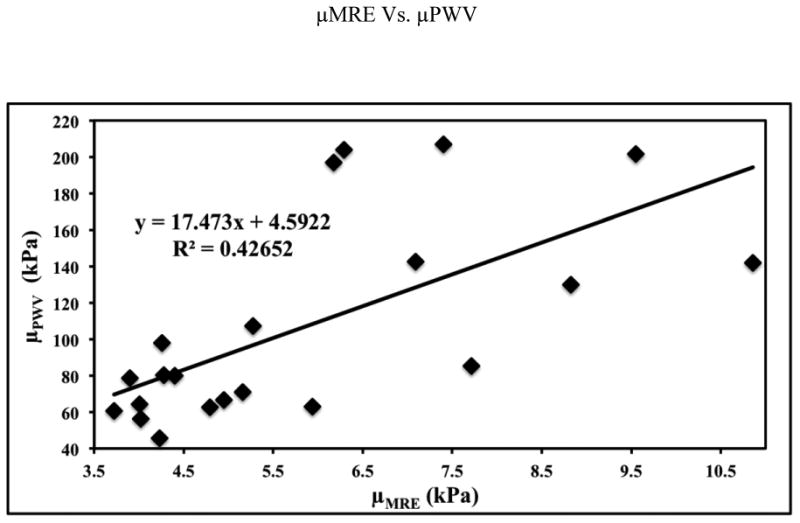
The plot of MRE-derived stiffness (μMRE) versus PWV based stiffness (μPWV) with a poor linear correlation of R2 value of 0.43.
Figure 7.
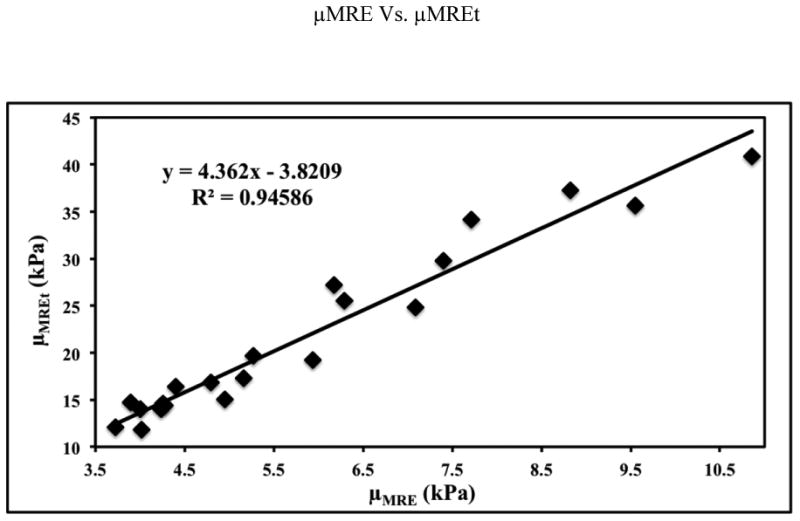
Plot of MRE-derived stiffness (μMRE) versus MRE shear stiffness measurement obtained by using thickness of the aorta (μMREt) demonstrating a very strong linear correlation of R2 value of 0.95.
The mean μMRE from all young healthy volunteers (4.5±0.6 kPa) is significantly lower (P=0.0004) than all old healthy volunteers (7.98±1.6kPa) (figure 8). Similarly, the mean MRI-based PWV from all young healthy volunteers (4.4 m/s) is significantly lower (P=0.001) than all old healthy volunteers (6.16 m/s) demonstrating significant difference (figure 8). The mean μPWV from all young healthy volunteers (71.8 kPa) is significantly lower (P=0.0005) than all old healthy volunteers (163.6 kPa) (figure 8).
Figure 8.
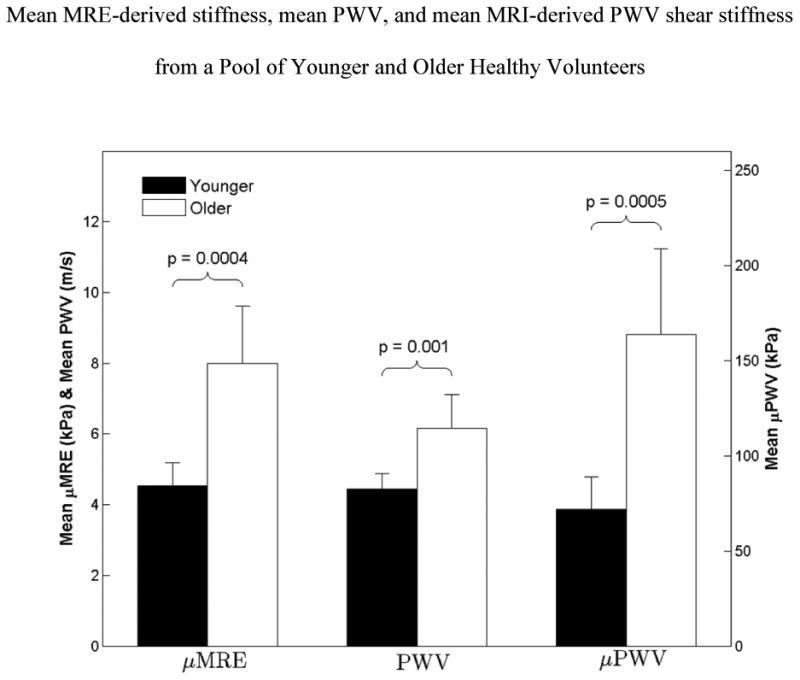
Box plot of mean MRE-derived shear stiffness (μMRE), mean PWV, and mean MRI-derived PWV shear stiffness (μPWV), from all young and old healthy volunteers with error bars representing one standard deviation. The mean μMRE measurement from all young healthy volunteers is significantly lower (p=0.0004) than that of old healthy volunteers. Similarly, the mean PWV and mean μPWV showed a significant difference of p≤0.001 between young and old healthy volunteers.
Discussion
This study demonstrates that μMRE, MRI-based PWV, μPWV increased linearly with increase in age and showed significant difference in μMRE, PWV, and μPWV between young (i.e. lower) and old healthy (i.e. higher) volunteers. A poor linear correlation was shown between μMRE and μPWV measurements.
The current MRE technique estimates the stiffness of the aorta based on the waveguide principle of propagation of external waves in the lumen, which was explained and validated earlier (1,3,29,34,35). We acknowledge that the shear waves are not supported by the fluids, however, because of the waveguide effect, when an aorta is vibrated; the aortic wall and the adjacent blood vibrate with the same frequency causing motion in the blood and are encoded by the MRE motion encoding gradients. Therefore, aortic wall and resulting motion of the adjacent blood in the lumen are used in the analysis of MRE. Hence, processing the waves in the lumen provides the stiffness map, which thus reflects the stiffness of the aortic wall. Therefore, eroding three pixels (described in image analysis section) at the edges should not affect our stiffness estimates, since we are measuring stiffness in the lumen.
Stiffness (i.e. square of the wave speed) of the aorta is frequency dependent because of the viscoelastic behavior. In our current study, external vibration was applied at 60Hz and the results agree with previously reported aortic stiffness measurements (3) in humans. While ex-vivo studies (1,35,36) performed in animal aortas have reported higher stiffness values; these studies differed in following aspects when compared to current study in 1) excitation frequencies (greater than or equal to 100Hz), 2) likely reflecting changes in the mechanical properties from formalin fixation.
The current study uses a MRI-based technique to determine the PWV of the aorta, so that MRE-derived stiffness measurements and PWV can be performed in the same scan. There are different ways to analyze the PC-MRI phase images to obtain PWV (24,36). However, in this study, the foot of the velocity profile was tracked along different locations of the aorta to obtain PWV (5,30). Clinically, PWV is measured using pulse tonometer (11) based on peripheral pulse pressure, which is a poor reflection of central aortic pressure. The current analysis to obtain PWV using MRI is consistent with previously published results (37,38). However, it is known that PWV is influenced by variation in the heart rate (39) and is usually higher in the old people; but in this study (i.e. in this small cohort of volunteers) we did not find any correlation in increase in heart rate with increase in age. Therefore, our PWV measurements are not influenced by heart rate; however, the measurements are influenced by the intrinsic changes in the aorta. The major advantage in this study is that MRE and MRI-based PWV were performed at the same time avoiding the influence of variation in physiologic conditions or other parameters on stiffness measurements.
MRE-derived shear stiffness and MRI-based PWV shear stiffness measurements demonstrated poor linear correlation, as the two techniques are different. As mentioned earlier, aorta is viscoelastic; stiffness and PWV are frequency dependent. MRE-derived stiffness measurements were obtained at 60Hz, whereas MRI-based PWV measurements were obtained approximately at 1Hz (i.e. heart cycle). Furthermore, Moens-Korteweg's equation (11) is required to indirectly estimate the global stiffness of the aorta from PWV, which requires diameter and thickness of the aorta as an input. As known, the thickness and diameter of the aorta varies spatially and requires high spatial resolution scans, and an error in estimation of these parameters can corrupt the stiffness estimates. Therefore, we have estimated radius and thickness of the aorta at five different locations to report the mean measurements and estimated the μPWV. However, both the methods (i.e. μMRE and μPWV) independently showed linear correlation with increase in age and also demonstrated significant difference in μMRE and μPWV measurements between young and old healthy volunteers. Moreover, μMRE measurements showed greater correlation with increase in age as compared to μPWV measurements.
There are several limitations in this study. MRE does not provide an absolute measure of aortic stiffness. Also, aortic MRE performed in this study is two dimensional and measured from single slice data. The wave propagation in the aorta is not planar which is associated with waveguide effect based on geometry of the aorta; therefore, would require three-dimensional (3D) data to estimate the true stiffness of the aorta. 3D volumetric data or 2D multi-slice data acquisition with isotropic resolution requires longer scan time and might become difficult for the patient to tolerate. Furthermore, μMRE estimates obtained from all volunteers are averaged across the cardiac cycle. It would be useful to measure stiffness during the diastolic and systolic phase of the cardiac cycle using a cardiac gated MRE sequence to determine the influence of pressure on stiffness estimates. Despite these limitations, μMRE increased linearly with age and demonstrated good correlation as function of age and showed significant difference in μMRE stiffness between young and old healthy volunteers as demonstrated by μPWV measurements.
Future work will incorporate 3D data acquisition using a navigator based MRE sequence, which is currently under investigation to perform 3D inversion to obtain stiffness of the aorta. Furthermore, a cardiac gated sequence is also being investigated to estimate the stiffness of the aorta at different phases of the cardiac cycle to determine the influence of pressure on stiffness. Additionally, more studies will be performed in different aortic disease states such as aortic aneurysm, cystic medial necrosis (e.g. Marfan syndrome), hypertension etc. to establish the validity of MRE technique by comparing against current clinical standard techniques.
In conclusion, we have demonstrated that MRE-derived shear stiffness values, MRI-based PWV, and MRI-based PWV shear stiffness measurements increased linearly with increase in age. Additionally, we showed significant difference in MRE-derived stiffness, MRI-based PWV, and MRI-based PWV shear stiffness measurements between young and old healthy volunteers. However, a poor linear correlation was observed between μMRE and μPWV stiffness values.
Acknowledgments
Grant Support: This work has been supported by American Heart Association, Grant # 13SDG14690027 and Center for Clinical & Translational Sciences, Grant # UL1TR000090.
Footnotes
Primary author: Anirudh R. Damughatla
References
- 1.Woodrum DA, Herrmann J, Lerman A, Romano AJ, Lerman LO, Ehman RL. Phase-contrast MRI-based elastography technique detects early hypertensive changes in ex vivo porcine aortic wall. J Magn Reson Imaging. 2009;29(3):583–587. doi: 10.1002/jmri.21702. [DOI] [PMC free article] [PubMed] [Google Scholar]
- 2.Cecelja M, Chowienczyk P. Dissociation of Aortic Pulse Wave Velocity With Risk Factors for Cardiovascular Disease Other Than Hypertension A Systematic Review. Hypertension. 2009;54(6):1328–U1103. doi: 10.1161/HYPERTENSIONAHA.109.137653. [DOI] [PubMed] [Google Scholar]
- 3.Kolipaka A, Woodrum D, Araoz PA, Ehman RL. MR elastography of the in vivo abdominal aorta: a feasibility study for comparing aortic stiffness between hypertensives and normotensives. J Magn Reson Imaging. 2012;35(3):582–586. doi: 10.1002/jmri.22866. [DOI] [PMC free article] [PubMed] [Google Scholar]
- 4.Agabiti-Rosei E, Porteri E, Rizzoni D. Arterial stiffness, hypertension, and rational use of nebivolol. Vasc Health Risk Manag. 2009;5(1):353–360. doi: 10.2147/vhrm.s3056. [DOI] [PMC free article] [PubMed] [Google Scholar]
- 5.Laurent S, Cockcroft J, Van Bortel L, et al. Expert consensus document on arterial stiffness: methodological issues and clinical applications. European Heart Journal. 2006;27(21):2588–2605. doi: 10.1093/eurheartj/ehl254. [DOI] [PubMed] [Google Scholar]
- 6.Patel DJ, Janicki JS, Carew TE. Static anisotropic elastic properties of the aorta in living dogs. Circ Res. 1969;25(6):765–779. doi: 10.1161/01.res.25.6.765. [DOI] [PubMed] [Google Scholar]
- 7.Slordahl SA, Piene H, Linker DT, Vik A. Segmental Aortic-Wall Stiffness from Intravascular Ultrasound at Normal and Subnormal Aortic Pressure in Pigs. Acta Physiologica Scandinavica. 1991;143(3):227–232. doi: 10.1111/j.1748-1716.1991.tb09226.x. [DOI] [PubMed] [Google Scholar]
- 8.Ferguson JJ, Julius S, Randall OS. Stroke volume--pulse pressure relationships in borderline hypertension: a possible indicator of decreased arterial compliance. J Hypertens Suppl. 1984;2(3):S397–399. [PubMed] [Google Scholar]
- 9.Vappou J, Luo J, Konofagou EE. Pulse wave imaging for noninvasive and quantitative measurement of arterial stiffness in vivo. American Journal of Hypertension. 2010;23(4):393–398. doi: 10.1038/ajh.2009.272. [DOI] [PMC free article] [PubMed] [Google Scholar]
- 10.Gang G, Mark P, Cockshott P, et al. Measurement of pulse wave velocity using magnetic resonance imaging. Proceedings of the 26th Annual International Conference of the Ieee Engineering in Medicine and Biology Society, Vols 1-7. 2004;26:3684–3687. doi: 10.1109/IEMBS.2004.1404035. [DOI] [PubMed] [Google Scholar]
- 11.DeLoach SS, Townsend RR. Vascular stiffness: its measurement and significance for epidemiologic and outcome studies. Clin J Am Soc Nephrol. 2008;3(1):184–192. doi: 10.2215/CJN.03340807. [DOI] [PubMed] [Google Scholar]
- 12.Rezai MR, Wallace AM, Sattar N, Finn JD, Wu FCW, Cruickshank JK. Ethnic Differences in Aortic Pulse Wave Velocity Occur in the Descending Aorta and May Be Related to Vitamin D. Hypertension. 2011;58(2):247–U231. doi: 10.1161/HYPERTENSIONAHA.111.174425. [DOI] [PubMed] [Google Scholar]
- 13.Rezai MR, Anderson SG, Sattar N, Finn J, Wu F, Cruickshank JK. Ethnic differences in aortic pulse wave velocity occur in the descending aorta independent of blood pressure and may be related to vitamin D. Journal of Human Hypertension. 2011;25(10):632–633. doi: 10.1161/HYPERTENSIONAHA.111.174425. [DOI] [PubMed] [Google Scholar]
- 14.Lehmann ED. Clinical value of aortic pulse-wave velocity measurement. Lancet. 1999;354(9178):528–529. doi: 10.1016/S0140-6736(99)00179-8. [DOI] [PubMed] [Google Scholar]
- 15.Karamanoglu M, Orourke MF, Avolio AP, Kelly RP. An Analysis of the Relationship between Central Aortic and Peripheral Upper Limb Pressure Waves in Man. European Heart Journal. 1993;14(2):160–167. doi: 10.1093/eurheartj/14.2.160. [DOI] [PubMed] [Google Scholar]
- 16.Muthupillai R, Lomas DJ, Rossman PJ, Greenleaf JF, Manduca A, Ehman RL. Magnetic resonance elastography by direct visualization of propagating acoustic strain waves. Science. 1995;269(5232):1854–1857. doi: 10.1126/science.7569924. [DOI] [PubMed] [Google Scholar]
- 17.Dresner MA, Rose GH, Rossman PJ, Muthupillai R, Manduca A, Ehman RL. Magnetic resonance elastography of skeletal muscle. Journal of Magnetic Resonance Imaging. 2001;13(2):269–276. doi: 10.1002/1522-2586(200102)13:2<269::aid-jmri1039>3.0.co;2-1. [DOI] [PubMed] [Google Scholar]
- 18.Sinkus R, Siegmann K, Xydeas T, Tanter M, Claussen C, Fink M. MR elastography of breast lesions: Understanding the solid/liquid duality can improve the specificity of contrast-enhanced MR mammography. Magnetic Resonance in Medicine. 2007;58(6):1135–1144. doi: 10.1002/mrm.21404. [DOI] [PubMed] [Google Scholar]
- 19.Yin M, Talwalkar JA, Glaser KJ, et al. Assessment of hepatic fibrosis with magnetic resonance elastography. Clin Gastroenterol Hepatol. 2007;5(10):1207–1213. e1202. doi: 10.1016/j.cgh.2007.06.012. [DOI] [PMC free article] [PubMed] [Google Scholar]
- 20.Sack I, Beierbach B, Hamhaber U, Klatt D, Braun A. Non-invasive measurement of brain viscoelasticity using magnetic resonance elastography. Nmr in Biomedicine. 2008;21(3):265–271. doi: 10.1002/nbm.1189. [DOI] [PubMed] [Google Scholar]
- 21.Kolipaka A, Araoz PA, Mcgee KP, Manduca A, Ehman RL. Magnetic Resonance Elastography as a Method for the Assessment of Effective Myocardial Stiffness Throughout the Cardiac Cycle. Magnetic Resonance in Medicine. 2010;64(3):862–870. doi: 10.1002/mrm.22467. [DOI] [PMC free article] [PubMed] [Google Scholar]
- 22.Mariappan YK, Glaser KJ, Ehman RL. Magnetic resonance elastography: a review. Clin Anat. 2010;23(5):497–511. doi: 10.1002/ca.21006. [DOI] [PMC free article] [PubMed] [Google Scholar]
- 23.Mazumder R, Raterman B, Jin N, et al. Rapid Acquisition Technique for MR Elastography of the Liver. Proceedings of the Radiological Society of North America 2012 Scientific Assembly and Annual Meeting; Chicago IL. 2012. [Google Scholar]
- 24.Giri SS, Ding Y, Nishijima Y, et al. Automated and Accurate Measurement of Aortic Pulse Wave Velocity Using Magnetic Resonance Imaging. Computers in Cardiology 2007. 2007;1 and 2:661–664. [Google Scholar]
- 25.Lotz J, Meier C, Leppert A, Galanski M. Cardiovascular flow measurement with phase-contrast MR imaging: basic facts and implementation. Radiographics. 2002;22(3):651–671. doi: 10.1148/radiographics.22.3.g02ma11651. [DOI] [PubMed] [Google Scholar]
- 26.Mihai G, Chung YC, Merchant A, Simonetti OP, Rajagopalan S. T1-weighted-SPACE dark blood whole body magnetic resonance angiography (DB-WBMRA): initial experience. J Magn Reson Imaging. 2010;31(2):502–509. doi: 10.1002/jmri.22049. [DOI] [PubMed] [Google Scholar]
- 27.Manduca A, Lake DS, Kruse SA, Ehman RL. Spatio-temporal directional filtering for improved inversion of MR elastography images. Med Image Anal. 2003;7(4):465–473. doi: 10.1016/s1361-8415(03)00038-0. [DOI] [PubMed] [Google Scholar]
- 28.Manduca A, Oliphant TE, Dresner MA, et al. Magnetic resonance elastography: non-invasive mapping of tissue elasticity. Med Image Anal. 2001;5(4):237–254. doi: 10.1016/s1361-8415(00)00039-6. [DOI] [PubMed] [Google Scholar]
- 29.Woodrum DA, Romano AJ, Lerman A, et al. Vascular wall elasticity measurement by magnetic resonance imaging. Magn Reson Med. 2006;56(3):593–600. doi: 10.1002/mrm.20991. [DOI] [PubMed] [Google Scholar]
- 30.Bolster BD, Atalar E, Hardy CJ, McVeigh ER. Accuracy of arterial pulse-wave velocity measurement using MR. Jmri-Journal of Magnetic Resonance Imaging. 1998;8(4):878–888. doi: 10.1002/jmri.1880080418. [DOI] [PMC free article] [PubMed] [Google Scholar]
- 31.Sugawara J, Hayashi K, Tanaka H. Distal shift of arterial pressure wave reflection sites with aging. Hypertension. 2010;56(5):920–925. doi: 10.1161/HYPERTENSIONAHA.110.160549. [DOI] [PMC free article] [PubMed] [Google Scholar]
- 32.Determinants of pulse wave velocity in healthy people and in the presence of cardiovascular risk factors: ‘establishing normal and reference values’. Eur Heart J. 2010;31(19):2338–2350. doi: 10.1093/eurheartj/ehq165. [DOI] [PMC free article] [PubMed] [Google Scholar]
- 33.Bia D, Zocalo Y, Farro I, et al. Integrated Evaluation of Age-Related Changes in Structural and Functional Vascular Parameters Used to Assess Arterial Aging, Subclinical Atherosclerosis, and Cardiovascular Risk in Uruguayan Adults: CUiiDARTE Project. Int J Hypertens. 2011;2011 doi: 10.4061/2011/587303. 587303. [DOI] [PMC free article] [PubMed] [Google Scholar]
- 34.Xu L, Chen J, Glaser KJ, Yin M, Rossman PJ, Ehman RL. MR elastography of the human abdominal aorta: A preliminary study. J Magn Reson Imaging. 2013 doi: 10.1002/jmri.24056. [DOI] [PMC free article] [PubMed] [Google Scholar]
- 35.Xu L, Chen J, Yin M, et al. Assessment of stiffness changes in the ex vivo porcine aortic wall using magnetic resonance elastography. Magnetic Resonance Imaging. 2012;30(1):122–127. doi: 10.1016/j.mri.2011.09.009. [DOI] [PMC free article] [PubMed] [Google Scholar]
- 36.Davies JI, Struthers AD. Pulse wave analysis and pulse wave velocity: a critical review of their strengths and weaknesses. Journal of Hypertension. 2003;21(3):463–472. doi: 10.1097/00004872-200303000-00004. [DOI] [PubMed] [Google Scholar]
- 37.Li RX, Luo J, Balaram SK, et al. In-vivo Pulse Wave Imaging for arterial stiffness measurement under normal and pathological conditions. Conf Proc IEEE Eng Med Biol Soc. 2011;2011:567–570. doi: 10.1109/IEMBS.2011.6090105. [DOI] [PubMed] [Google Scholar]
- 38.Li RX, Luo JW, Khamdaeng T, Konofagou EE. Pulse Wave Imaging (PWI) and Arterial Stiffness Measurement of the Human Carotid Artery: An In Vivo Feasibility Study. 2011 Ieee International Ultrasonics Symposium (Ius) 2012:1778–1781. [Google Scholar]
- 39.Lantelme P, Mestre C, Lievre M, Gressard A, Milon H. Heart rate: an important confounder of pulse wave velocity assessment. Hypertension. 2002;39(6):1083–1087. doi: 10.1161/01.hyp.0000019132.41066.95. [DOI] [PubMed] [Google Scholar]