Abstract
Active pharmaceutical ingredients (APIs) are the molecular entities that exert the therapeutic effects of medicines. This article provides an overview of the major APIs that are entered into antiretroviral therapy (ART), outlines how APIs are manufactured, and examines the regulatory and cost frameworks of manufacturing ART APIs used in low- and middle-income countries (LMICs). Almost all APIs for ART are prepared by chemical synthesis. Roughly 15 APIs account for essentially all of the ARTs used in LMICs. Nearly all of the ART APIs purchased through the Global Fund for AIDS, TB and Malaria (GFATM) or the United States President’s Emergency Plan for AIDS Relief (PEPFAR) are produced by generic companies. API costs are very important because they are the largest contribution to the overall cost of ART. Efficient API production requires substantial investment in chemical manufacturing technologies and the ready availability of raw materials and energy at competitive prices. Generic API production is practiced in only a limited number of countries; the API market for ART is dominated by Indian companies. The quality of these APIs is ensured by manufacturing under good manufacturing practice (GMP), including process validation, testing against previously established specifications and the demonstration of clinical bioequivalence. The investment and personnel costs of a quality management system for GMP contribute significantly to the cost of API production. Chinese companies are the major suppliers for many advanced intermediates in API production. Improved chemistry of manufacturing, economies of scale and optimization of procurement have enabled drastic cost reductions for many ART APIs. The available capacity for global production of quality-assured APIs is likely adequate to meet forecasted demand for 2015. The increased use of ART for paediatric treatment, for second-line and salvage therapy, and the introduction of new APIs and combinations are important factors for the future of treatment in LMICs. The introduction of new fixed-dose combinations for ART and use of new drug delivery technologies could plausibly provide robust, durable ART for all patients in need, at an overall cost that is only moderately higher than what is presently being spent.
Description and significant APIs for ART
A medicine is often defined as any substance or substances used in the treatment, diagnosis, prevention, mitigation or cure of a disease. Drug molecules that exert a biological effect for disease treatment are known as active pharmaceutical ingredients (APIs). The number of APIs approved for the treatment of any human disease is relatively small. The various major pharmacopoeial compendia – including the International, European, US or British versions – list fewer than 2,000 different APIs for human use. With the recent approval in August 2013 of dolutegravir (DVG) by the United States Food and Drug Administration (USFDA) there are 27 APIs marketed for the treatment of HIV or AIDS. A distinction must be made between APIs and the forms in which they are delivered to the patient. Various additional ingredients known as excipients are always processed or formulated in combination with APIs to manufacture a finished pharmaceutical product (FPP). APIs are formulated in order to assure their stability or shelf-life and uniformity of dosing, to enhance patient compliance and to maximize therapeutic efficacy by assuring the reproducibility of dissolution, absorption and bioavailablity. APIs are sold in bulk rather than in individual dosing units. The volume demand of APIs is determined in kilograms or metric tons and their pricing is quoted on the same basis. The volume demand of FPPs is determined in unit doses or patient-years and the pricing of FPPs is on a per-patient-per-year (PPPY) basis. It can be difficult to translate the cost of an FPP backwards into API pricing, particularly when – as is the case with most antiretroviral therapies (ARTs) – multiple drugs are combined in a single FPP as fixed-dose combinations (FDCs). API manufacturers do not publicly disclose their API pricing for several reasons. Production costs for APIs vary significantly with the costs of energy, solvents, labour, capital investment and raw materials (RMs). Economy of scale is also important; a manufacturing facility needs to be operating at close to its full capacity to minimize operating costs. Some API manufacturers also produce FPPs, although many FPP producers purchase APIs from vendors. Companies that manufacture both APIs and FPPs possess a competitive market advantage because one commercial transaction has been removed from the supply chain for ART production.
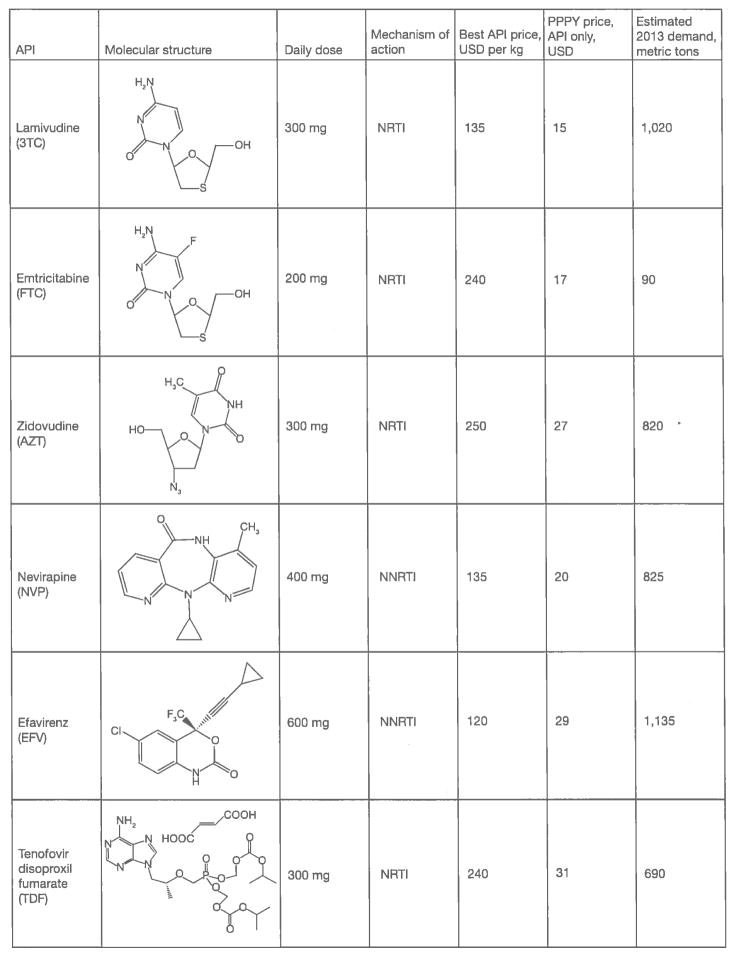
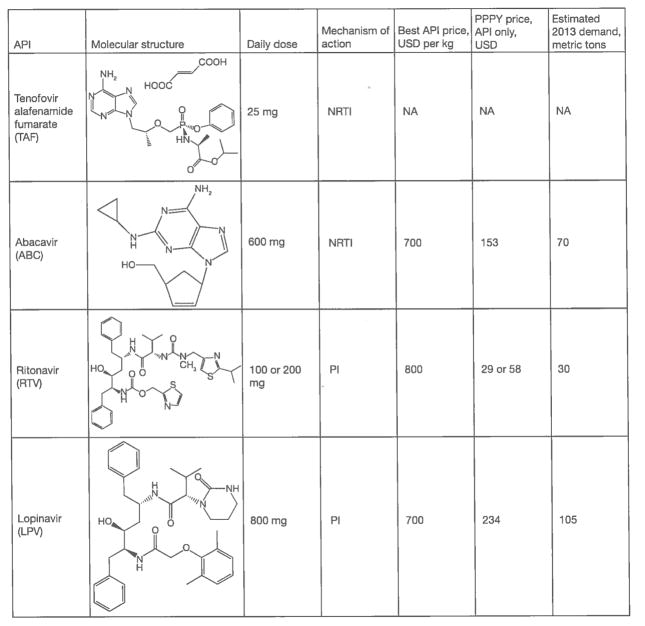
Effective chemotherapy for HIV consists of FDCs containing at least three different APIs. First-line HIV therapy for adults in low- and middle-income countries (LMICs) consists almost entirely of six FDCs; these FDC products contain a total of six different APIs. Figure 1 provides information on these APIs relevant to this survey, including the best available estimates of annual demand and per-kilogram pricing, molecular structure and shorthand abbreviation by which these APIs are commonly referred to. Each of these six APIs targets the single enzyme HIV-1 reverse transcriptase (RT) as a means of attacking HIV viral replication. These six FDCs are: zidovudine (AZT)/lamivudine (3TC)/nevirapine (NVP); tenofovir disoproxil fumarate (TDF)/3TC (or emtricitabine [FTC])/NVP (for patients who cannot take AZT); TDF/3TC (or FTC)/efavirenz (EFV) and AZT/3TC/EFV (for patients who cannot take TDF).
Figure 1.
Significant antiretroviral therapy APIs for low- and middle-income countries
API, active pharmaceutical ingredient; NNRTI, non-nucleoside/nucleotide reverse transcriptase inhibitor; NRTI, nucleoside/nucleotide reverse transcriptase inhibitor; PI, protease inhibitor; PPPY, per-patient-per-year.
Each of these FDCs contains two nucleoside/nucleotide reverse transcriptase inhibitors (NRTIs) and one non-nucleoside/nucleotide reverse transcriptase inhibitor (NNRTI) of HIV-1 RT. NVP and EFV are the two NNRTIs currently used in first-line ART. At the present time more patients are taking ART containing NVP than EFV. UNAIDS/WHO Treatment 2.0 programmatic approach that emphasizes the utility of ‘one pill, once-a-day’ for ART is partly responsible for an ongoing shift of patients from first-line ARTs containing NVP to those containing EFV. This shift is expected to accelerate during 2014 and to result in most patients being treated with EFV-based ART.
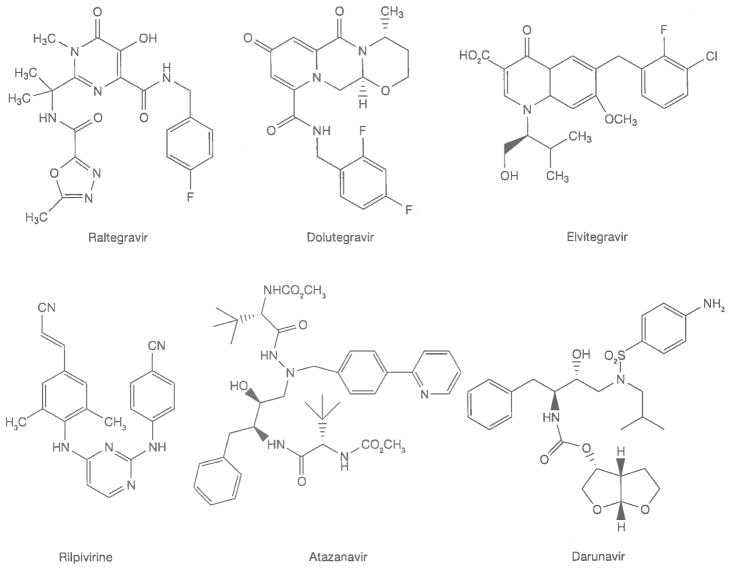
With the pending phase-out of stavudine (d4T) [1], six APIs – 3TC, AZT, EFV, FTC, NVP and TDF account for roughly 95% of the volume of HIV drugs used in LMICs. Other significant drugs for LMICs include the protease inhibitors lopinavir (LPV) and ritonavir (RTV) and the NRTI abacavir (ABC) for second-line and paediatric treatment. Rilpivirine (RPV), atazanavir (ATV), darunavir (DRV), DVG, elvitegravir (EVG) and raltegravir (RGV) are potentially important drugs that are not yet widely used in LMICs (Figure 2). The complexity of synthesizing these APIs, as well as their limited volume demand, causes them to be much more expensive than APIs used heavily in first-line ART at this time.
Figure 2.
Important antiretroviral active pharmaceutical ingredients that are not frequently used in low- or middle-income countries
Important factors for API production
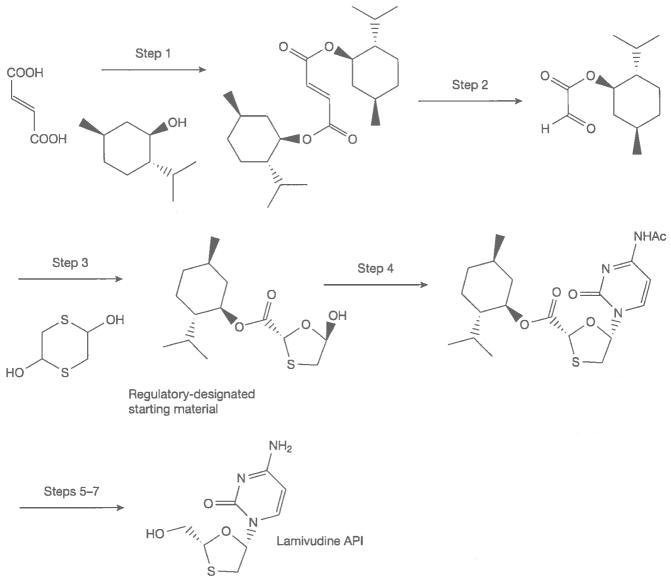
Ideally, the chemical synthesis of APIs begins from simple, inexpensive building blocks or RMs that are used for multiple purposes and are available in the fine chemicals industry, though some require uncommon RMs that contribute significantly to API manufacturing cost. RMs are converted into APIs by multi-step processes of breaking old chemical bonds and making new ones. A synthesis of 3TC is shown in Figure 3 [2]. In the seven-step sequence, six steps involve breaking existing chemical bonds and creating new ones to build the molecular architecture of the API. The final recrystallization of an API is a critical step; at this stage the crystalline form of the API is determined and related substances (impurities) are removed or reduced to acceptable levels. APIs are often milled in a final step so that their particle size distribution (PSD) falls within specified limits. The crystalline form and PSD of an API must be controlled, because these properties are often critical to the formulation, dissolution, absorption and bioavailability of a drug. Bioavailability is the fraction of a drug dose that reaches systemic circulation (that is, is present in blood plasma) after administration [3]. By definition, a drug is 100% bioavailable when administered by injection; drugs for ART are taken every day and administration by injection is not possible.
Figure 3.
Chemical synthesis of the API lamivudine
API, active pharmaceutical ingredient.
The cost of ART is absolutely critical to ensuring access in LMICs. The cost of manufacturing an API is dependent upon the cost of RMs, the cost of overheads and labour (OHL) and volume demand for the product. OHL includes the capital investment to build a manufacturing facility and operating costs, including personnel and energy, waste disposal and the eventual cost of decommissioning of the facility. Increased volume demand generally decreases the cost contribution of RM and OHL. Substantial production volumes are required to obtain full economy of scale [4]. Producing 1–5 metric tons per year is substantially more expensive per kilogram than producing 100 metric tons of an API. There is a practical limit of approximately 50–100 metric tons/year beyond which cost reductions are modest with increased volume, but this practical limit refers to the volumes of drug manufactured in any single manufacturing plant. Exceptions to these generalizations do occur, most often when demand exceeds either the existing manufacturing capacity for a specific API or the availability of critical RMs [5]. Exceptions that have occurred include shortages of β-thymidine for producing AZT and a squeeze on the availability and price of adenine as a starting material for TDF. Another contributor to RM and OHL costs is the efficiency of a chemical synthesis. Since operating costs for a manufacturing facility may be USD2,000/h, the number of steps or processing time for a chemical synthesis affects manufacturing cost. The efficiency of a synthesis is often quoted as an E-factor [6] representing the kilograms of waste produced per kilogram of product manufactured. Waste management is expensive in chemical manufacturing wherever environmental guidelines are both reasonable and followed. From a slightly different perspective, increasing the overall yield of an API synthesis reduces RM use and associated cost for manufacturing.
When a commercial market already exists for the RMs used in synthesizing an API, their cost can be rather modest. When RMs used in synthesizing an API have no other commercial use, however, they can contribute very substantially to API cost. With a continued growth of volume demand, improved chemistry and competition from multiple suppliers, however, the cost of API RMs can greatly decrease over time. The inhibitor of HIV-1 RT, EFV, provides an illustration of this situation. Cyclopropylacetylene (CPA) is an RM for the synthesis of EFV (Figure 4). During clinical trials, when the demand for CPA was only a few metric tons, this material was produced at a price of USD800–1,350/kg. When the drug was first approved in 1998, and demand for CPA was about 50 metric tons per year, the price of CPA had fallen to USD350/kg. Today, with global demand for EFV at greater than 1,000 metric tons/year, CPA can be purchased for about USD50–60/kg. In the earliest stages of production, nearly 1 kg of CPA was needed to produce a kilogram of EFV. Current production processes are more efficient; roughly 3 kg of EFV is now produced for each 1 kg of CPA used. From this it can be roughly estimated that the contribution of CPA to the cost of EFV API production has fallen from as high as USD425/kg to about USD17–20/kg today.
Figure 4.

Key raw materials for the synthesis of efavirenz
FPPs for adult ART are usually capsules or tablets. A general rule-of-thumb is that an FPP as a conventional, solid oral dosage formulation costs about 33–40% more than the corresponding API in a competitive market. It has been widely quoted, conversely, that APIs contribute about 60–80% of the cost of an FPP. The API contribution to FPP cost increases with the complexity of synthesis and API cost per kilogram. Although marketing is a substantial incremental cost for originator pharmaceutical companies, generic producers do not incur high marketing costs for ART.
Control elements for API manufacturing: quality assurance and good manufacturing practice
The quality, safety, efficacy, purity, potency and reproducibility of medicinal products are assured in part by the control and regulation of API production. It is a fundamental principle that ART must meet strict regulatory authority (SRA) requirements as an element of assuring quality. The major SRAs that regulate antiretrovirals (ARVs) for LMICs are the World Health Organization Pre-Qualification Program (WHO PQP) and the USFDA for United States President’s Emergency Plan for AIDS Relief (PEPFAR). The main issues for controlling APIs are: manufacturing under good manufacturing practice (GMP), setting responsible limits on individual and total impurities, specifying physicochemical properties in crystalline form and PSD, to assure reproducibility, stability and dissolution, and demonstration of bio-equivalence of the FPP with an appropriate comparator product. Bioequivalence means that the same API contained in two different drug products has the same rate and extent of absorption [2].
The International Conference on Harmonisation of Technical Requirements for Registration of Pharmaceuticals for Human Use [7] maintains the most comprehensive guidelines on GMP for assuring the quality of medicinal products. The WHO PQP approves products for purchase on the basis of reviewing a written dossier that describes in detail the manufacturing process, in-process controls and product specifications, on-site inspections to assure GMP adherence at production sites and demonstration of FPP bioequivalence with an appropriate comparator product [8]. This is the same for the global process for generic drug approvals in which quality is assured by each individual manufacturer, while safety and efficacy are assured by comparison against the originator product.
GMP principles for API production are applied from the earliest appropriate step for controlling impurities that may be present in the API [9]. The designation of ‘API starting materials’ is very important because manufacturing under GMP controls is significantly more expensive than otherwise. Most companies prefer to purchase all non-GMP materials from external sources and to perform all GMP manufacturing in-house to manage their regulatory burden.
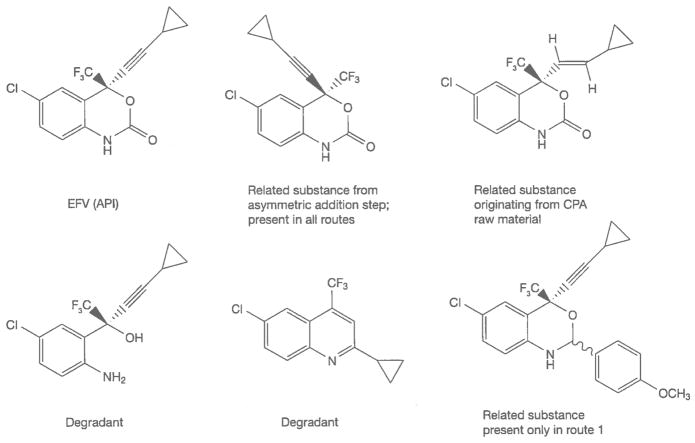
The safety of an API is dependent upon both the inherent toxicity of the drug molecule and the toxicity of impurities that are present in the FPP. Impurities in an FPP can be present from the route of synthesis of the API or from decomposition or degradation. Degradants are often present in the API and levels will likely increase over time in an FPP. Acceptable levels of impurities and degradants are published in drug ‘monographs’ that provide a comprehensive description of the acceptable properties, tests and limits for specific APIs and FPPs [10]. Generic API producers often do not know the acceptable limits for impurities in an API or an FPP unless a drug monograph has been published in a pharmacopoeial compendium from the WHO, US Pharmacopeia or others. Alternatively, this information may be provided to a generic manufacturer under a licensing agreement from the originator company, or through the Médecins sans Frontières Patent Pool [11]. Changing the route of synthesis often changes the profile of impurities present in an API. This can be a significant safety concern if new impurities are introduced, or if existing impurities are present at levels that were not justified in safety studies. A partial listing of the possible impurities present in EFV – and their origins as related substances from multiple routes of synthesis or as degradants is shown in Figure 5 [12].
Figure 5.
Related substances and degradants (partial listing) in EFV
API, active pharmaceutical ingredient; CPA, cyclopropylacetylene; EFV, efavirenz
FPP producers must reference considerable information about API manufacturing in their regulatory submissions. API manufacturers generally submit a drug master file (DMF) to regulatory agencies that provides important information like route of synthesis, in-process tests and limits, API specifications and test methods about API production [13]. DMFs contain ‘open’ and ‘closed’ sections. The open section of a DMF should contain sufficient information for an FPP manufacturer to assess whether the API is suitable for their production process. The closed section of a DMF is provided only to regulatory agencies and protects sensitive information that is proprietary to the API manufacturer. The open sections of DMFs, however, often lack information about the crystalline form and PSD of APIs. These API attributes are very often critical to assure bioequivalence for ART drugs with limited aqueous solubility or poor or variable absorption characteristics. RTV is one such API. The correct crystalline form of RTV is absolutely critical for dissolution and bioavailability. A second crystal Form or polymorph (Form II) of RTV has a bioavailability of only 1% relative to Form I. The unexpected appearance of a Form II polymorph of RTV during API manufacturing caused such problems that Abbott Laboratories for a time removed RTV capsules from the market due to the risk of otherwise providing unacceptable product to patients because of low bioavailability [14].
The production chain – countries/regions where ARV APIs are produced and capacity
Many regions of the world are not able to manufacture quality-assured APIs at competitive prices. Economies of scale, the ready availability of RMs, freedom to operate without patent restrictions, a trained workforce with the necessary skills, reliable sources of energy at reasonable cost, a progressive system of managing capital investment, and the ability to design and construct chemical manufacturing plants are important in the successful manufacture of APIs.
Originator pharmaceutical companies very often make their own APIs; however, they are not API suppliers. Selling APIs encourages generic competition, but it does not fit in originators’ business models. Originator companies are also not strongly motivated to drive down API costs because these are only a minor component of their selling price for FPPs. Originator companies are rarely able to compete with generic companies on API pricing [15]. The authors of this paper are not aware of a single instance in which an originator company has provided its API to a generic company for producing ARTs. There are instances, however, in which generic companies become API providers to originator companies for their markets.
Because of the many requirements for GMP and competitive pricing, relatively few generic companies submit DMFs to support the use of their antiretroviral APIs in SRA-approved products. There are, for instance, over 100 SRA-approved sources of FPP production for ART, but less than 20 producers manufacture generic APIs for use in ART. India is the centre of world production for APIs [16]. Of the over 1,000 pharmaceutical companies registered in India, 5 companies dominate ART API production [17]. China is the second-largest producer of ART APIs. China is also a major producer of fine-chemical intermediates that are produced under non-GMP conditions and subsequently entered into API production as starting materials. The production of RMs and API intermediates much earlier in the API synthesis chain is practiced by a much larger number of companies. Hundreds of fine-chemicals manufacturers and brokers advertise their ability to supply the roughly 30–40 key RMs and intermediates for producing ARV APIs [18]. There is presently no significant manufacturing of ART APIs on the African continent. The withdrawal of Lonza from the South African Ketlaphela Project calls into question the timing of when South African companies will become significant producers of ARV APIs [19].
API manufacturing plants contain a variety of processing equipment – for example, chemical stirred tank reactors for synthesis; centrifuges, filters and ovens for isolation and drying, and milling equipment of multiple types. API processing requirements are matched against limiting ‘pinchpoints’ for equipment to determine manufacturing capacity in metric tons per year. Much of the generic capacity for manufacturing ART APIs is ‘dedicated’ – it is used for manufacturing only a single drug or, in the case of TDF and 3TC, two drugs. A facility operating at less than capacity will result in higher costs from under-utilized assets. If demand exceeds capacity, prices will increase because of scarcity of supply. A manufacturing process for producing many metric tons of an API will typically take several months to complete, so lead-times for ordering are necessary to coordinate with FPP demand for ART. The global demand for some ARTs has at times exceeded the capacity of generic producers to manufacture these APIs. Existing capacity for API production is generally expected to meet projected demands through 2016. TDF and EFV are APIs for which uncertainty in the growth of demand is cause for some concern about potentially exceeding existing global capacity for SRA-approved manufacturing.
Optimizing the production of ARV APIs – elements and strategies
Countries purchase ART FPPs through a process of soliciting tender offers from producers of quality-assured medicines. This process is largely price-driven. FPP producers are highly sensitive to API pricing as a result. API producers can potentially lower the cost of their production by economies of scale arising from increased production volumes; improved procurement to lower RM costs; more efficient processing by improved yields, decreased processing times or reduced waste generation; and new or changed routes of synthesis – increased yields, decreased RM inputs, fewer processing steps resulting from completely or substantially new syntheses.
Many ART APIs in the LMIC market are priced much lower than they were in 2005 as a result of treatment scale-up, improved procurement, newly developed chemistry and market competition.
Efficiencies and improved raw materials procurement
Improved procurement of RMs is one way of reducing API manufacturing cost and pricing. Figure 6 shows a number of key materials for ART APIs, the cost of which have greatly decreased over the last several years. These reductions are variously due to new chemistry, increased volume demand, improved processing and price competition from multiple suppliers entering the market.
Figure 6.
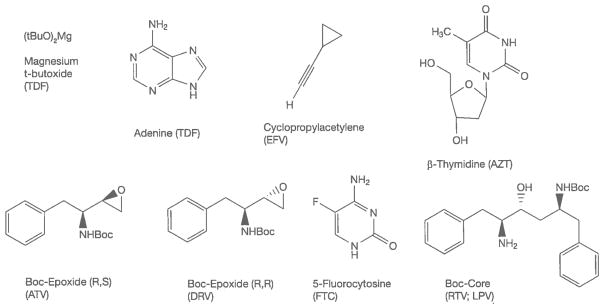
Representative critical materials in antiretroviral API manufacturing
API, active pharmaceutical ingredient; ATV, atazanavir; AZT, zidovudine; DRV, darunavir; EFV, efavirenz; FTC, emtricitabine; LPV, lopinavir; RTV, ritonavir; TDF, tenofovir disoproxil fumarate.
The cost reduction of CPA from USD800–1,150/kg to USD50–60/kg is due to a combination of higher volume demand, improved routes of manufacturing [20–30] and more efficient API syntheses [31,32]. β-thymidine pricing has been brought down by intense efforts to arrive at better routes of manufacturing [33–36]. The Boc-Core intermediate for both RTV and LPV has been reduced in price from about USD700/kg in 2006 to about USD300/kg, largely by improving an existing process. The (R,S) and (R,R) Boc-epoxides for respectively producing ATV or DRV are both synthesized from D-phenylalanine; the (R,R) isomer is more expensive than the (R,S) epoxide, but both costs have been reduced from over USD700/kg to USD400/kg or less. 5-Fluorocytosine is an antifungal drug in its own right [37]; its use in FTC has brought down the price as volume demand has increased and new chemistries have been introduced.
The synthetic steps and the RMs used to manufacture TDF (Figure 7) have not changed since the drug was launched in 2001. Patents are required to disclose the ‘best mode’ of operation (in this case, synthesis of TDF) in order to be valid. The patent that describes this route of synthesis provides synthesis examples that produce TDF in a rather poor overall yield of 13% [38]. This was the starting point for process development for generic production; overall yields for this process were over 20% before generic TDF was introduced in 2007. The Clinton Health Access Initiative (CHAI) funded a substantial amount of process development for this API [39,40]. The results of this work were made available to generic producers under royalty-free agreements. Generic API producers of TDF now obtain overall yields as high as 55–58%. The access price for the first TDF product introduced was USD207 PPPY; this has dropped to USD57 PPPY in 2012–2013. CHAI has estimated the relative contributions of increased demand/competition at USD60, RM/procurement at USD34 and API processing efficiency at USD54 to reducing the PPPY cost of TDF FPP.
Figure 7.
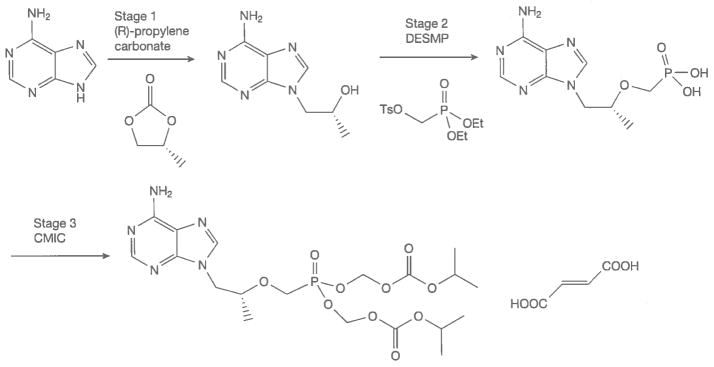
Stages of tenofovir disoproxil fumarate manufacturing with critical raw materials
CMIC, chloromethyl isopropylcarbonate; DESMP, diethyl (toluenesulonyloxy)methylphosphonate.
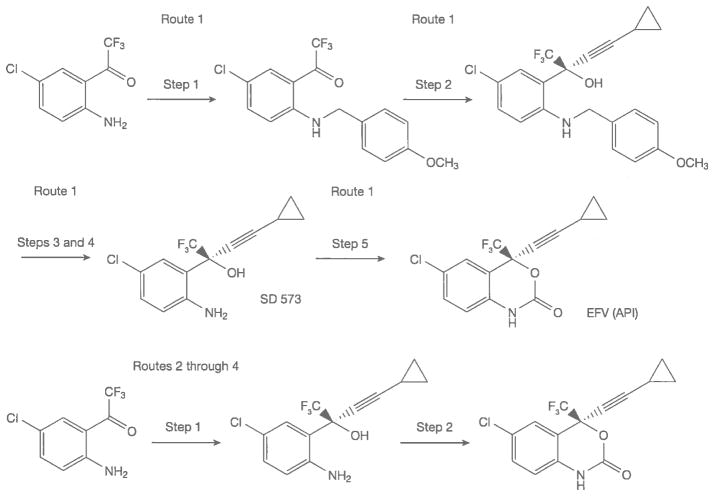
Figure 8 illustrates the great effect of new routes of synthesis on API costs. The manufacturing cost of route 1 for the launch of EFV in 1998 was about USD1,800/kg [31,41]. EFV API was priced at about USD1,100/kg for the first generic launch in 2005. At this time the price of CPA was about USD250/kg. The best prices for EFV API in 2012–2013 are USD120–130/kg prepared under GMP. This drastic 89% reduction in generic API pricing is due in part to volume demand – the LMIC use of generic EFV in 2012 exceeded 750 metric tons and was estimated to exceed 900 metric tons in 2013. Reductions in the cost of RMs have also had a significant effect. More efficient processes for producing the final intermediate SD 573, have contributed the largest part to price reductions [42]. The route 1 synthesis requires five steps while routes 2 through 4 require only two steps from the same starting materials for the commercial production of EFV.
Figure 8.
Syntheses of EFV API; different routes of manufacturing
API, active pharmaceutical ingredient; EFV efavirenz.
The most recent chemistry (route 4) for asymmetric alkynylation of manufacturing EFV uses inexpensive, safe reagents and processing at ambient temperature to reach EFV pricing that would have been thought impossible when the drug was launched by Dupont Pharmaceuticals in 1998 [32,43].
API prices are not publicly available. API manufacturers are very cautious about disclosing prices and manufacturing costs because doing so could put them at a competitive disadvantage. This naturally makes the comparison of API to FPP costs an imperfect exercise. Nearly all companies will provide unattributed or unofficial API pricing that is accompanied by the appropriate contingencies of RM costs and minimum purchase volumes required to reach the unofficial price. In some cases the cost of an API is best estimated from the cost of the FPP. The ‘markup’ of converting an API to an FPP is typically 25–40% of the price in a strongly competitive market.
API versus FPP pricing can be illustrated for TDF in late 2012. Unofficial quotes for TDF API in 2012 [17] ranged from USD275–380/kg (note that the best API pricing for TDF in late 2013 had fallen to USD240/kg; Figure 1). TDF is given as a 300 mg daily dose; a kilogram of API therefore provides roughly 9 patient-years of dosing. At the quoted prices, the API content of a year of FPP dosing cost USD30–42, while the FPP was priced at USD57 PPPY. This allows a rough estimate of the cost markup of formulation. This also raises another point – companies that purchase rather than produce APIs have an extra cost in the production supply chain where profit for the API vendor enters into the final FPP cost. Pharmaceutical producers that are fully integrated to produce both API and FPP, therefore, have a competitive advantage over companies that produce only FPPs.
More innovation in multiple areas
The United Nations has a goal of 15 million people in LMICs on ART by the end of 2015. About 10 million people were on ART at the end of 2012, but approximately 26 million people would benefit from taking ART [44]. A future scenario might even include putting all persons living with HIV/AIDS on drug therapy at the time of diagnosis. Huge volumes of APIs are needed to sustain and expand access to ART. Table 1 illustrates the approximate API volumes needed to respectively treat 26 million and 34 million adults assuming a simple scenario in which EFV+TDF+FTC is the treatment regimen for all patients. Fifteen million adult patients taking EFV+TDF+FTC would respectively require 3,300 metric tons of EFV, 1,650 metric tons of TDF and 1,095 metric tons of FTC. Treating 26 million people with this ART would respectively require 5,690, 2,845 and 1,900 metric tons of EFV, TDF and FTC. Purchasing these APIs to treat 26 million and 34 million patients – at their current best pricing – would respectively cost about USD1,832 and USD2,383 million exclusive of the costs of formulating the FPP. Improved chemistry, procurement and new technologies will not lower the cost of APIs indefinitely. It should not be expected that TDF, for instance, will come down in price to USD100/kg. It is also unrealistic to expect that EFV pricing could fall an additional roughly 50% to USD65/kg, even with increased market demand.
Table 1.
API volume demand and cost outlays to treat 26 million and 34 million patients
| API | Daily dose | Current best cost/kg, USD million | Patient-years per metric ton of API | API to treat 26 million adult patients, metric tons | API cost to treat 26 million adult patients, USD million | API to treat 34 million adult patients, metric tons | API cost to treat 34 million adult patients, USD million |
|---|---|---|---|---|---|---|---|
| EFV+TDF+FTCa | |||||||
| EFV | 600 mg | 120 | 4,566 | 5,690 | 683 | 7,450 | 894 |
| TDF | 300 mg | 240 | 9,132 | 2,845 | 683 | 3,725 | 894 |
| FTC | 200 mg | 240 | 13,700 | 1,900 | 456 | 2,480 | 595 |
| Total | 1,100 mg | – | – | 10,435 | 1,832 | 13,655 | 2,383 |
| RPV+TAF+FTCa | |||||||
| RPV | 25 mg | 400b | 109,589 | 237 | 95 | 310 | 124 |
| TAF | 25 mg | 400b | 109,589 | 237 | 95 | 310 | 124 |
| FTC | 200 mg | 240 | 13,700 | 1,900 | 456 | 2,480 | 595 |
| Total | 250 mg | – | – | 2,374 | 646 | 3,100 | 843 |
| Projected cost reduction | – | – | – | – | 1,186c | – | 1,540c |
First-line antiretroviral therapy scenario.
Projected active pharmaceutical ingredient (API) price with increased volume demand and optimized processing.
Difference between scenario totals. EFV, efavirenz; FTC, emtricitabine; RPV, rilpivirine; TAF, tenofovir alafenamide fumarate; TDF, tenofovir disoproxil fumarate.
Other types of innovation in ART are expected, however, to influence the API market. The original Phase II clinical trials for EFV showed no significant differences in viral suppression at 200, 400 and 600 mg daily doses. EFV was approved at a daily dose of 600 mg based on the assumption that the maximum tolerated dose would give optimal long-term outcomes. Human trials using a combination of EFV with TDF and FTC have shown the non-inferiority of EFV at 400 mg compared with a 600 mg daily dose, with lowered incidence of side effects and fewer discontinuations of therapy [45]. If a 400 mg daily dose of EFV is adopted as a standard of care, this will reduce the need for EFV by one third. The projected demand for EFV in 2014 is about 1,500 metric tons at a 600 mg daily dose. Switching to a 400 mg daily dose would reduce the need for EFV by 500 metric tons and result in API cost savings of approximately USD65 million to treat the same number of patients.
The future
The final section of this survey provides some additional speculation about what the future might hold for improving the economics of delivering ART as new APIs become part of standard therapy. Originator companies must make substantial profits to meet investor expectations. They design clinical trials consistent with the needs of their largely high-income markets. There are now 36 ARV drugs approved for the treatment of HIV, although several are no longer marketed. Several of these drugs might deliver substantial, presently unrealized value for LMICs by delivering them as novel combination therapies. As one example, RPV is a potent NNRTI with a very high genetic barrier to resistance and a daily dose of 25 mg. RPV was approved by the US FDA in 2011. RPV demonstrates clinical equivalence with EFV for first-line ART at 48 weeks of dosing. First-line ART with RPV resulted in a higher rate of virological failure at 48 weeks if patients had an initial viral load greater than 100,000 copies/ml [46]. A trial of 49 patients, however, demonstrated that patients on EFV+TDF+FTC could be successfully moved onto treatment with RPV+TDF+FTC after they had achieved initial viral suppression. Although the RPV trials clearly support approval, they do not provide enough information about RPV-containing therapy to allow confidence or provide a clear strategy for using RPV in first-line ART in LMICs. If enough evidence were available to support a large-scale switch from EFV to RPV, the drug burden of an NNRTI as a component of ART therapy would fall from 600 mg/day to 25 mg/day. This huge difference in drug dosing would certainly result in very large cost savings.
DVG, dosed at 50 mg/day, was approved in August 2013. DVG presently appears to be a more attractive candidate to replace EFV in first-line ART in low-resource settings. DVG may offer similar potential for cost savings to RPV in treating millions of patients in low-resource settings.
The widespread use of RPV for first-line ART, as mentioned above, would hugely reduce the volumes and cost of API needed to treat patients. Only 237 metric tons of RPV would be needed to dose 26 million patients each year, rather than 5,690 metric tons of EFV. At optimized pricing of USD120/kg, the API cost of EFV alone to dose 26 million patients for a year is USD683 million. At USD400/kg it would require only USD95 million in API purchases to dose 26 million patients with RPV for a year – a potential cost reduction of USD588 million/year.
TDF is dosed at 300 mg once daily. Replacing TDF with a different prodrug form, tenofovir alafenamide fumarate (TAF; see molecular structures in Figure 1) potentially provides better clinical outcomes and reduced toxicity at doses of 10–25 mg once daily [47]. The TDF API requirement to treat 26 million patients is 2,845 metric tons/year. Treating 26 million patients with TAF would require only 95 metric tons/year at a 10 mg daily dose and 238 metric tons/year at a 25 mg daily dose. Purchasing 95 or 238 metric tons of TAF versus purchasing 2,845 metric tons of TDF will certainly result in a substantial cost reduction. The synthesis of TAF proceeds through all of the same intermediates, and is only moderately more complex, in the final stages, as the synthesis of TDF [48]. If we presume a cost of USD240/kg for TDF and USD400/kg for TAF, switching from TDF to TAF (at a daily dose of 25 mg) would result in a further cost reduction of USD588 million/year for providing ART to 26 million patients. The magnitude of this figure serves to emphasize the possibilities from substituting new, lower-dose drugs into first-line ART.
At current best-pricing, the cost of purchasing APIs to treat 26 million and 34 million patients with EFV+TDF+FTC would, respectively, be USD1.83 billion and USD2.38 billion (Table 1). We calculate the cost of purchasing APIs to treat 26 million and 34 million patients with RPV+TAF+FTC (at RPV and TAF of USD400/kg each) as USD646 million and USD843 million, respectively. The huge potential for treating patients with reduced cost is therefore apparent. If success is achieved in these or similar breakthroughs in new therapy for first-line ART, it is likely that 26 million patients could be treated for expenditures similar to the amount (about USD1.1 billion) that was spent to treat fewer than 9 million patients in LMICs in 2012 [17].
Although this survey does not review the use of new technologies for drug delivery, it is worthwhile to mention that some drugs can be adapted as formulations in depot form for release over long periods of time. For instance, GlaxoSmithKline (GSK) and Janssen Pharmaceuticals have jointly presented the results of a Phase II study combining RPV and the DVG analogue GSK1265744 (GSK744) as a long-acting, parenteral nanosuspension that would be dosed intramuscularly once every four weeks [49]. The combination of GSK744 and RPV is also being examined as maintenance therapy (25 mg RPV and 10 mg GSK744 daily doses) in a Phase IIb study with patients who have initially achieved effective suppression of HIV with a lead-in dosing of EFV+TDF+FTC [50]. Maintaining patients on a daily dose of only two drugs, particularly at doses of 25 mg and 10 mg, holds great potential for minimizing the overall cost of APIs used in ART.
Conclusions
APIs are critical to the scale-up of access to medicines, not the least because APIs account for about 60–80% of the cost of FPPs. With approximately 12 million people having access to ART in LMICs, the volume usage for major ART APIs is higher in LMICs than in high-income countries. The pricing for generic ART APIs has been greatly reduced by growth and consolidation of market demand, improved procurement, and improved efficiencies and new routes of manufacturing. The evolution of the market for high-quality ART APIs and related RMs or intermediates has been a strong contributor to increased access. Price reductions for first-line ART APIs cannot continue indefinitely, however. Many of these APIs are reaching a point of diminishing returns for continued cost reduction. Future opportunities for substantial reductions in cost must include the incorporation of recently approved or current investigational drugs into new, optimized ART. New drugs and drug combinations have the potential to again greatly reduce the PPPY cost of generic APIs, thereby making ART therapy potentially affordable to all patients in need.
Footnotes
Disclosure statement
The authors declare no competing interests.
References
- 1.World Health Organization. [Accessed 2 June 2014];The treatment 2.0 framework for action: catalysing the next phase of treatment, care and support. Available from http://www.unaids.org/en/media/unaids/contentassets/documents/unaidspublication/2011/20110824_JC2208_outlook_treatment2.0_en.pdf.
- 2.Jinliang L, Feng LV, inventors. Shanghai Desano Pharmaceutical, assignee. A process for stereoselective synthesis of lamivudine. 2161 267 A1. European Patent Application EP. 2007 Jun 29;
- 3.US Food and Drug Administration. United States Code of Federal Regulations Title 21, subpart B: procedures for determining the bioavailability or bioequivalence of drug products. Available from; [Accessed 20 May 2014]. (Updated 6 January 2014.) http://www.accessdata.fda.gov/scripts/cdrh/cfdocs/cfCFR/CFRSearch.cfm?CFRPart=320. [Google Scholar]
- 4.Pollak P, Badrot A, Dach R. [Accessed 20 May 2014];API manufacturing: facts and fiction. Have costs of Chinese and Indian fine chemical producers closed in on European and US levels? Updated 23 January 2012. Available from http://www.contractpharma.com/issues/2012-01/view_features/api-manufacturing-facts-and-fiction/
- 5.Daiichi Sankyo Europe GmbH. [Accessed 24 May 2014];Priority projects in research and development. (Updated 20 May 2014) Available from http://www.daiichi-sankyo.eu/research-development/priority-projects.html.
- 6.Sheldon RA. The E-factor, fifteen years on. Green Chem. 2007;9:1273–1283. [Google Scholar]
- 7.The International Conference on Harmonisation of Technical Requirements for Registration of Pharmaceuticals for Human Use. Good manufacturing practice guide for active pharmaceutical ingredients. [Accessed 20 May 2014]; Available from http://www.ich.org/
- 8.World Health Organization. [Accessed 4 December 2013];Prequalification programme: a United Nations Programme managed by WHO. Available from http://apps.who.int/prequal/
- 9.Health Canada. [Accessed 20 May 2014];Good manufacturing practices (GMP) guidelines for active pharmaceutical agents. Updated 8 November 2013) Available from http://www.hc-sc.gc.ca/dhp-mps/alt_formats/pdf/compli-conform/info-prod/drugs-drogues/actingre-gui-0104-eng.pdf.
- 10.US Pharmacopeial Convention. [Accessed on 20 May 2014];Pending monographs. Available from http://www.usp.org/usp-nf/pending-monographs.
- 11.Sans Frontières Médecins. [Accessed 20 May 2014];Spotlight on patent pool. Updated 19 December 2011. Available from http://www.msfaccess.org/spotlight-on/patent-pool.
- 12.US Pharmacopeial Convention. [Accessed 20 May 2014];Medicines compendium; efavirenz version 1.0. (Updated 2014.) Available from https://mc.usp.org/monographs/efavirenz-1-0?destination=node/687.
- 13.US Food and Drugs Administration. [Accessed 20 May 2014];Guideline on drug master files. (Updated 23 April 2014) Available from http://www.fda.gov/Drugs/DevelopmentApprovalProcess/FormsSubmissionRequirements/DrugMasterFilesDMFs/UCM2007046.
- 14.Chemburkar SR, Bauer J, Deming K, et al. Dealing with the impact of ritonavir polymorphs on the late stages of bulk drug process development. Org Proc Res Dev. 2000;4:413–417. [Google Scholar]
- 15.Kamble P, Ghorpade S, Kshirsagar R, Kuchekar B. Progress of the Indian pharmaceutical industry: a shifting perspective. JIPLP. 2012;7:48–51. [Google Scholar]
- 16.MDTV Alliance. [Accessed 20 May 2014];API industry at a glance. (Updated 2014.) Available from http://www.mdtvalliance.org/
- 17.Clinton Health Access Initiative. [Accessed 20 May 2014];ARV market report: the state of the antiretroviral drug market in low- and middle-income countries. (Updated 3 December 2012.) Available from http://www.clintonhealthaccess.org/files/ARV%20Market%20Report_Nov2013.pdf.
- 18.UNITAID. [Accessed 20 May 2014];CHAI, UNITAID, and DFID announce lower prices for HIV/AIDS medicines in developing countries. Available from http://www.unitaid.eu/en/resources/news/331-clinton-health-access-initiative-unitaid-and-dfid-announce-lower-prices-for-hivaids-medicines-in-developing-countries.
- 19.Mail, Guardian [Accessed 20 May 2014];ARV plan bounces back. Available from http://mg.co.za/article/2013-05-24-00-arv-plan-bounces-back/
- 20.Stickley KR, Wiley DB, inventors. Wiley Organics Inc, assignee. Preparation of cycloalkylacetylene compounds using dialkylaminomagnesium halide or bis-(dialkylamino)magnesium. 5,952,537. US Patent. 2001 Oct 16;
- 21.Nakazawa M, Mitani T, Satake Y, Oozono S, Asanuma G, Shiono M, inventors. Kuraray Co. Ltd, assignee. Process for the preparation of cyclopropylacetylene derivatives. 06180835. US Patent. 1999 Sep 21;
- 22.Corley EG, Thompson AS, Huntington M. Cyclopropylacetylene. Org Synth. 2000;77:231–235. [Google Scholar]
- 23.Sandor K, Marcune B, inventors. Merck & Co., Inc, assignee. Efficient synthesis of cyclopropylacetylene. 6,072,094. US Patent. 2000 Jun 6;
- 24.Chaudhury A, inventor. Dupont Pharmaceuticals Company, assignee. Process for the preparation of cyclopropylacetylene. 6,235,957 B1. US Patent. 2001 May 22;
- 25.Asanuma G, Takaki K, Ohzono S, Shiono M, inventors. Kuraray Co., Ltd, assignee. Retro-ethynylation process of a cyclopropylpropynol compound; preparing an intermediate in synthesis of drug having anti-HIV activity. 6,180,835 B1. US Patent. 2001 Jan 30;
- 26.Henningsen M, Stamm A, Fischer M, Siegel W, inventors. BASF Aktiengesellschaft, assignee. Process for preparing cyclopropylacetylene. 6,207,864 B1. US Patent. 2001 Mar 27;
- 27.Wang Z, Yin J, Fortunak JM, Campagna S, inventors. Dupont Pharmaceuticals Company, assignee. Process for the preparation of cyclopropylacetylene. 6,288,297 B1. US Patent. 2001 Sep 11;
- 28.Brands KMJ, inventor. Merck & Co. Inc, assignee. Synthesis of cyclopropylacetylene using a catalytic decarboxylation reaction. 6,313,364 B1. US Patent. 2001 Nov 6;
- 29.Wang Z, Fortunak JM, inventors; Wang Z, Fortunak JM, assignees. Process for the preparation of cyclopropylacetylene. 6,359,164 B1. US Patent. 2002 Mar 19;
- 30.Brands KMJ, inventor. Merck & Co. Inc, assignee. Synthesis of cyclopropylacetylene by a one-pot process. 6,552,239 B1. US Patent. 2003 Apr 22;
- 31.Pierce ME, Parsons RL, Jr, Radesca LA, et al. Practical asymmetric synthesis of efavirenz (DMP 266), and HIV-1 reverse transcriptase inhibitor. J Org Chem. 1998;63:8536–8543. [Google Scholar]
- 32.Biao J, Yugui S, inventors. Shanghai Institute of Organic Chemistry, Chinese Academy of Sciences, assignee. Amino alcohol ligand and its use in preparation of chiral propargylic tertiary alcohols and tertiary amines via enantioselective addition reaction. 7,439,400. US Patent. 2008 Oct 21;
- 33.Freskos JN, Senaratne KPA, inventors. Ethyl Corporation, assignee. Synthesis of beta-thymidine. 4,914,233. US Patent. 1990 Apr 3;
- 34.Lee HC, Ahn JM, Lee SN, Kim JH. Overproduction of thymidine by recombinant Brevibacterium helvolum amplified with thymidine monophosphate phosphohydrolase gene from bacteriophage PBS2. Biotechnol Lett. 2004;26:265–268. doi: 10.1023/b:bile.0000015423.83278.e2. [DOI] [PubMed] [Google Scholar]
- 35.Song KH, Kwon DY, Kim SY, Lee JK, Hyun HH. Thymidine production by Corynebacterium ammoniagenes mutants. J Microbiol Biotechnol. 2005;15:477–483. [Google Scholar]
- 36.Tsen S. Chemostat selection of Escherichia coli mutants secreting thymidine, cytosine, uracil, guanine, and thymine. Appl Microbiol Biotechnol. 1994;41:233–238. [Google Scholar]
- 37.Vermes A, Guchelaar HJ, Dankert J. Flucytosine: a review of its pharmacology, clinical indications, pharmacokinetics, toxicity and drug interactions. J Antimicrob Chemother. 2000;46:171–179. doi: 10.1093/jac/46.2.171. [DOI] [PubMed] [Google Scholar]
- 38.Arimilli MN, Cundy KC, Dougherty JP, Kim CU, Oliyai R, Stella VJ, inventors. Gilead Sciences Inc, assignee. Antiviral phosphonomethyoxy nucleotide analogs having increased oral bioavarilability. 5,922,695. US Patent. 1999 Jul 13;
- 39.Brown Ripin DH, Teager DS, Fortunak J, et al. Process improvements for the manufacture of tenofovir disoproxil fumarate at commercial scale. Org Process Res Dev. 2010;14:1194–1201. [Google Scholar]
- 40.Jayaraman K. Finding the right chemistry. Nature Medicine. 2013;19:1200–1203. doi: 10.1038/nm1013-1200. [DOI] [PubMed] [Google Scholar]
- 41.Treatment Action Group. [Accessed 20 May 2014];Better late than never: efavirenz dose optimization. Available from http://www.treatmentactiongroup.org/tagline/2014/spring/better-late-never-efavirenz-dose-optimization.
- 42.Vemishetti P, Chadwick ST, Costello CA, Desikan S, Reiff EA, inventors. Bristol-Myers Squibb, assignee. Synthesis of benzoxazinone. 2006/0047115 A1. US Patent Application. 2006 Mar 2;
- 43.Bollu RB, Ketavarapu NR, Indukuri VSK, Gorantla SR, Chava S, inventors. Laurus Labs Private Limited, assignee. Efficient process to induce enantioselectivity in procarbonyl compounds. 2012/0264933 A1. US Patent Application. 2012 Oct 18;
- 44.WHO. [Accessed 20 May 2014];WHO issues new HIV recommendations calling for earlier treatment. Available from http://www.who.int/mediacentre/news/releases/2013/new_hiv_recommendations_20130630/en/
- 45.Puls R Encore1 Study Group. A daily dose of 400mg efavirenz (EFV) is non-inferior to the standard 600mg dose: week 48 data from the ENCORE1 study, a randomised, double-blind, placebo controlled, non-inferiority trial. 7th IAS Conference on HIV Pathogenesis, Treatment and Prevention; 30 June–3 July 2013; Kuala Lumpur, Malaysia. p. Abstract WELBB01. [Google Scholar]
- 46.Cohen CJ, Molina JM, Cassetti I, et al. Week 96 efficacy and safety of rilpivirine in treatment-naive HIV-1 patients in two Phase III randomized trials. AIDS. 2013;27:939–950. doi: 10.1097/QAD.0b013e32835cee6e. [DOI] [PubMed] [Google Scholar]
- 47.Zolopa A, Ortiz R, Sax P, et al. Comparative study of tenofovir alafenamide vs tenofovir disoproxil fumarate, each with elvitegravir, cobicistat, and emtricitabine, for HIV treatment. 20th Conference on Retroviruses and Opportunistic Infections; 3–6 March 2013; Atlanta, GA, USA. p. Abstract 99LB. [Google Scholar]
- 48.Colby DA, Martins AA, Roberts BJ, Scott RW, Solomon NS, inventors. Gilead Sciences, Inc, applicant. Methods for preparing antiviral nucleotide analogs. 2013/052094 A2. WIPO/PCT International Patent Application WO. 2013 Apr 11;
- 49.Spreen W, Williams P, Margolis D, et al. First study of repeat dose administration of GSK1265744 and TMC278 long-acting parenteral nanosuspensions: pharmacokinetics, safety, and tolerability in healthy adults. 7th IAS Conference on HIV Pathogenesis, Treatment, and Prevention; 30 June–3 July 2013; Kuala Lumpur, Malaysia. [Google Scholar]
- 50.Margolis D, Bhatti L, Smith G, et al. Once-daily oral GSK1265744 (GSK744) as part of combination therapy in antiretroviral naive adults. 24 week safety and efficacy results from the LATTE study (LAI116482). 14th European AIDS Conference; 18 October 2013; Brussels, Belgium. p. Abstract PS7/1. [Google Scholar]


