

Abstract
Synaptic connections between identified fast-spiking (FS), parvalbumin (PV)-positive interneurons, and excitatory spiny neurons in layer 4 (L4) of the barrel cortex were investigated using patch-clamp recordings and simultaneous biocytin fillings. Three distinct clusters of FS L4 interneurons were identified based on their axonal morphology relative to the barrel column suggesting that these neurons do not constitute a homogeneous interneuron population. One L4 FS interneuron type had an axonal domain strictly confined to a L4 barrel and was therefore named “barrel-confined inhibitory interneuron” (BIn). BIns established reliable inhibitory synaptic connections with L4 spiny neurons at a high connectivity rate of 67%, of which 69% were reciprocal. Unitary IPSPs at these connections had a mean amplitude of 0.9 ± 0.8 mV with little amplitude variation and weak short-term synaptic depression. We found on average 3.7 ± 1.3 putative inhibitory synaptic contacts that were not restricted to perisomatic areas. In conclusion, we characterized a novel type of barrel cortex interneuron in the major thalamo-recipient layer 4 forming dense synaptic networks with L4 spiny neurons. These networks constitute an efficient and powerful inhibitory feedback system, which may serve to rapidly reset the barrel microcircuitry following sensory activation.
Keywords: barrel cortex, fast-spiking, GABAergic interneuron, layer 4, spiny stellate cell
Introduction
Only a small fraction of neocortical neurons are GABAergic interneurons (in the barrel cortex, the number is as low as ∼12%; Lefort et al. 2009; Meyer et al. 2011). Nevertheless, these neurons are highly diverse and therefore notoriously difficult to classify (e.g., Somogyi et al. 1998; Soltesz 2006; Ascoli et al. 2008). Some interneurons have clearly distinct morphological and functional features (e.g., chandelier or axo-axonic cells and Martinotti cells, Somogyi et al. 1982; Müller-Paschinger et al. 1983; DeFelipe et al. 1989; Tamás and Szabadics 2004; Inda et al. 2007; Woodruff et al. 2009) while others cannot be classified easily into a distinct group. The apparent phenotype(s) of these neurons gave rise to overlapping descriptions that were used to define different groups (Kubota and Kawaguchi 1994; Kawaguchi and Kubota 1997; Gupta et al. 2000; Kawaguchi and Kondo 2002; for reviews, see Markram et al. 2004; Rudy et al. 2011; DeFelipe et al. 2013). The variability in the structural and/or functional features within a “group” was not always significantly smaller than the differences in these parameters across groups indicating a high degree of heterogeneity between GABAergic interneurons. Therefore, different morphological subtypes are hard to identify by visual inspection only and thus additional quantitative parameters are required for a meaningful classification. Some studies also reported problems in correlating the qualitative morphological classes with electrophysiological parameters (Gupta et al. 2000) and their pattern of antigen expression (Cauli et al. 2000), which calls into question previous attempts to classify interneurons using solely these criteria (Kawaguchi and Kubota 1997; Galarreta and Hestrin 1999; Gibson et al. 1999; Amitai et al. 2002).
GABAergic interneuron types in the “barrel” field of the somatosensory cortex have received considerable attention in recent years (e.g., Cauli et al. 2000, 2004; Angulo et al. 2003; Ascoli et al. 2008; Helmstaedter et al. 2008, 2009a, 2009b, 2009c; Karagiannis et al. 2009; Avermann et al. 2012; Nogueira-Campos et al. 2012; Perrenoud et al. 2012; Chittajallu et al. 2013; Xu et al. 2013). However, detailed quantitative and correlated descriptions of their functional and structural properties are still relatively scarce and, in particular, the synaptic physiology of these neurons has been studied only recently.
In previous publications from our laboratory (Helmstaedter et al. 2008, 2009a, 2009b, 2009c), we established a classification of interneurons in layer 2/3 of the barrel cortex based on their axonal projection pattern with reference to barrel-related cortical columns.
Here, we investigated the role of fast-spiking (FS) interneurons in layer 4 of rat barrel cortex. We were able to identify 3 different subtypes of FS L4 interneurons with distinct barrel column-related axonal morphologies. Subsequently, we analyzed the characteristics of the inhibitory synaptic transmission between FS L4 interneurons and L4 spiny neurons. We focused our study on the FS L4 interneuron type that was encountered most frequently. These neurons showed expression of the Ca2+-binding protein parvalbumin (PV), but not for calbindin (CB), had an axonal arborization that was almost completely confined to a single barrel. These interneurons exhibited a high degree of synaptic connectivity with excitatory neurons in the same layer. We hypothesize that this FS L4 interneuron type mediates the rapid inhibition of the thalamocortical excitation of excitatory L4 spiny neurons through the efficient use of both feed-forward and feedback microcircuits.
Materials and Methods
Experimental Setup
All experimental procedures were carried out according to the animal welfare guidelines of the Max Planck Society. Wistar rats aged between 18 and 22 days were anesthetized with isoflurane, decapitated, and slices through the somatosensory cortex were cut in cold extracellular solution using a vibrating microslicer (DTK-1000, Dosaka, Kyoto, Japan). The method described by Agmon and Connors (1991) was used with minor modifications required for rat brain. The tissue was sliced at slow speed and high vibration frequency into 300-µm-thick “semi-coronal” slices (Land and Kandler 2002). Slices were collected with a pipette, and subsequently incubated (30–60 min) in an artificial saline solution bubbled with 95% O2 and 5% CO2 containing 6 mM MgCl2 to reduce synaptic activity at room temperature (22–24 °C) before recording. After the incubation, slices were transferred to the experimental setup and selected for best visibility of barrels in cortical layer 4. During the experiment, slices were continuously superfused with an extracellular solution containing (in mM): 125 NaCl, 2.5 KCl, 25 glucose, 25 NaHCO3, 1.25 NaH2PO4, 2 CaCl2, and 1 MgCl2 and bubbled with 95% O2 and 5% CO2. The pipette (intracellular) solution used for both pre- and postsynaptic cell had the following composition (mM): 135 potassium gluconate, 4 KCl, 10 HEPES, 10 phosphocreatine-Na, 4 ATP-Mg (pH 7.2, osmolarity 291 mOsm). Biocytin (Sigma, Munich, Germany) at a concentration of 3 mg/mL was routinely added to the internal solution and neurons were filled during 1–2 h of recording. Slices were placed in the recording chamber under an upright microscope (Axioskop FS1, Carl Zeiss, Göttingen, Germany; fitted with w2.5 plan/0.075 NA and w40 W/0.80 objectives) with the pial surface pointing to the front and the hippocampus to the right. The barrel field was visualized at low magnification under bright-field illumination and can be identified in layer 4 as narrow dark stripes with evenly spaced, light “hollows” (Agmon and Connors 1991; Feldmeyer et al. 1999). Barrel structures are present in 6 or 7 slices but a continuous band of barrels is visible only in 2 or 3 slices just above the fimbria–fornix and the lateral ventricle (Fig. 1A; Agmon and Connors 1991). Individual L4 neurons were identified at ×40 magnification using infrared differential interference contrast (IR-DIC) microscopy (Fig. 1B).
Figure 1.
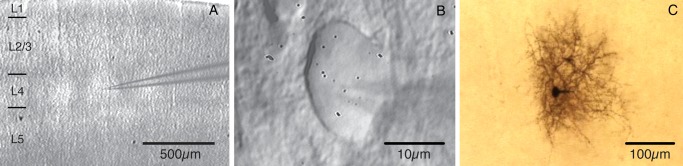
L4 interneurons in the barrel cortex slice. (A) Acute thalamocortical slice through the “barrel” field in rat somatosensory cortex with a patch pipette showing the recording position in layer 4. (B) IR-DIC image of a L4 interneuron during the experiment. (C) Biocytin staining of the same cell as shown in panel B with the characteristic dense axonal arborization pattern of interneuron axon within the barrel.
Electrophysiological Recordings
Whole-cell voltage recordings from single GABAergic interneurons in cortical barrels were made at 32–34 °C using patch pipettes of 3.5–6 MΩ resistance pulled of thick borosilicate glass capillaries (outer diameter, 2.0 mm; inner diameter, 0.5 mm). We used infrared video microscopy for visualization of barrel neurons. No neurons more superficial than 50 µm were patched; patched neurons were identified as FS L4 interneurons by their voltage response and fast action potential (AP) firing pattern in response to brief current injections (suprathreshold current pulse of 500 ms). Passive and active electrophysiological properties of FS L4 interneurons cells were determined from recordings with an Axoclamp-2B amplifier (Axon Instruments, Union City, CA, USA) and determined off-line (see Table 1; Feldmeyer et al. 1999; Radnikow et al. 2012). L4 spiny neurons were identified primarily by their significantly wider AP half width and their regular AP firing pattern (Connors et al. 1982; Connors and Gutnick 1990). The membrane potential of the postsynaptic spiny cell was set to a holding potential of −55 mV in order to increase the driving force for Cl− thus facilitating the detection of inhibitory connections; corrections for liquid junction potential were not made. Searching for GABAergic inhibitory connections was done by application of brief suprathreshold current injections at a frequency of 10 Hz, which elicited APs in the presynaptic interneuron. If IPSPs were detected in the postsynaptic spiny cell, we used a standard protocol for paired recording (Feldmeyer et al. 1999; Radnikow et al. 2012).
Table 1.
Intrinsic electrophysiological properties of layer 4 interneurons and excitatory L4 spiny neurons
| Parameters | Spiny neurons mean ± SD | P (spiny neurons vs. L4 IN) | Barrel inhibitor |
Noncluster 3 |
P (cluster 3 vs. noncluster 3) | P (cluster 3 vs. 2) | P (cluster 3 vs. 1) | |
|---|---|---|---|---|---|---|---|---|
| Cluster 3 mean ± SD | Cluster 2 mean ± SD | Cluster 1 mean ± SD | ||||||
| Morphology | ||||||||
| Total axon length (mm) | n/a | n/a | 16.0 ± 6.0 | 19.6 ± 7.0 | 25.5 ± 11.4 | ns | ns | <0.05 |
| Axon barrel ratio | n/a | n/a | 0.89 ± 0.05 | 0.66 ± 0.06 | 0.28 ± 0.11 | <0.001 | <0.01 | <0.001 |
| Static EP | ||||||||
| AP half width (ms) | 1.10 ± 0.13 | <0.001 | 0.32 ± 0.08 | 0.39 ± 0.11 | 0.34 ± 0.10 | 0.1 | ns | ns |
| AHP amplitude (mV) | −11.8 ± 1.7 | <0.01 | −16.0 ± 3.5 | −13.7 ± 3.8 | −15.7 ± 3.7 | 0.21 | ns | ns |
| AP threshold (mV) | −40.8 ± 9.8 | 0.02 | −34.4 ± 7.6 | −33.3 ± 6.0 | −35.0 ± 5.4 | 0.99 | ns | ns |
| Dynamic EP | ||||||||
| Fmax (Hz) | 60 ± 9 | <0.001 | 279 ± 51 | 293 ± 88 | 280 ± 56 | 0.69 | ns | ns |
| Adaptation ratio | 0.18 ± 0.10 | <0.001 | 0.67 ± 0.11 | 0.68 ± 0.14 | 0.75 ± 0.20 | 0.29 | ns | ns |
| AHP difference (mV) | −7.6 ± 1.6 | <0.001 | 1.1 ± 1.1 | 1.8 ± 1.1 | 1.2 ± 0.6 | 0.25 | ns | ns |
| Passive EP | ||||||||
| Baseline Vm (mV) | −70.1 ± 8.2 | 0.10 | −67.2 ± 4.9 | −67.2 ± 4.8 | 64.2 ± 7.7 | 0.35 | ns | ns |
| Membrane resistance (MΩ) | 138.9 ± 26.8 | <0.001 | 85 ± 19.8 | 91.2 ± 21.9 | 96.2 ± 19.8 | 0.14 | ns | ns |
Different morphological subtypes as defined by cluster analysis are represented by “barrel inhibitor” neurons (cluster 3) and 2 noncluster 3 subgroups (pooled data of cluster 1 and 2 interneurons). There was no difference in any physiological parameter between the 3 different morphological clusters of layer 4 interneurons (ANOVA with Dunn's post-test analysis; ns, nonsignificant). When compared with L4 interneurons (L4 IN), L4 spiny neurons showed differences in all physiological parameters except baseline membrane voltage (n/a, nonapplicable).
Analysis of Electrophysiological Data
For the description of physiological, structural, and molecular features, we used, whenever applicable, the nomenclature suggested by the Petilla Convention (Ascoli et al. 2008). Analysis of passive and active electrophysiological properties was performed using custom-made software (written in IGOR PRO, Wavemetrics, as in Helmstaedter et al. 2009b). For analysis, the trace with an initial inter-AP interval that was closest to 10 ms (100 Hz) was used. Synaptic parameters (both for inhibitory and excitatory connections) were evaluated as described previously (Feldmeyer et al. 1999).
Immunohistochemical Staining
To determine the Ca2+-binding protein phenotype, we recorded 10 single L4 interneurons for subsequent immunohistochemistry. The recording time was reduced to <5 min in order to minimize cytoplasmic dilution, which would otherwise lead to decreased sensitivity for the detection of antigen patterns. To offset the shorter patch time, we used high concentrations of biocytin in the pipette solution (12 mg/mL). The pipette was carefully withdrawn from the soma and the slice was kept in the bath for ∼30 min to allow diffusion of biocytin into the axon. Slices were postfixed overnight at 4 °C in phosphate-buffered (PB) saline (100 mM, pH 7.4), containing 4% paraformaldehyde and then resliced in agar at 50–100 µm with a vibratome (Leica VT1000, Wertheim, Germany). The antibodies used were primary antibodies against PV and CB (mouse anti-PV, 1:5000; rabbit anti-CB D-28k, 1:5000) both antibodies from Swant, Bellinzona, Switzerland). In addition, we used AMCA-Streptavidin (Vector Laboratories, Burlingame, CA, USA; diluted 1:100) to identify the structural features of the interneuron by its binding to biocytin. After incubation with the primary antibodies overnight at 4 °C and subsequent rinsing with Tris-buffered saline (50 mM), the sections were incubated for 2–3 h at room temperature with secondary antibodies, Cy5-conjugated donkey-anti-mouse (1:200; Jackson Laboratories, Bar Harbor, MN, USA) to detect the PV-expression, and Cy3-conjugated goat anti-rabbit (1:200; Vector Laboratories Ltd, Petersborough, UK) to detect the CB-expression in the L4 interneurons, respectively. Slices were embedded in Vectastain (Vector Laboratories Ltd) and viewed under a laser-scanning confocal microscope (Leica Microsystems, Wetzlar, Germany). The interneuron was identified by AMCA fluorescence (450 nm filter). Laser lines were sequentially excited to avoid excitation overlap (with laser emission wavelengths of 532 and 635 nm for fluorescence indicating CB and PV expression, respectively). After acquisition of the fluorescence data and immunocytochemical characterization, the standard avidin–biotin–horseradish peroxidase–DAB reaction was performed (ABC-Elite; Camon, Wiesbaden, Germany; cf., Lübke et al. 2003; Marx et al. 2012).
Biocytin Labeling, Morphological Reconstructions, and Analysis
Following recording, slices were fixed at 4 °C for at least 24 h in 100 mM PB solution (pH 7.4), containing 4% paraformaldehyde. Endogenous peroxidase was blocked by incubation of the slices in 3% H2O2 for 15–20 min. After several rinses in normal 100 mM PB solution, they were then incubated in a 100-mM PB solution containing 1% avidin–biotinylated horseradish peroxidase complex and 0.1% Triton X-100 (ABC-Elite Camon, Wiesbaden, Germany) and left overnight at 4 °C while shaking gently. On the following day, slices were preincubated using 3,3-diamino-benzidine (1 mg/mL DAB; Sigma); subsequently, 0.01% H2O2 was added. The reaction was stopped when dendrites and axonal arbors were clearly visible (after ∼2–5 min; see also Fig. 1C). Slices were mounted on glass slides, embedded in Moviol (Hoechst AG, Frankfurt, Germany), and enclosed with a coverslip. Neurons were reconstructed with the aid of Neurolucida software (MicroBrightField, Colchester, VT, USA) using an Olympus Optical (Hamburg, Germany) BX50 microscope or a Zeiss Axioplan (Götttingen, Germany) microscope equipped with ×100 oil immersion objective. Only neurons with no severed dendrites and axons (visible, e.g., as blebs) within the confines of the dendritic arbor of the postsynaptic L4 spiny neurons were used for morphological analysis (see Fig. 1), thereby minimizing an underestimation of the synaptic connectivity. The reconstructions provided the basis for further quantitative morphological analysis.
Quantitative Analysis of Axonal Projections
For the quantitative morphological analysis of L4 interneurons, we used the same method as described for L2/3 interneurons in rat barrel cortex (Helmstaedter et al. 2009a). In brief, the whole reconstruction was aligned with the bright-field photograph of the slice taken during the experiment. We generated 2D maps (density maps) of 3D axonal and dendritic domains in relation to the anatomically defined cortical layers, by using custom-made software (“RembrandtII”; Helmstaedter et al. 2009a) written in Igor Pro (Wavemetrics, Lake Oswego, OR, USA). “Contour lines” were computed as “iso-density lines” that enclosed a 70%, 80%, and 90%, respectively, of the total axonal length of the neuron. So-called “innervation domains” were calculated for the inhibitory connection between L4 interneurons and spiny neurons. Reconstructions of the dendritic trees of 19 postsynaptic L4 spiny neurons were processed as described above to obtain average interpolated maps of dendritic length density aligned to the center of the home barrel. For each of the axonal projection types represented by the different clusters (see below), the barrel-aligned axonal density maps of presynaptic interneurons were pointwise multiplied with the barrel-aligned dendritic density maps of the postsynaptic L4 spiny neurons. Maps were not normalized, so the product density was comparable among interneuron types. Three contour lines at the same absolute product density are shown for all innervation domains for comparison (Fig. 3B).
Figure 3.

Average axonal domains and firing patterns of the 3 different types of fast-spiking L4 interneurons. (A1–3) Representative Neurolucida reconstructions of L4 interneurons that were classified as cluster 1 (A1), cluster 2 (A2), and cluster 3 (A3) cells, respectively (axons are given in blue, the somatodendritic domain in red). (B1–3) Average axonal length density maps (blue) of the 3 different clusters, respectively. White, thin contour lines enclosing 70%, 80%, and 90% of the integrated axonal density are shown superimposed. The red triangles depict the location of the L4 interneuron somata with respect to the center of the barrel. Note that cluster 1 interneurons have axonal domains that project both throughout cortical layer 2/3, 4, and 5 with the highest density in layer 2/3. In contrast, cluster 3 interneurons have an axonal domain that resides almost exclusively within the home barrel. Cluster 2 interneurons constitute an intermediate class between cluster 1 and 3 neurons with an axon largely confined to the home barrel with only short vertically ascending axonal collaterals in lower layer 2/3. (C1–3) Examples of AP firing patterns elicited by rectangular current pulses injected at the soma of the 3 L4 interneuron types. The maximum firing frequency in all of these neurons was ∼300 Hz, that is, all 3 types can be classified as interneurons with FS characteristics. There were no significant differences in the firing characteristics and, thus, the L4 interneurons cannot be discriminated by these criteria. (D) Immunohistochemistry of a typical cluster 3 neuron. AMCA streptavidin was used to determine the location and morphology of the neuron, which was positive for PV but negative for CB.
The “axon barrel ratio” of the axonal projection was calculated as the ratio between the axonal path length of the L4 interneuron that was within the home barrel of the neuron and the total axon length. The home barrel was here defined to include half of the adjacent septa on both sides to reduce variability in determining the lateral borders of the home barrel in the thalamocortical slice plane. The “axon home column ratio” was calculated as the ratio between the axonal path length of the L4 interneuron within the home barrel column and the total axon length. The home column was defined here to include half of the adjacent septa on either side of the barrel.
Cluster Analysis
Axonal projection types were determined using a cluster analysis in the 2D parameter space of the axon barrel ratio and the axon home column ratio as defined above. Distances were measured as Euclidean, and a linkage method based on the minimal increase of intracluster variance at each linkage step was used (Ward 1963). For determining the number of clusters present, the Thorndike procedure was used (Thorndike 1953; Cauli et al. 2000; Helmstaedter et al. 2009a). Briefly, the linkage step leading to the maximum increase in linkage distance was used for cutoff.
Number and Distance of Light-Microscopically Identified Synaptic Contact Sites
We used light microscopy at ×1000 magnification (×100 oil immersion objective and ×10 eyepiece) to search for putative synaptic contacts for all reconstructed cell pairs, for which a synaptic connection had been demonstrated (Markram et al. 1997). Used with due care, this method has proven to be a reliable way to identify putative synaptic contacts of biocytin-stained cortical neurons (Markram et al. 1997; Feldmeyer et al. 2002; Silver et al. 2003; Branco and Staras 2009). We chose only those cell pairs that displayed excellent, high-contrast biocytin staining of the entire axonal and dendritic trees for an unambiguous identification of synaptic contacts between the pre- and postsynaptic neurons (n = 17). Only when a clear apposition between an axonal bouton and dendritic shaft or spine was visible, these were judged to be putative synaptic contacts.
After putative synaptic contact sites had been determined, we measured the distance of those contacts to the postsynaptic soma as geometric dendritic distance. Among all reciprocally connected cell pairs, we selected those with excellent staining for the same quantitative evaluation of excitatory synaptic contacts (n = 7).
Results
Quantitative Morphological Analysis of L4 Interneurons in Rat Barrel Cortex
Whole-cell patch-clamp recordings and simultaneous biocytin labeling was performed for a total of 45 interneurons in layer 4 of the barrel cortex of 18- to 22-days-old rats (Fig. 1). The dendritic and axonal arborizations of these neurons were completely reconstructed for a subsequent quantitative morphological analysis. The total axonal length was measured in 3D and the fractions of axonal length in different functional compartments (home barrel, home barrel column, adjacent column, e.g., see Fig. 2A) were determined. Data were derived from Neurolucida reconstructions of biocytin-filled neurons, which were aligned to the center of the home barrel. We took bright-field photographs of the slice after recording, which showed visible barrel fields as well as somata positions indicated by the tips of patch pipettes (Fig. 1A). The alignment was done by matching soma positions and pia mater of the reconstructions with the corresponding bright-field photomicrographs (see Materials and Methods section for further details).
Figure 2.
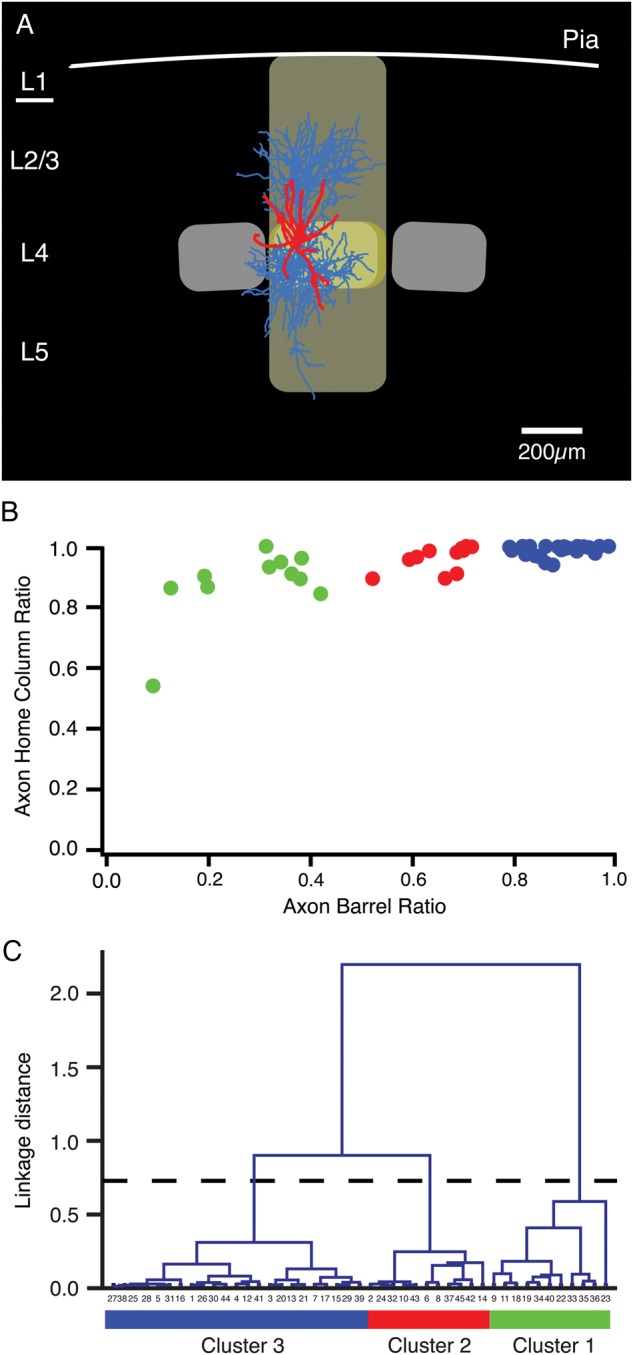
Quantitative identification of different FS L4 interneuron types. (A) Reconstruction of a biocytin-labeled L4 interneuron located in the center of a cortical barrel. Dendrites, red; axons, light blue. The home barrel of this interneuron is outlined in yellow, the home “barrel column” in light yellow. The 2 neighboring barrels are shown in light gray. (B) To classify L4 interneurons, the fractions of the axon within a barrel and within the home column were used. Cluster 1 interneurons are in green, cluster 2 interneurons in red and those of cluster 3 in blue (see panel C). (C) Based on these 2 parameters (axon–barrel ratio and axon–column ratio), a cluster analysis was performed that resulted in 3 distinct interneuron types: Cluster 1 interneurons had a relatively low axon–barrel ratio but generally high axon–column ratios, Cluster 3 interneurons had highly local axons that were confined to their home barrel and thus had both high axon-barrel and axon-barrel ratios. Cluster 2 L4 interneurons were intermediate.
Cluster Analysis of L4 Interneurons
Based on the reconstruction of the axonal projection of L4 interneurons (Fig. 2A), we calculated the fraction of the axon that was confined to a barrel (axon barrel ratio) and the fraction that was confined to the home barrel column (axon home column ratio). Figure 2B shows the distribution of axonal projection ratios within the barrel and in the home column of the neurons. While most L4 interneurons in this study were confined to the home column (only one interneuron showed <80% of axonal length within its column), the fraction of the axon in the home barrel was much more variable with values for the axon barrel ratio ranging between 9% and 98%. The large variety in the axonal projection pattern suggests the existence of different L4 interneuron subpopulations, with different functional roles in the neuronal microcircuitry of the barrel cortex. Therefore, an unsupervised cluster analysis based on these parameters was performed that revealed 3 distinct morphological clusters of L4 interneurons (Fig. 2C).
L4 interneurons in cluster 1 had a much lower axon barrel ratio (0.28 ± 0.11) than clusters 2 and 3 neurons (Fig. 2B). Indeed, these interneurons are always characterized by 2 main axonal projection fields, one in layer 4 and a second, dense domain in layer 2/3 of their home column. A subset of cluster 1 L4 interneurons showed also projections to layer 5A and 5B (Supplementary Fig. 1). The axonal home column ratio of cluster 1 interneurons was lower (0.88 ± 0.12) than that of cluster 2 or 3 interneurons (see Supplementary Figs 2 and 3). In layer 4, axons of cluster 1 interneurons are largely confined to a barrel, but displayed column-border-crossing axon collaterals in layers 2/3 and 5 (for representative neurons belonging to each cluster, see Fig. 3A1–3). In addition, the dendritic domain of cluster 1 interneurons is also more diverse than that of both cluster 2 and 3 interneurons (Supplementary Fig. 1). It is therefore very likely that this cluster comprises more than 1 L4 interneuron type.
For interneurons belonging to cluster 2, the fraction of the axon within a barrel was significantly lower than that observed for cluster 3 L4 interneurons (Table 1, 0.66 ± 0.06 vs. 0.89 ± 0.05, cluster 2 vs. cluster 3; cf., Fig. 3A2 with Fig. 3A3). Nevertheless, the axonal arborization of cluster 2 interneurons remained strongly confined to the home barrel column (ratio of axon within the home column 0.96 ± 0.04). The axonal domain of cluster 2 interneurons was predominantly in layer 4 but some axonal collaterals were found to project vertically into layer 2/3 and 5 of the home column. In addition, axon collaterals of few cluster 2 interneurons projected laterally into neighboring barrels. This suggests that these interneurons have both intra- and translaminar target neurons (Supplementary Fig. 2). However, there was still some degree of morphological heterogeneity within the cluster 2 interneurons which may suggest a further subdivision of these L4 interneurons.
Cluster 3 interneurons were most frequently encountered. Their morphology was extremely stereotypic showing a highly barrel-confined axonal domain independent of the position of the interneuron within the barrel (n = 23; Figs 2C and 3A3–C3; Table 2; Supplementary Fig. 3). Because of this, these GABAergic L4 interneurons are likely to inhibit almost exclusively L4 neurons. Most probably, cluster 3 interneurons receive direct, monosynaptic thalamic input from the ventroposterial medial (VPM) nucleus of the thalamus (Porter et al. 2001) and therefore carry feed-forward inhibition to their target cells. The major distinguishing feature of cluster 3 neurons is their dense axonal arborization that is largely restricted to a single barrel (Fig. 3A3 and Supplementary Fig. 3). Given the strict axonal confinement to the barrel, the cluster 3 neurons will in the remainder of the text be referred to as L4 “barrel-confined inhibitory interneurons” (BIns). The total axonal length of those neurons was significantly lower than for cells projecting outside the barrel (16.0 ± 6.0 vs. 25.5 ± 11.4 mm, P< 0.05, cluster 3 vs. cluster 1; cf., Fig. 3A1 with Fig. 3A3). The fraction of the axon within barrel borders was significantly higher in BIns (0.89 ± 0.05 vs. 0.28 ± 0.11; P < 0.001). Consequently, there was also a strong confinement of these neurons to the home column, quantified as a high axon column ratio (0.99 ± 0.02). The average width of the home barrels as defined here was 279 ± 51 µm (n = 45), the average height of layer 4 was 234 ± 26 µm, and the average septum width was 59 ± 28 µm. In the remainder of this study, we focused on this type of L4 interneurons.
Table 2.
Properties of inhibitory and excitatory synaptic connections between L4 BIns and L4 spiny neurons
| Parameter | IPSPs (n = 13) mean ± SD | EPSPs (n = 6) mean ± SD |
|---|---|---|
| Postsynaptic Vm (mV)* | −55.0 ± 0.2 | −69.7 ± 2.7 |
| PSP amplitude (mV) | 0.93 ± 0.81 | 1.8 ± 1.7 |
| CV of PSP amplitude | 0.49 ± 0.25 | 0.34 ± 0.09 |
| Failure rate (%) | 14 ± 17 | 7 ± 9 |
| Latency (ms)** | 0.5 ± 0.1 | 1.0 ± 0.3 |
IPSPs were recorded at BIn–L4 spiny neuron connections at a membrane potential of −55 mV; EPSP were recorded at reciprocal L4 spiny neuron–BIn connection at resting membrane potential.
*Baseline membrane voltage for recording of IPSPs in postsynaptic L4 spiny neurons was set to a potential of −55 mV (see Materials and Methods section). The calculated IPSP amplitude at the resting membrane potential was 0.68 ± 0.82 mV.
**P < 0.001.
We also found differences between interneurons of the 3 different clusters with respect to the dendritic domain. Dendritic confinement to barrel borders was related to axonal confinement in all 3 clusters. Dendritic barrel ratios were significantly higher in BIns (represented by cluster 3 neurons, 0.91 ± 0.09) than for cluster 2 (0.79 ± 0.12, P < 0.01) or cluster 1 L4 interneurons (0.63 ± 0.24, P < 0.001). There was, however, no significant difference in total dendritic length between BIns (3.0 ± 1.4 mm) and cluster 2 (2.6 ± 0.9 mm, P = 0.35) or cluster 1 neurons (4.0 ± 2.1, P = 0.09).
Thus, we were able to identify 3 distinct barrel cortex L4 interneurons types using a cluster analysis based on their axonal projection pattern relative to the borders of the home barrel and barrel column. However, the electrophysiological properties of the anatomically distinct L4 interneurons identified here were rather similar (Fig. 3 and Table 1). To get a more complete understanding of their function, we performed a correlated analysis of their intrinsic and synaptic electrophysiological parameters.
Axonal Density Maps of L4 Interneurons
Maps of the “axonal density” were constructed using procedures described previously (Lübke et al. 2003; Helmstaedter et al. 2009a; Helmstaedter and Feldmeyer 2010). Density maps for individual interneurons of the same cluster were averaged. Figure 3B1–3 shows the corresponding average axonal density maps (blue) for all 3 different morphological clusters (cluster 1, n = 11; cluster 2, n = 11; cluster 3, n = 23). The contours of the density percentiles of BIns (cluster 3 interneurons) almost match the barrel outlines (Fig. 3B3). The axonal density map of cluster 2 interneurons is similar to that of cluster 3 interneurons but a low-density axonal projection to deep layer 2/3 is also visible (cf., Fig. 3B2 with Fig. 3B3). This may be partly due to the more widespread axonal arborization of cluster 2 cells (primarily to lower layer 2/3 of the home column) when compared with BIns. However, another parameter responsible for this difference is the higher absolute volume density of the axonal arborization in BIns. In BIns, axons exhibit a higher degree of collateralization than L4 interneurons belonging to cluster 1 or 2, leading to the very dense appearance of their axonal tree within the barrel (cf., Fig. 3A3 with Fig. 3A1,2; see also Supplementary Figs. 1–3).
Cluster 1 neurons display still a mainly column-confined axonal domain and reside largely within the borders of the respective home barrel column. Only few axon collaterals project into adjacent columns. However, they possess a prominent vertical axonal domain in layer 2/3 (Fig. 3A1 and Supplementary Fig. 1), where the axon arborizes extensively. Moreover, cluster 1 interneurons consistently show some long-range axonal branches descending into layer 5 (lower part of 90-percentile circle in Fig. 3B1). This implies that these interneurons target not only L4 and L2/3 neurons but may also innervate neurons in infragranular layers.
Intrinsic Electrophysiological Properties and Excitability Parameters of L4 Interneurons
The pool of 27 cells identified as BIns consisted of 12 neurons from single-cell recordings and 15 neurons from paired recordings. The latter were further evaluated for synaptic properties of the GABAergic synapse onto L4 spiny neurons within the same barrel (see below).
Action Potential Parameters
BIns had a mean AP threshold of 34.0 ± 7.6 mV, a mean AP half width of 0.32 ± 0.08 ms (n = 27) and a strong AHP (16.0 ± 3.5 mV). Also characteristic, though not measured quantitatively, was the rapid return of AHP to baseline membrane voltage, corresponding not only to deep but also sharply edged AHP curves. To compare these parameters between all 3 different clusters of interneurons, we used a non-parametric ANOVA (Kruskal–Wallis) test with Dunn's post-test analysis. Interneurons of all 3 morphological clusters displayed no significant statistical differences for any of these intrinsic physiological parameters (Table 1).
In previous studies on cortical interneurons, one of the most frequently used electrophysiological parameter for defining interneuron types is the maximum AP firing frequency, Fmax (e.g., Kawaguchi and Kubota 1997; Gibson et al. 1999; Sun et al. 2006; Gentet et al. 2010; for a review, see Ascoli et al. 2008; Gentet 2012). However, this parameter could not be used to differentiate between the 3 clusters of L4 interneurons described here. Interneurons of all 3 clusters showed a so-called “fast-spiking” (FS) firing pattern, independent of their often substantial morphological differences (see Fig. 3C1–3). Fmax was found to be high for all L4 interneurons and no significant statistical differences were observed. In BIns, Fmax at steady state (saturating frequency) was 279 ± 51 Hz; in L4 interneurons belonging to cluster 1 and cluster 2, Fmax was 293 ± 88 and 280 ± 55 Hz, respectively.
Analysis of PV and CB Antigen Expression
A subset of L4 interneurons (n = 10) was investigated for the presence of 2 calcium-binding proteins, PV and CB, respectively. PV is a common marker of FS interneurons (Kawaguchi and Kubota 1993, 1997; Rudy et al. 2011). For initial identification of the biocytin-filled neuron, we used AMCA-Streptavidin (Fig. 3D, upper panel). We recorded 6 BIns (cluster 3 neurons), which were all PV-positive but CB-negative as shown in Figure 3D. We also investigated 3 cluster 2 interneurons, which showed no immunoreactivity for either PV or CB. There was also one cluster 1 cell, which was PV-positive and CB-negative, like the cluster 3 cells.
The Unitary Synaptic Connections Between the L4 BIns and the L4 Spiny Neurons
The GABAergic Synapse Between L4 BIns and Spiny Neurons
A major postsynaptic target of GABAergic interneurons in layer 4 are excitatory L4 neurons, namely spiny stellate and star pyramidal cells (Porter et al. 2001; Ma et al. 2006; Sun et al. 2006). Thus, GABAergic interneurons are important elements of neuronal networks in the barrel cortex (Swadlow 2003) and shape the flow of excitation from the thalamus to L4 spiny neurons in a given cortical column (Armstrong-James et al. 1992; Helmstaedter et al. 2007; Meyer et al. 2010).
Efficacy, Reliability and Time Course of Synaptic Transmission
Inhibitory postsynaptic potentials at synaptic contacts between L4 FS interneurons and excitatory L4 spiny neurons were mediated exclusively by GABAA receptors: The IPSP was completely blocked by 25 µM gabazine, a GABAA receptor antagonist. No contribution of GABAB receptors to the inhibitory response was observed (data not shown).
The resting membrane potential of the postsynaptic L4 spiny neurons (−70 ± 8.2 mV) was close to the GABAergic IPSP reversal potential (which was calculated to be −84 ± 4.5 mV using the IV curve). Thus, the driving force for the current passing through GABAA receptors at resting potential is small; postsynaptic neurons were therefore held at a membrane potential of −55 mV to better resolve the inhibitory response (Fig. 4A). The mean unitary IPSP amplitude at BIn-L4 spiny neuron connections was 0.93 ± 0.81 mV (n = 27) under this condition; at resting potential, this amounts to a unitary IPSP amplitude of only 0.45 mV.
Figure 4.

Synaptic connection between L4 interneurons and spiny neurons. (A) Presynaptic AP (blue) in a L4 BIn (cluster 3 neuron) and 10 consecutive IPSPs (red) in a L4 spiny neuron recorded at a membrane potential of −55 mV. Note the amplitude fluctuation between individual IPSPs. (B) Distribution of the coefficient of IPSP variation for BIn–L4 spiny neuron connections. (C) Relationship between unitary IPSP amplitudes and CVs displaying a high reliability (low variation) even for small IPSP amplitudes (n = 13). The 2 dashed lines represent the predictions of simple binomial release statistics for the CV as a function of the IPSP amplitude assuming 4 synaptic contacts (close to the number of putative synaptic contacts identified for this connection) and low qS = 0.14 mV (left) and high qS = 0.6 mV (right), respectively. (D) Latency distribution for this synaptic connection; the average latency was 0.55 ± 0.12 ms. (E1) Paired pulse behavior at BIn–L4 spiny neuron connection. Five APs (blue) elicited in a BIn and individual IPSPs (light red) evoked in the L4 spiny neuron together with the corresponding average IPSP (red) are shown. (E2) Paired pulse depression for 5 consecutive IPSPs elicited by APs at either 100 ms (10 Hz) or 25 ms (40 Hz) intervals. At both frequencies, a marked depression can be observed. The depression at 25-ms intervals between APs is markedly stronger.
The coefficient of variation (CV) of the IPSP amplitudes was small for this connection (Fig. 4B), ranging from 0.21 to 1.1 with a mean of 0.49 ± 0.25 (Table 2). There was an inverse correlation between CV and IPSP amplitudes (Fig. 4C). In simple binomial models of synaptic transmission, this relationship is to be expected when the unitary IPSP amplitude is primarily determined by the neurotransmitter release probability (Pr, cf., Katz and Miledi 1972). For the BIn–L4 spiny neuron connection, the number of release sites (nb) was assumed to be nb = 4, a value close to the mean number of putative synaptic contacts found by light-microscopic inspection of close appositions between presynaptic axons and postsynaptic dendrites (see below). The 2 limiting curves in Figure 4C were calculated for a high quantal IPSP amplitude (qs) of 0.6 mV (dashed curve on the right), and a low qs of 0.14 mV (dashed curve on the left), respectively, with varying release probabilities. All unitary IPSP amplitudes except one (average IPSP amplitude: 3.2 ± 0.7 mV) fell between the 2 fitted curves. This is consistent with previous reports for excitatory intracortical connections (Markram et al. 1997; Feldmeyer et al. 1999, 2002, 2006). In accordance with these findings, the failure rate was low with an average of 0.14 ± 0.17 (range 0–0.52), suggesting a high reliability (i.e., release probability) of these synaptic contacts. The latency between the peak of the AP and the unitary IPSP at an individual synaptic connection showed very little variation (CV for latencies at any individual connection was <0.5). For that reason, individual latency histograms were narrow and displayed a single peak, indicating monosynaptic transmission of IPSPs. The chemical transmission of inhibitory signals at the BIn–L4 spiny neuron synapse appeared to be fast, as shown by short latencies distinctly below 1 ms (Fig. 4D). Latencies of all BIn–L4 spiny neuron cell pairs ranged from 0.38 to 0.80 ms and with a mean of 0.55 ± 0.12 ms. The rise and decay time of a typical IPSP were 1.3 ± 0.5 and 24 ± 6 ms, respectively, which is significantly longer than those of EPSPs in L4 spiny neurons (for a comparison, see below).
Paired Pulse Analysis
We recorded IPSPs (IPSP1–IPSP5) in response to a presynaptic burst of 5 APs, with time intervals between consecutive APs of 100 ms (corresponding to a frequency of 10 Hz), and 25 ms (40 Hz), respectively (Fig. 4E1,2). All inhibitory synaptic connections showed short-term depression at both 10 and 40 Hz, respectively (Fig. 4E1,2). There was no statistically significant difference in the degree of synaptic depression between the different morphological types of presynaptic interneurons (i.e., clusters 1–3 L4 interneurons).
In BIn–L4 spiny neuron pairs, the degree of synaptic depression was significantly stronger at a stimulation frequency of 40 Hz than at 10 Hz, as indicated by smaller ratio of between the amplitudes of the second to fourth IPSP relative to the first IPSP (IPSPx/IPSP1; Fig. 4E2): At 10 Hz frequency, the IPSP2/IPSP1 ratio was on average 0.83 ± 0.13 (n = 13) compared with a ratio of 0.68 ± 0.13 (n = 11, P < 0.01) at a frequency of 40 Hz.
Connectivity Within the Barrel
The assessment of the connection probability has certain experimental constraints, the most important factors being the position of the neurons within the slice as well as the slice-cutting angle. In our experiments, between 1 and 3 excitatory neurons had to be patched to find a inhibitory synaptic connection between a L4 interneuron and a L4 spiny neuron. We found a total of 29 L4 interneurons (data pooled together from all 3 morphological clusters) that were synaptically connected to a L4 spiny neuron in the same barrel (Figs 4 and 5). The calculated connectivity for the inhibitory connection of those 29 pairs was 67% (i.e., a total of 43 spiny neurons were patched to find 29 connections). All pairs with an established inhibitory connection were tested for a reciprocal excitatory contact. Out of the 29 cell pairs 20 were reciprocally connected, which translates into a excitatory connectivity ratio of 69% at L4-spiny neuron–L4 interneuron synapses. For BIn–L4 spiny neuron connections, in particular, we determined a connectivity ratio of 63% (n = 15 cell pairs); the reciprocal connection ratio was 67% (n = 10). Notably, in contrast to many excitatory neurons, these high connectivity ratios were independent of the distance between the somata of the pre- and postsynaptic neurons. This is likely to be due to the high density of both the L4 FS interneuron and the L4 spiny neuron axon within a cortical barrel. Somatic distances between pre- and postsynaptic neurons in a barrel were high with an average of 109 ± 39 µm (n = 19). Specifically for BIn–spiny neuron pairs, the average soma distance was 120 ± 43 µm (n = 11). As for unidirectional inhibitory connections, the likelihood of a reciprocal excitatory connection was independent of the distances between pre- and postsynaptic soma.
Figure 5.
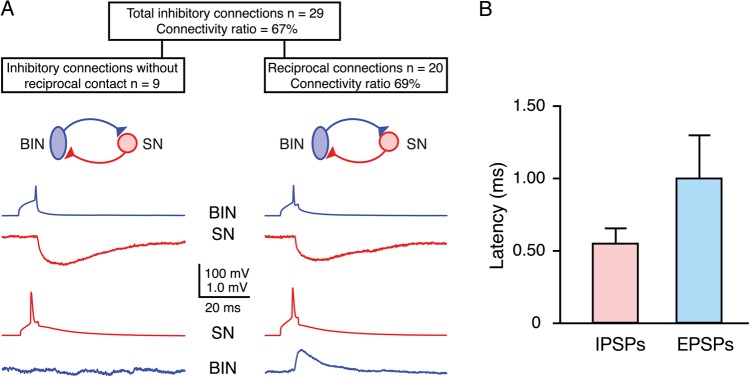
Connectivity between cell pairs of L4 interneurons and excitatory L4 spiny neurons. (A) Connectivity ratio for L4 FS interneuron–L4 spiny neuron pairs; inhibitory connectivity was found to be 67% (29 of 43 postsynaptic spiny neurons tested). Traces show average IPSPs (red, upper row) and EPSPs (blue, lower row) of unidirectional inhibitory connections (left) and reciprocal connections (right), respectively, between L4 BIns and spiny neurons (BIn, blue; SN, red). (B) AP-to-PSP latencies for reciprocal BIn–SN pairs in layer 4. The latency for the excitatory postsynaptic response was significantly longer than the inhibitory response (1.09 ± 0.31 vs. 0.55 ± 0.11 ms, P < 0.001).
Properties of Excitatory Synapses in Reciprocally Connected Pairs of L4 Interneurons and Spiny Neurons
Six of the ten reciprocally connected cell pairs were randomly chosen for detailed analysis of excitatory synaptic physiology. EPSP amplitudes varied strongly between individual neuronal cell pairs, with mean amplitudes ranging from 0.5 to 4.6 mV (Table 2). The CV of EPSP amplitudes was smaller than that of inhibitory connections (0.34 ± 0.09, Table 2). Together with a low failure rate (0.07 ± 0.09), this indicates that these excitatory connections are of a high reliability. The latency of the EPSPs was found to be 1.0 ± 0.3 ms, indicating that these connections are monosynaptic; however, it is significantly longer than for IPSPs (0.5 ± 0.1 ms, P < 0.001; Fig. 5B). This difference in latency may result at least in part from the different axonal geometries of BIns and L4 spiny neurons: The axon of L4 spiny neurons descends to layer 5A before ascending collaterals establish synaptic contacts with a BIn dendrite while a BIn axon remains within its home barrel and establishes contacts onto L4 spiny neuron dendrites at a much shorter axonal distance.
Quantitative Evaluation of Synaptic Contacts
Putative synaptic contacts for all reconstructed biocytin-labeled inhibitory L4 interneuron–L4 spiny neuron pairs were identified by light-microscopic examination (magnification ×100 objective and ×10 eyepiece; see Fig. 6, cf., Markram et al. 1997). In previous publications, we have shown using electron microscopic analysis that this allows a reliable identification of synaptic contacts established by presynaptic axons on postsynaptic dendrites (cf., Markram et al. 1997; Feldmeyer et al. 2002, 2006; Silver et al. 2003).
Figure 6.

Identification of synaptic contacts. (A) Low-power photomontage of a synaptically connected pair of a BIn and a spiny stellate cell that were filled with biocytin during recording. The 2 neurons showed reciprocal coupling. Putative, light microscopically identified GABAergic synaptic contacts between the presynaptic L4 interneuron (left) and the postsynaptic spiny stellate cell (right) are marked by green dots. Putative reciprocal excitatory synaptic contacts are indicated by blue dots. Asterisks highlight long axonal collaterals of the spiny stellate cell. (A1–5) High-power images of synaptic contacts. Blue open circles, inhibitory contacts (A1–3); green open circles, excitatory contacts (A4 and A5). (B) Neurolucida reconstruction of the same neuron pair shown in (A). Blue, L4 interneuron axon; red, L4 interneuron soma and dendrite; green, L4 spiny stellate axon; white, L4 spiny stellate soma and dendrite. The inset shows the dendritic arbor of pre- and postsynaptic neuron together with the putative synaptic contacts (same color code as for panel A).
The mean number of inhibitory contacts established by L4 FS interneurons onto L4 spiny neurons was 3.5 ± 1.2 (n = 17), ranging from 2 to 6 per connection (Fig. 7A inset, open bars). An analysis including only BIns gave almost identical values (3.7 ± 1.3 synaptic contact sites ranging from 2 to 6; n = 10; Figs 6 and 7A inset, filled bars). The geometric distance of each individual synaptic contact between the contact site on the postsynaptic dendrite and the postsynaptic soma was 64 ± 32 µm (range 3 to 126 µm, n = 59 contacts; Fig. 7A, open bars) for all inhibitory synaptic contacts from clusters 1–3 L4 interneurons. For BIn–L4 spiny neuron pairs, the contact to soma distance was 66 ± 32 µm (n = 37 contacts; Fig. 7A, filled bars). In accordance with their rather distant dendritic location, most contact sites were found on third-order dendrites of the postsynaptic L4 spiny neurons (for distribution of contact sites, see Table 2). No correlation between the number of synaptic contacts and the unitary IPSP amplitude at an individual GABAergic connection was observed. Furthermore, the number of inhibitory synaptic contacts per connection was not correlated with the distance between the somata of pre- and postsynaptic neurons for the BIn to L4 spiny neuron connection (Fig. 7B).
Figure 7.
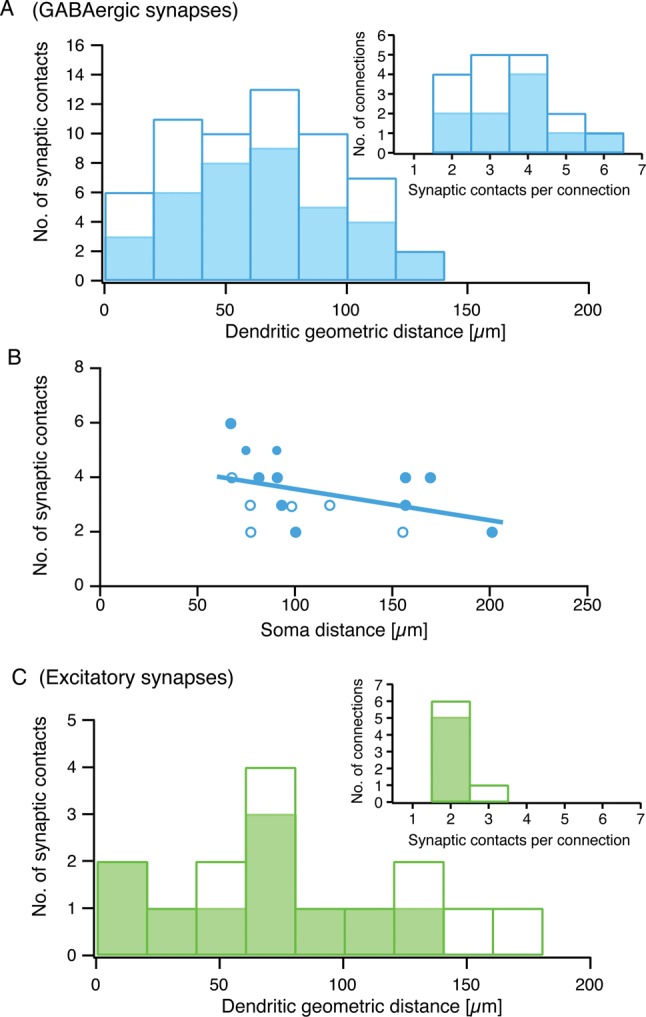
Synaptic contacts are broadly distributed along the postsynaptic dendritic tree. Individual geometric distances of the light microscopically identified putative synaptic contact sites in pairs of L4 interneurons and L4 spiny neurons (n = 17). (A) Bar histogram of geometric distances of putative inhibitory synaptic contacts to the soma of L4 spiny neurons. (B) Relationship between number of synaptic contacts and intersoma distance in BIn-L4 spiny neuron pairs. Filled circles represent BIn-L4 spiny neuron pairs, open circles connections with cluster 1 or 2 L4 interneurons. No correlation was found between the number of synaptic contacts and their distance from the soma. (C) Same diagram as in (A) but for excitatory synapses in reciprocally connected cell pairs (n = 7). Insets in (A) and (C) show the distribution of the number of synaptic contacts per connection. Filled bars in (A) and (C) and filled circles in (B) mark results obtained for BIn-L4 spiny neuron pairs alone, whereas open bars or circles represent connections including cluster 1 and cluster 2 FS L4 interneurons with L4 spiny neurons.
We also investigated the number of putative excitatory synaptic contacts in reciprocally connected cell pairs. We identified an average number of 2.1 ± 0.4 (n = 7; Fig. 7C inset, open bars) contact sites per connection onto all clusters 1–3 interneurons; for L4 spiny neuron–BIn pairs in particular, we found 2.0 ± 0.0 (n = 5) contacts (Figs 6 and 7C inset, filled bars). The mean geometric distance between soma and the excitatory contact site on L4 FS interneurons of all clusters was 81.2 ± 50.3 µm (n = 15) ranging from 11.5 to 164.4 µm. For L4 spiny neuron–BIn pairs, this value was 64.1 ± 40.6 µm (range 11.5–137.1 µm; n = 10), which is not different from the value obtained for all L4 interneurons (Fig. 7C). The number of excitatory synaptic contacts (i.e., at the L4 spiny neurons–L4 interneurons; Fig. 7C inset) showed a narrow distribution. A similarly narrow distribution of contact sites was also observed for synapses established between L4 spiny neurons and L2/3 pyramidal cells (Feldmeyer et al. 2002), although the average number of contacts was higher for that particular connection (4.5 ± 0.5; cf., Table 3 in Feldmeyer et al. 2002).
Discussion
In this study, we have identified the structural and synaptic properties of a specific interneuron type in layer 4 of rat barrel cortex. We found that a large fraction of L4 interneurons share a FS AP firing pattern but exhibit distinct axonal domains relative to the home barrel and the home barrel column. One of these L4 FS interneurons was a homogenous group we named BIn because of its remarkably dense axonal domain that is spatially confined to a single barrel in layer 4 of the somatosensory cortex. BIns show a very high connectivity to excitatory L4 spiny neurons and thus provide an effective inhibition of the excitatory signal flow in the barrel cortex. In brain slice preparations, axonal and/or dendritic truncations often lead to an underestimation of synaptic connectivity. For long-range synaptic connections, this is definitely the case. However, truncations are less likely for L4 BIn-L4 spiny neuron connections because the L4 BIn axons and the L4 spiny neuron dendrites are confined to a very small volume in the brain slice. This is also supported by the high-synaptic connectivity ratio found in our study.
FS Interneurons
BIns belong to the group of cortical FS interneurons that are characterized by short duration (<0.5 ms) APs and high maximal firing frequencies (>200 Hz). In the literature on cortical interneurons, FS interneurons have often been summarized into one single group (McCormick et al. 1985; Galarreta and Hestrin 1999; Gibson et al. 1999; Mancilla et al. 2007; for reviews, see Ascoli et al. 2008; Rudy et al. 2011). The present study demonstrates, however, that a fast AP firing pattern is a feature common to several structurally distinct types of interneurons with different axonal domains varying from a strictly barrel-confined one to one that innervates predominantly layers 3 and 5A. Because the axonal projection of an interneuron type is highly relevant for its intracortical connectivity and functional role in the cortical microcircuitry, the term “FS” cannot predict a particular interneuron type. It remains to be determined whether all FS interneuron types in a given cortical layer form one single network, as has been suggested previously (Galarreta and Hestrin 1999; Gibson et al. 1999), or whether interneuron networks are formed exclusively between interneurons of the same morphological type.
Differences in the active and passive electrophysiological characteristics of interneurons have also been linked to expression of certain proteins. Distinct patterns of PV or CB expression depending on different firing patterns have been identified for neocortical L5 non-pyramidal cells (Kawaguchi and Kubota 1993). Similarly, other FS neurons were found to contain PV and CB, although expression of PV appeared to be the more common feature (Cauli et al. 1997, 2000; Rudy et al. 2011). A categorization of GABAergic non-pyramidal cells in the neocortex based on antigen expression revealed overlapping expression patterns between the different subgroups of neurons (Kawaguchi and Kubota 1993, 1997; Kubota et al. 2011; see also Gentet 2012). Dumitriu et al. (2007) performed a detailed and correlated anatomical and physiological characterization of 3 subtypes of visual cortical interneurons in mice that express the green fluorescent protein in either PV, somatostatin, or neuropeptide Y expressing interneurons. The 3 interneuron types showed systematic differences in their dendritic and axonal morphology as well as in the properties of their respective excitatory and inhibitory synaptic inputs; however, PV-positive FS interneurons in a given layer were more or less homogeneous in their dendritic and axonal projection patterns. Triple labeling of interneurons in murine primary visual cortex with antibodies against PV, calretinin, and somatostatin revealed that throughout development, PV immunoreactivity never co-localizes with that for calretinin and/or somatostatin (Gonchar et al. 2007; see also Rudy et al. 2011). However, the analysis of the axonal projection pattern of FS interneurons in layer 4 in the barrel cortex revealed at least 2 distinct interneuron types, illustrating that both the immunohistochemical profile and the AP firing pattern does not simply match or predict the axonal projection types of PV-positive FS L4 interneurons.
Comparison with Previous Studies
BIns have several features in common with the “basket cell” type of neocortical FS interneurons (Peters and Regidor 1981; DeFelipe and Fairén 1982; Martin et al. 1983; Somogyi et al. 1983; Kawaguchi and Kubota 1997; Tamás et al. 1997, 1998; Povysheva et al. 2008; for a review, see Ascoli et al. 2008), namely, a FS pattern, the expression of the Ca2+-binding protein PV, and a highly local and dense axonal domain. In contrast to axo-axonic interneurons (e.g., Somogyi et al. 1982; DeFelipe et al. 1989; Rudy et al. 2011) that innervate exclusively the axon initial segment, basket cells establish multiple synaptic contacts on the somata and proximal dendrites of postsynaptic excitatory neurons (DeFelipe and Fairén 1982). The main functional role of this so-called perisomatic inhibition provided by basket cells was suggested to be a clockwork mechanism for cortical network oscillations (Freund and Katona 2007).
Generally, inhibition is considered perisomatic when GABAergic synaptic contacts are on the soma, or on dendrites within a relatively short distance from the postsynaptic soma (Megías et al. 2001; Papp et al. 2001; Freund and Katona 2007). Despite the morphological similarities, BIns do not act predominantly via perisomatic inhibition like basket cells; therefore, we decided to give them a new name that highlights their unique functional role in layer 4 of the barrel cortex. The majority of inhibitory synaptic contacts established by BIns onto the L4 spiny neurons are at a mean dendritic distance to the soma of 66 ± 32 µm. They were never located on first order but on second to fifth order dendrites. Some contacts were even found at geometric distances >100 µm (cf., Fig. 7A). The geometric distances of inhibitory contacts onto L4 spiny neurons are comparable to those of excitatory contacts found at L4–L4 or L4–L2/3 excitatory connections (Feldmeyer et al. 1999, 2002). Furthermore, the distribution of the dendritic distances of inhibitory synaptic contacts established by BIns onto L4 spiny neurons and of reciprocal excitatory contacts onto L4 BIns are similar (cf., Fig. 7A,C). Thus, GABAergic contacts are in a position to inhibit neighboring excitatory contacts on the same dendrite rather than the excitation via integration at the L4 spiny neuron soma.
GABAergic L4 interneurons in the somatosensory cortex with a highly localized axonal domain have been described previously. In his study, Lorente de Nó (who mistakenly identified the barrel cortex as acoustic cortex; Lorente de Nó 1922, 1992; Fairén 2007) showed a “camera lucida” drawing of a L4 neuron with a dense, barrel-confined axonal domain resembling that of the BIn characterized here. In another study, examples of L4 interneurons in the barrel cortex with a dense local axonal domain have also been demonstrated (Porter et al. 2001), but their morphology was not analyzed quantitatively and in correlation with the barrel column. These neurons were excited by thalamocortical afferents, are PV-positive and had fast AP firing patterns. It is likely that these neurons are identical to BIns. Feed-forward inhibition of L4 spiny neurons by FS L4 interneurons in rat barrel cortex was also investigated by Sun et al. (2006); however, the morphological characterization of this L4 interneuron type was not sufficient to allow a correlation with L4 BIns.
Functional Role of BIns
In combination with previous work, our study describes L4 BIns as PV-positive, FS interneurons in layer 4 of the barrel cortex that receive synaptic input directly from the VPM nucleus of the thalamus. They show an extremely high connectivity with L4 spiny neurons that in turn exhibit strong back projections onto L4 BIns. The BIn–L4 spiny neuron connectivity is extremely high the connectivity ratio of 60–70% found here is among the highest reported so far in the literature (e.g., Fino and Yuste 2011) and significantly larger than any described for excitatory synaptic connections in the barrel cortex (e.g., Helmstaedter et al. 2008; Lefort et al. 2009; Feldmeyer 2012).
In consequence, the BIn–L4 spiny neuron connections form a highly efficient feed-forward and feedback inhibitory microcircuit that terminates the excitation of L4 spiny neurons in their home barrel within 1–2 ms after its generation. Runaway excitation by prolonged AP firing of L4 spiny neurons is therefore blocked efficiently and, in consequence, the L4 excitatory neurons remain responsive to high-frequency synaptic input.
Under in vivo conditions, excitatory L4 neurons in rat barrel cortex respond to a single-whisker deflection or a thalamocortical stimulation with an initial fast depolarization that is rapidly curtailed by a membrane hyperpolarization (Swadlow 1995; Brecht and Sakmann 2002; Bruno and Simons 2002; Swadlow and Gusev 2002). The dense BIn–L4 spiny neuron network may be the structural basis of this powerful inhibitory mechanism. Consistent with this, we found short latencies at the inhibitory synapse between BIns and L4 spiny neurons (0.5 ± 0.1 ms for IPSPs, 1.0 ± 0.3 ms for EPSPs, P < 0.001; see Fig. 5B). This is probably due to the shorter axonal pathway of L4 BIns compared with L4 spiny neurons (Feldmeyer et al. 1999). Short latencies of simultaneously firing inhibitory neurons in a neuronal network will contribute to a high temporal resolution of the sensory system. Only within a brief time period, excitatory activity of L4 spiny neurons can be distributed to intra- and translaminar barrel cortex neurons and contribute to somatosensory perception; thereafter, excitation is effectively curtailed by GABAergic inhibition. Thus, BIns and other L4 interneurons generate a “brief window of excitability” during which spike generation in L4 spiny neurons can occur (Swadlow 2003) and can ultimately shut down excitation and “reset” spiking activity. This allows processing of a higher number of incoming signals (APs) within a given period of time and hence results in an improved frequency coding of sensory signals, a prerequisite for e.g. texture discrimination performed by mystacial vibrissae.
Supplementary Material
Supplementary material can be found at: http://www.cercor.oxfordjournals.org/.
Funding
This work was supported by the Max-Planck Society and grants from the Helmholtz Alliance for Systems Biology and the DfG-SNF Research Group BaCoFun. Funding to pay the Open Access publication charges for this article was provided by the Institute of Neuroscience and Medicine 2 (INM-2) of the Research Center Jülich.
Supplementary Material
Notes
The authors thank Marlies Kaiser for her excellent technical assistance, Gabriele Radnikow for critically reading the manuscript and Bert Sakmann for his continuous interest in and support of this study. Conflict of Interest: None declared.
References
- Agmon A, Connors BW. Thalamocortical responses of mouse somatosensory (barrel) cortex in vitro. Neuroscience. 1991;41:365–379. doi: 10.1016/0306-4522(91)90333-j. [DOI] [PubMed] [Google Scholar]
- Amitai Y, Gibson JR, Beierlein M, Patrick SL, Ho AM, Connors BW, Golomb D. The spatial dimensions of electrically coupled networks of interneurons in the neocortex. J Neurosci. 2002;22:4142–4152. doi: 10.1523/JNEUROSCI.22-10-04142.2002. [DOI] [PMC free article] [PubMed] [Google Scholar]
- Angulo MC, Staiger JF, Rossier J, Audinat E. Distinct local circuits between neocortical pyramidal cells and fast-spiking interneurons in young adult rats. J Neurophysiol. 2003;89:943–953. doi: 10.1152/jn.00750.2002. [DOI] [PubMed] [Google Scholar]
- Armstrong-James M, Fox K, Das-Gupta A. Flow of excitation within rat barrel cortex on striking a single vibrissa. J Neurophysiol. 1992;68:1345–1358. doi: 10.1152/jn.1992.68.4.1345. [DOI] [PubMed] [Google Scholar]
- Ascoli GA, Alonso-Nanclares L, Anderson SA, Barrionuevo G, Benavides-Piccione R, Burkhalter A, Buzsáki G, Cauli B, DeFelipe J, Fairén A, et al. Petilla terminology: nomenclature of features of GABAergic interneurons of the cerebral cortex. Nat Rev Neurosci. 2008;9:557–568. doi: 10.1038/nrn2402. [DOI] [PMC free article] [PubMed] [Google Scholar]
- Avermann M, Tomm C, Mateo C, Gerstner W, Petersen CC. Microcircuits of excitatory and inhibitory neurons in layer 2/3 of mouse barrel cortex. J Neurophysiol. 2012;107:3116–3134. doi: 10.1152/jn.00917.2011. [DOI] [PubMed] [Google Scholar]
- Branco T, Staras K. The probability of neurotransmitter release: variability and feedback control at single synapses. Nat Rev Neurosci. 2009;10:373–383. doi: 10.1038/nrn2634. [DOI] [PubMed] [Google Scholar]
- Brecht M, Sakmann B. Dynamic representation of whisker deflection by synaptic potentials in spiny stellate and pyramidal cells in the barrels and septa of layer 4 rat somatosensory cortex. J Physiol. 2002;543:49–70. doi: 10.1113/jphysiol.2002.018465. [DOI] [PMC free article] [PubMed] [Google Scholar]
- Bruno RM, Simons DJ. Feedforward mechanisms of excitatory and inhibitory cortical receptive fields. J Neurosci. 2002;22:10966–10975. doi: 10.1523/JNEUROSCI.22-24-10966.2002. [DOI] [PMC free article] [PubMed] [Google Scholar]
- Cauli B, Audinat E, Lambolez B, Angulo MC, Ropert N, Tsuzuki K, Hestrin S, Rossier J. Molecular and physiological diversity of cortical nonpyramidal cells. J Neurosci. 1997;17:3894–3906. doi: 10.1523/JNEUROSCI.17-10-03894.1997. [DOI] [PMC free article] [PubMed] [Google Scholar]
- Cauli B, Porter JT, Tsuzuki K, Lambolez B, Rossier J, Quenet B, Audinat E. Classification of fusiform neocortical interneurons based on unsupervised clustering. Proc Natl Acad Sci USA. 2000;97:6144–6149. doi: 10.1073/pnas.97.11.6144. [DOI] [PMC free article] [PubMed] [Google Scholar]
- Cauli B, Tong XK, Rancillac A, Serluca N, Lambolez B, Rossier J, Hamel E. Cortical GABA interneurons in neurovascular coupling: relays for subcortical vasoactive pathways. J Neurosci. 2004;24:8940–8949. doi: 10.1523/JNEUROSCI.3065-04.2004. [DOI] [PMC free article] [PubMed] [Google Scholar]
- Chittajallu R, Pelkey KA, McBain CJ. Neurogliaform cells dynamically regulate somatosensory integration via synapse-specific modulation. Nat Neurosci. 2013;16:13–15. doi: 10.1038/nn.3284. [DOI] [PMC free article] [PubMed] [Google Scholar]
- Connors BW, Gutnick MJ. Intrinsic firing patterns of diverse neocortical neurons. Trends Neurosci. 1990;13:99–104. doi: 10.1016/0166-2236(90)90185-d. [DOI] [PubMed] [Google Scholar]
- Connors BW, Gutnick MJ, Prince DA. Electrophysiological properties of neocortical neurons in vitro. J Neurophysiol. 1982;48:1302–1320. doi: 10.1152/jn.1982.48.6.1302. [DOI] [PubMed] [Google Scholar]
- DeFelipe J, Fairén A. A type of basket cell in superficial layers of the cat visual cortex. A Golgi-electron microscope study. Brain Res. 1982;244:9–16. doi: 10.1016/0006-8993(82)90898-8. [DOI] [PubMed] [Google Scholar]
- DeFelipe J, Hendry SH, Jones EG. Visualization of chandelier cell axons by parvalbumin immunoreactivity in monkey cerebral cortex. Proc Natl Acad Sci USA. 1989;86:2093–2097. doi: 10.1073/pnas.86.6.2093. [DOI] [PMC free article] [PubMed] [Google Scholar]
- DeFelipe J, López-Cruz PL, Benavides-Piccione R, Bielza C, Larrañaga P, Anderson S, Burkhalter A, Cauli B, Fairén A, Feldmeyer D, et al. New insights in the classification and nomenclature of cortical GABAergic interneurons. Nat Rev Neurosci. 2013;15 doi: 10.1038/nrn3444. 202–216. [DOI] [PMC free article] [PubMed] [Google Scholar]
- Dumitriu D, Cossart R, Huang J, Yuste R. Correlation between axonal morphologies and synaptic input kinetics of interneurons from mouse visual cortex. Cereb Cortex. 2007;17:81–91. doi: 10.1093/cercor/bhj126. [DOI] [PubMed] [Google Scholar]
- Fairén A. Cajal and Lorente de Nó on cortical interneurons: coincidences and progress. Brain Res Brain Res Rev. 2007;55:430–444. doi: 10.1016/j.brainresrev.2007.06.004. [DOI] [PubMed] [Google Scholar]
- Feldmeyer D. Excitatory neuronal connectivity in the barrel cortex. Front Neuroanat. 2012;6:24. doi: 10.3389/fnana.2012.00024. [DOI] [PMC free article] [PubMed] [Google Scholar]
- Feldmeyer D, Egger V, Lübke J, Sakmann B. Reliable synaptic connections between pairs of excitatory layer 4 neurones within a single ‘barrel’ of developing rat somatosensory cortex. J Physiol. 1999;521(Pt 1):169–190. doi: 10.1111/j.1469-7793.1999.00169.x. [DOI] [PMC free article] [PubMed] [Google Scholar]
- Feldmeyer D, Lübke J, Sakmann B. Efficacy and connectivity of intracolumnar pairs of layer 2/3 pyramidal cells in the barrel cortex of juvenile rats. J Physiol. 2006;575:583–602. doi: 10.1113/jphysiol.2006.105106. [DOI] [PMC free article] [PubMed] [Google Scholar]
- Feldmeyer D, Lübke J, Silver RA, Sakmann B. Synaptic connections between layer 4 spiny neurone-layer 2/3 pyramidal cell pairs in juvenile rat barrel cortex: physiology and anatomy of interlaminar signalling within a cortical column. J Physiol. 2002;538:803–822. doi: 10.1113/jphysiol.2001.012959. [DOI] [PMC free article] [PubMed] [Google Scholar]
- Fino E, Yuste R. Dense inhibitory connectivity in neocortex. Neuron. 2011;69:1188–1203. doi: 10.1016/j.neuron.2011.02.025. [DOI] [PMC free article] [PubMed] [Google Scholar]
- Freund TF, Katona I. Perisomatic inhibition. Neuron. 2007;56:33–42. doi: 10.1016/j.neuron.2007.09.012. [DOI] [PubMed] [Google Scholar]
- Galarreta M, Hestrin S. A network of fast-spiking cells in the neocortex connected by electrical synapses. Nature. 1999;402:72–75. doi: 10.1038/47029. [DOI] [PubMed] [Google Scholar]
- Gentet LJ. Functional diversity of supragranular GABAergic neurons in the barrel cortex. Front Neural Circuits. 2012;6:52. doi: 10.3389/fncir.2012.00052. [DOI] [PMC free article] [PubMed] [Google Scholar]
- Gentet LJ, Avermann M, Matyas F, Staiger JF, Petersen CC. Membrane potential dynamics of GABAergic neurons in the barrel cortex of behaving mice. Neuron. 2010;65:422–435. doi: 10.1016/j.neuron.2010.01.006. [DOI] [PubMed] [Google Scholar]
- Gibson JR, Beierlein M, Connors BW. Two networks of electrically coupled inhibitory neurons in neocortex. Nature. 1999;402:75–79. doi: 10.1038/47035. [DOI] [PubMed] [Google Scholar]
- Gonchar Y, Wang Q, Burkhalter A. Multiple distinct subtypes of GABAergic neurons in mouse visual cortex identified by triple immunostaining. Front Neuroanat. 2007;1:3. doi: 10.3389/neuro.05.003.2007. [DOI] [PMC free article] [PubMed] [Google Scholar]
- Gupta A, Wang Y, Markram H. Organizing principles for a diversity of GABAergic interneurons and synapses in the neocortex. Science. 2000;287:273–278. doi: 10.1126/science.287.5451.273. [DOI] [PubMed] [Google Scholar]
- Helmstaedter M, de Kock CP, Feldmeyer D, Bruno RM, Sakmann B. Reconstruction of an average cortical column in silico. Brain Res Brain Res Rev. 2007;55:193–203. doi: 10.1016/j.brainresrev.2007.07.011. [DOI] [PubMed] [Google Scholar]
- Helmstaedter M, Sakmann B, Feldmeyer D. Neuronal correlates of local, lateral, and translaminar inhibition with reference to cortical columns. Cereb Cortex. 2009a;19:926–937. doi: 10.1093/cercor/bhn141. [DOI] [PubMed] [Google Scholar]
- Helmstaedter M, Sakmann B, Feldmeyer D. The relation between dendritic geometry, electrical excitability, and axonal projections of L2/3 interneurons in rat barrel cortex. Cereb Cortex. 2009b;19:938–950. doi: 10.1093/cercor/bhn138. [DOI] [PubMed] [Google Scholar]
- Helmstaedter M, Sakmann B, Feldmeyer D. L2/3 interneuron groups defined by multiparameter analysis of axonal projection, dendritic geometry, and electrical excitability. Cereb Cortex. 2009c;19:951–962. doi: 10.1093/cercor/bhn130. [DOI] [PubMed] [Google Scholar]
- Helmstaedter M, Staiger JF, Sakmann B, Feldmeyer D. Efficient recruitment of layer 2/3 interneurons by layer 4 input in single columns of rat somatosensory cortex. J Neurosci. 2008;28:8273–8284. doi: 10.1523/JNEUROSCI.5701-07.2008. [DOI] [PMC free article] [PubMed] [Google Scholar]
- Helmstaedter MN, Feldmeyer D. Axons predict neuronal connectivity within and between cortical columns and serve as primary classifiers of interneurons in a cortical column. In: Feldmeyer D, Lübke JHR, editors. New aspects of axonal structure and function. 1st ed. New York, Dordrecht, Heidelberg, London: Springer Science + Business Media; 2010. pp. 141–155. P. [Google Scholar]
- Inda MC, DeFelipe J, Muñoz A. The distribution of chandelier cell axon terminals that express the GABA plasma membrane transporter GAT-1 in the human neocortex. Cereb Cortex. 2007;17:2060–2071. doi: 10.1093/cercor/bhl114. [DOI] [PubMed] [Google Scholar]
- Karagiannis A, Gallopin T, David C, Battaglia D, Geoffroy H, Rossier J, Hillman EM, Staiger JF, Cauli B. Classification of NPY-expressing neocortical interneurons. J Neurosci. 2009;29:3642–3659. doi: 10.1523/JNEUROSCI.0058-09.2009. [DOI] [PMC free article] [PubMed] [Google Scholar]
- Katz B, Miledi R. The statistical nature of the acetycholine potential and its molecular components. J Physiol. 1972;224:665–699. doi: 10.1113/jphysiol.1972.sp009918. [DOI] [PMC free article] [PubMed] [Google Scholar]
- Kawaguchi Y, Kondo S. Parvalbumin, somatostatin and cholecystokinin as chemical markers for specific GABAergic interneuron types in the rat frontal cortex. J Neurocytol. 2002;31:277–287. doi: 10.1023/a:1024126110356. [DOI] [PubMed] [Google Scholar]
- Kawaguchi Y, Kubota Y. Correlation of physiological subgroupings of nonpyramidal cells with parvalbumin- and calbindinD28k-immunoreactive neurons in layer V of rat frontal cortex. J Neurophysiol. 1993;70:387–396. doi: 10.1152/jn.1993.70.1.387. [DOI] [PubMed] [Google Scholar]
- Kawaguchi Y, Kubota Y. GABAergic cell subtypes and their synaptic connections in rat frontal cortex. Cereb Cortex. 1997;7:476–486. doi: 10.1093/cercor/7.6.476. [DOI] [PubMed] [Google Scholar]
- Kubota Y, Kawaguchi Y. Three classes of GABAergic interneurons in neocortex and neostriatum. Jpn J Physiol. 1994;44(Suppl 2):S145–S148. [PubMed] [Google Scholar]
- Kubota Y, Shigematsu N, Karube F, Sekigawa A, Kato S, Yamaguchi N, Hirai Y, Morishima M, Kawaguchi Y. Selective coexpression of multiple chemical markers defines discrete populations of neocortical GABAergic neurons. Cereb Cortex. 2011;21:1803–1817. doi: 10.1093/cercor/bhq252. [DOI] [PubMed] [Google Scholar]
- Land PW, Kandler K. Somatotopic organization of rat thalamocortical slices. J Neurosci Methods. 2002;119:15–21. doi: 10.1016/s0165-0270(02)00150-4. [DOI] [PubMed] [Google Scholar]
- Lefort S, Tomm C, Floyd Sarria JC, Petersen CC. The excitatory neuronal network of the C2 barrel column in mouse primary somatosensory cortex. Neuron. 2009;61:301–316. doi: 10.1016/j.neuron.2008.12.020. [DOI] [PubMed] [Google Scholar]
- Lorente de Nó R. La corteza cerebral del ratón (Primera contribución -La corteza acústica) Trabajos del Laboratorio de Investigaciones Biologicas de la Universidad de Madrid. 1922;20:41–78. [Google Scholar]
- Lorente de Nó R. The cerebral cortex of the mouse (a first contribution—the “acoustic” cortex) Somatosens Mot Res. 1992;9:3–36. doi: 10.3109/08990229209144760. [DOI] [PubMed] [Google Scholar]
- Lübke J, Roth A, Feldmeyer D, Sakmann B. Morphometric analysis of the columnar innervation domain of neurons connecting layer 4 and layer 2/3 of juvenile rat barrel cortex. Cereb Cortex. 2003;13:1051–1063. doi: 10.1093/cercor/13.10.1051. [DOI] [PubMed] [Google Scholar]
- Ma Y, Hu H, Berrebi AS, Mathers PH, Agmon A. Distinct subtypes of somatostatin-containing neocortical interneurons revealed in transgenic mice. J Neurosci. 2006;26:5069–5082. doi: 10.1523/JNEUROSCI.0661-06.2006. [DOI] [PMC free article] [PubMed] [Google Scholar]
- Mancilla JG, Lewis TJ, Pinto DJ, Rinzel J, Connors BW. Synchronization of electrically coupled pairs of inhibitory interneurons in neocortex. J Neurosci. 2007;27:2058–2073. doi: 10.1523/JNEUROSCI.2715-06.2007. [DOI] [PMC free article] [PubMed] [Google Scholar]
- Markram H, Lübke J, Frotscher M, Roth A, Sakmann B. Physiology and anatomy of synaptic connections between thick tufted pyramidal neurones in the developing rat neocortex. J Physiol. 1997;500(Pt 2):409–440. doi: 10.1113/jphysiol.1997.sp022031. [DOI] [PMC free article] [PubMed] [Google Scholar]
- Markram H, Toledo-Rodriguez M, Wang Y, Gupta A, Silberberg G, Wu C. Interneurons of the neocortical inhibitory system. Nat Rev Neurosci. 2004;5:793–807. doi: 10.1038/nrn1519. [DOI] [PubMed] [Google Scholar]
- Martin KA, Somogyi P, Whitteridge D. Physiological and morphological properties of identified basket cells in the cat’'s visual cortex. Exp Brain Res. 1983;50:193–200. doi: 10.1007/BF00239183. [DOI] [PubMed] [Google Scholar]
- Marx M, Günter RH, Hucko W, Radnikow G, Feldmeyer D. Improved biocytin labeling and neuronal 3D reconstruction. Nat Protoc. 2012;7:394–407. doi: 10.1038/nprot.2011.449. [DOI] [PubMed] [Google Scholar]
- McCormick DA, Connors BW, Lighthall JW, Prince DA. Comparative electrophysiology of pyramidal and sparsely spiny stellate neurons of the neocortex. J Neurophysiol. 1985;54:782–806. doi: 10.1152/jn.1985.54.4.782. [DOI] [PubMed] [Google Scholar]
- Megías M, Emri Z, Freund TF, Gulyás AI. Total number and distribution of inhibitory and excitatory synapses on hippocampal CA1 pyramidal cells. Neuroscience. 2001;102:527–540. doi: 10.1016/s0306-4522(00)00496-6. [DOI] [PubMed] [Google Scholar]
- Meyer HS, Schwarz D, Wimmer VC, Schmitt AC, Kerr JN, Sakmann B, Helmstaedter M. Inhibitory interneurons in a cortical column form hot zones of inhibition in layers 2 and 5A. Proc Natl Acad Sci USA. 2011;108:16807–16812. doi: 10.1073/pnas.1113648108. [DOI] [PMC free article] [PubMed] [Google Scholar]
- Meyer HS, Wimmer VC, Hemberger M, Bruno RM, de Kock CP, Frick A, Sakmann B, Helmstaedter M. Cell type-specific thalamic innervation in a column of rat vibrissal cortex. Cereb Cortex. 2010;20:2287–2303. doi: 10.1093/cercor/bhq069. [DOI] [PMC free article] [PubMed] [Google Scholar]
- Müller-Paschinger IB, Tömböl T, Petsche H. Chandelier neurons within the rabbits’ cerebral cortex. A Golgi study. Anat Embryol (Berl) 1983;166:149–154. doi: 10.1007/BF00317950. [DOI] [PubMed] [Google Scholar]
- Nogueira-Campos AA, Finamore DM, Imbiriba LA, Houzel JC, Franca JG. Distribution and morphology of nitrergic neurons across functional domains of the rat primary somatosensory cortex. Front Neural Circuits. 2012;6:57. doi: 10.3389/fncir.2012.00057. [DOI] [PMC free article] [PubMed] [Google Scholar]
- Papp E, Leinekugel X, Henze DA, Lee J, Buzsáki G. The apical shaft of CA1 pyramidal cells is under GABAergic interneuronal control. Neuroscience. 2001;102:715–721. doi: 10.1016/s0306-4522(00)00584-4. [DOI] [PubMed] [Google Scholar]
- Perrenoud Q, Geoffroy H, Gauthier B, Rancillac A, Alfonsi F, Kessaris N, Rossier J, Vitalis T, Gallopin T. Characterization of type I and Type II nNOS-expressing interneurons in the barrel cortex of mouse. Front Neural Circuits. 2012;6:36. doi: 10.3389/fncir.2012.00036. [DOI] [PMC free article] [PubMed] [Google Scholar]
- Peters A, Regidor J. A reassessment of the forms of nonpyramidal neurons in area 17 of cat visual cortex. J Comp Neurol. 1981;203:685–716. doi: 10.1002/cne.902030408. [DOI] [PubMed] [Google Scholar]
- Porter JT, Johnson CK, Agmon A. Diverse types of interneurons generate thalamus-evoked feedforward inhibition in the mouse barrel cortex. J Neurosci. 2001;21:2699–2710. doi: 10.1523/JNEUROSCI.21-08-02699.2001. [DOI] [PMC free article] [PubMed] [Google Scholar]
- Povysheva NV, Zaitsev AV, Rotaru DC, Gonzalez-Burgos G, Lewis DA, Krimer LS. Parvalbumin-positive basket interneurons in monkey and rat prefrontal cortex. J Neurophysiol. 2008;100:2348–2360. doi: 10.1152/jn.90396.2008. [DOI] [PMC free article] [PubMed] [Google Scholar]
- Radnikow G, Günter RH, Marx M, Feldmeyer D. Morpho-functional mapping of cortical networks in brain slice preparations using paired electrophysiological recordings. In: Fellin T, Halassa M, editors. Neuromethods: Neuronal Network Analysis. New York: Humana Press; 2012. pp. 405–431. An imprint of Springer Science + Business Media, LLC 2011. [Google Scholar]
- Rudy B, Fishell G, Lee S, Hjerling-Leffler J. Three groups of interneurons account for nearly 100% of neocortical GABAergic neurons. Dev Neurobiol. 2011;71:45–61. doi: 10.1002/dneu.20853. [DOI] [PMC free article] [PubMed] [Google Scholar]
- Silver RA, Lübke J, Sakmann B, Feldmeyer D. High-probability uniquantal transmission at excitatory synapses in barrel cortex. Science. 2003;302:1981–1984. doi: 10.1126/science.1087160. [DOI] [PubMed] [Google Scholar]
- Soltesz I. Diversity in the neuronal machine: order and variability in interneuronal microcircuits. Oxford, NY: Oxford University Press; 2006. [Google Scholar]
- Somogyi P, Freund TF, Cowey A. The axo-axonic interneuron in the cerebral cortex of the rat, cat and monkey. Neuroscience. 1982;7:2577–2607. doi: 10.1016/0306-4522(82)90086-0. [DOI] [PubMed] [Google Scholar]
- Somogyi P, Kisvárday ZF, Martin KA, Whitteridge D. Synaptic connections of morphologically identified and physiologically characterized large basket cells in the striate cortex of cat. Neuroscience. 1983;10:261–294. doi: 10.1016/0306-4522(83)90133-1. [DOI] [PubMed] [Google Scholar]
- Somogyi P, Tamás G, Luján R, Buhl EH. Salient features of synaptic organisation in the cerebral cortex. Brain Res Brain Res Rev. 1998;26:113–135. doi: 10.1016/s0165-0173(97)00061-1. [DOI] [PubMed] [Google Scholar]
- Sun QQ, Huguenard JR, Prince DA. Barrel cortex microcircuits: thalamocortical feedforward inhibition in spiny stellate cells is mediated by a small number of fast-spiking interneurons. J Neurosci. 2006;26:1219–1230. doi: 10.1523/JNEUROSCI.4727-04.2006. [DOI] [PMC free article] [PubMed] [Google Scholar]
- Swadlow HA. Fast-spike interneurons and feedforward inhibition in awake sensory neocortex. Cereb Cortex. 2003;13:25–32. doi: 10.1093/cercor/13.1.25. [DOI] [PubMed] [Google Scholar]
- Swadlow HA. Influence of VPM afferents on putative inhibitory interneurons in S1 of the awake rabbit: evidence from cross-correlation, microstimulation, and latencies to peripheral sensory stimulation. J Neurophysiol. 1995;73:1584–1599. doi: 10.1152/jn.1995.73.4.1584. [DOI] [PubMed] [Google Scholar]
- Swadlow HA, Gusev AG. Receptive-field construction in cortical inhibitory interneurons. Nat Neurosci. 2002;5:403–404. doi: 10.1038/nn847. [DOI] [PubMed] [Google Scholar]
- Tamás G, Buhl EH, Somogyi P. Fast IPSPs elicited via multiple synaptic release sites by different types of GABAergic neuron in the cat visual cortex. J Physiol. 1997;500(Pt 3):715–738. doi: 10.1113/jphysiol.1997.sp022054. [DOI] [PMC free article] [PubMed] [Google Scholar]
- Tamás G, Somogyi P, Buhl EH. Differentially interconnected networks of GABAergic interneurons in the visual cortex of the cat. J Neurosci. 1998;18:4255–4270. doi: 10.1523/JNEUROSCI.18-11-04255.1998. [DOI] [PMC free article] [PubMed] [Google Scholar]
- Tamás G, Szabadics J. Summation of unitary IPSPs elicited by identified axo-axonic interneurons. Cereb Cortex. 2004;14:823–826. doi: 10.1093/cercor/bhh051. [DOI] [PubMed] [Google Scholar]
- Thorndike RL. Who belongs in the family? Psychometrika. 1953;18:267–276. [Google Scholar]
- Ward JH. Hierarchical grouping to optimize an objective function. J Am Stat Assoc. 1963;58:236–244. [Google Scholar]
- Woodruff A, Xu Q, Anderson SA, Yuste R. Depolarizing effect of neocortical chandelier neurons. Front Neural Circuits. 2009;3:15. doi: 10.3389/neuro.04.015.2009. [DOI] [PMC free article] [PubMed] [Google Scholar]
- Xu H, Jeong H-Y, Tremblay R, Rudy B. Neocortical somatostatin-expressing GABAergic interneurons disinhibit the thalamorecipient layer 4. Neuron. 2013;77:155–167. doi: 10.1016/j.neuron.2012.11.004. [DOI] [PMC free article] [PubMed] [Google Scholar]
Associated Data
This section collects any data citations, data availability statements, or supplementary materials included in this article.
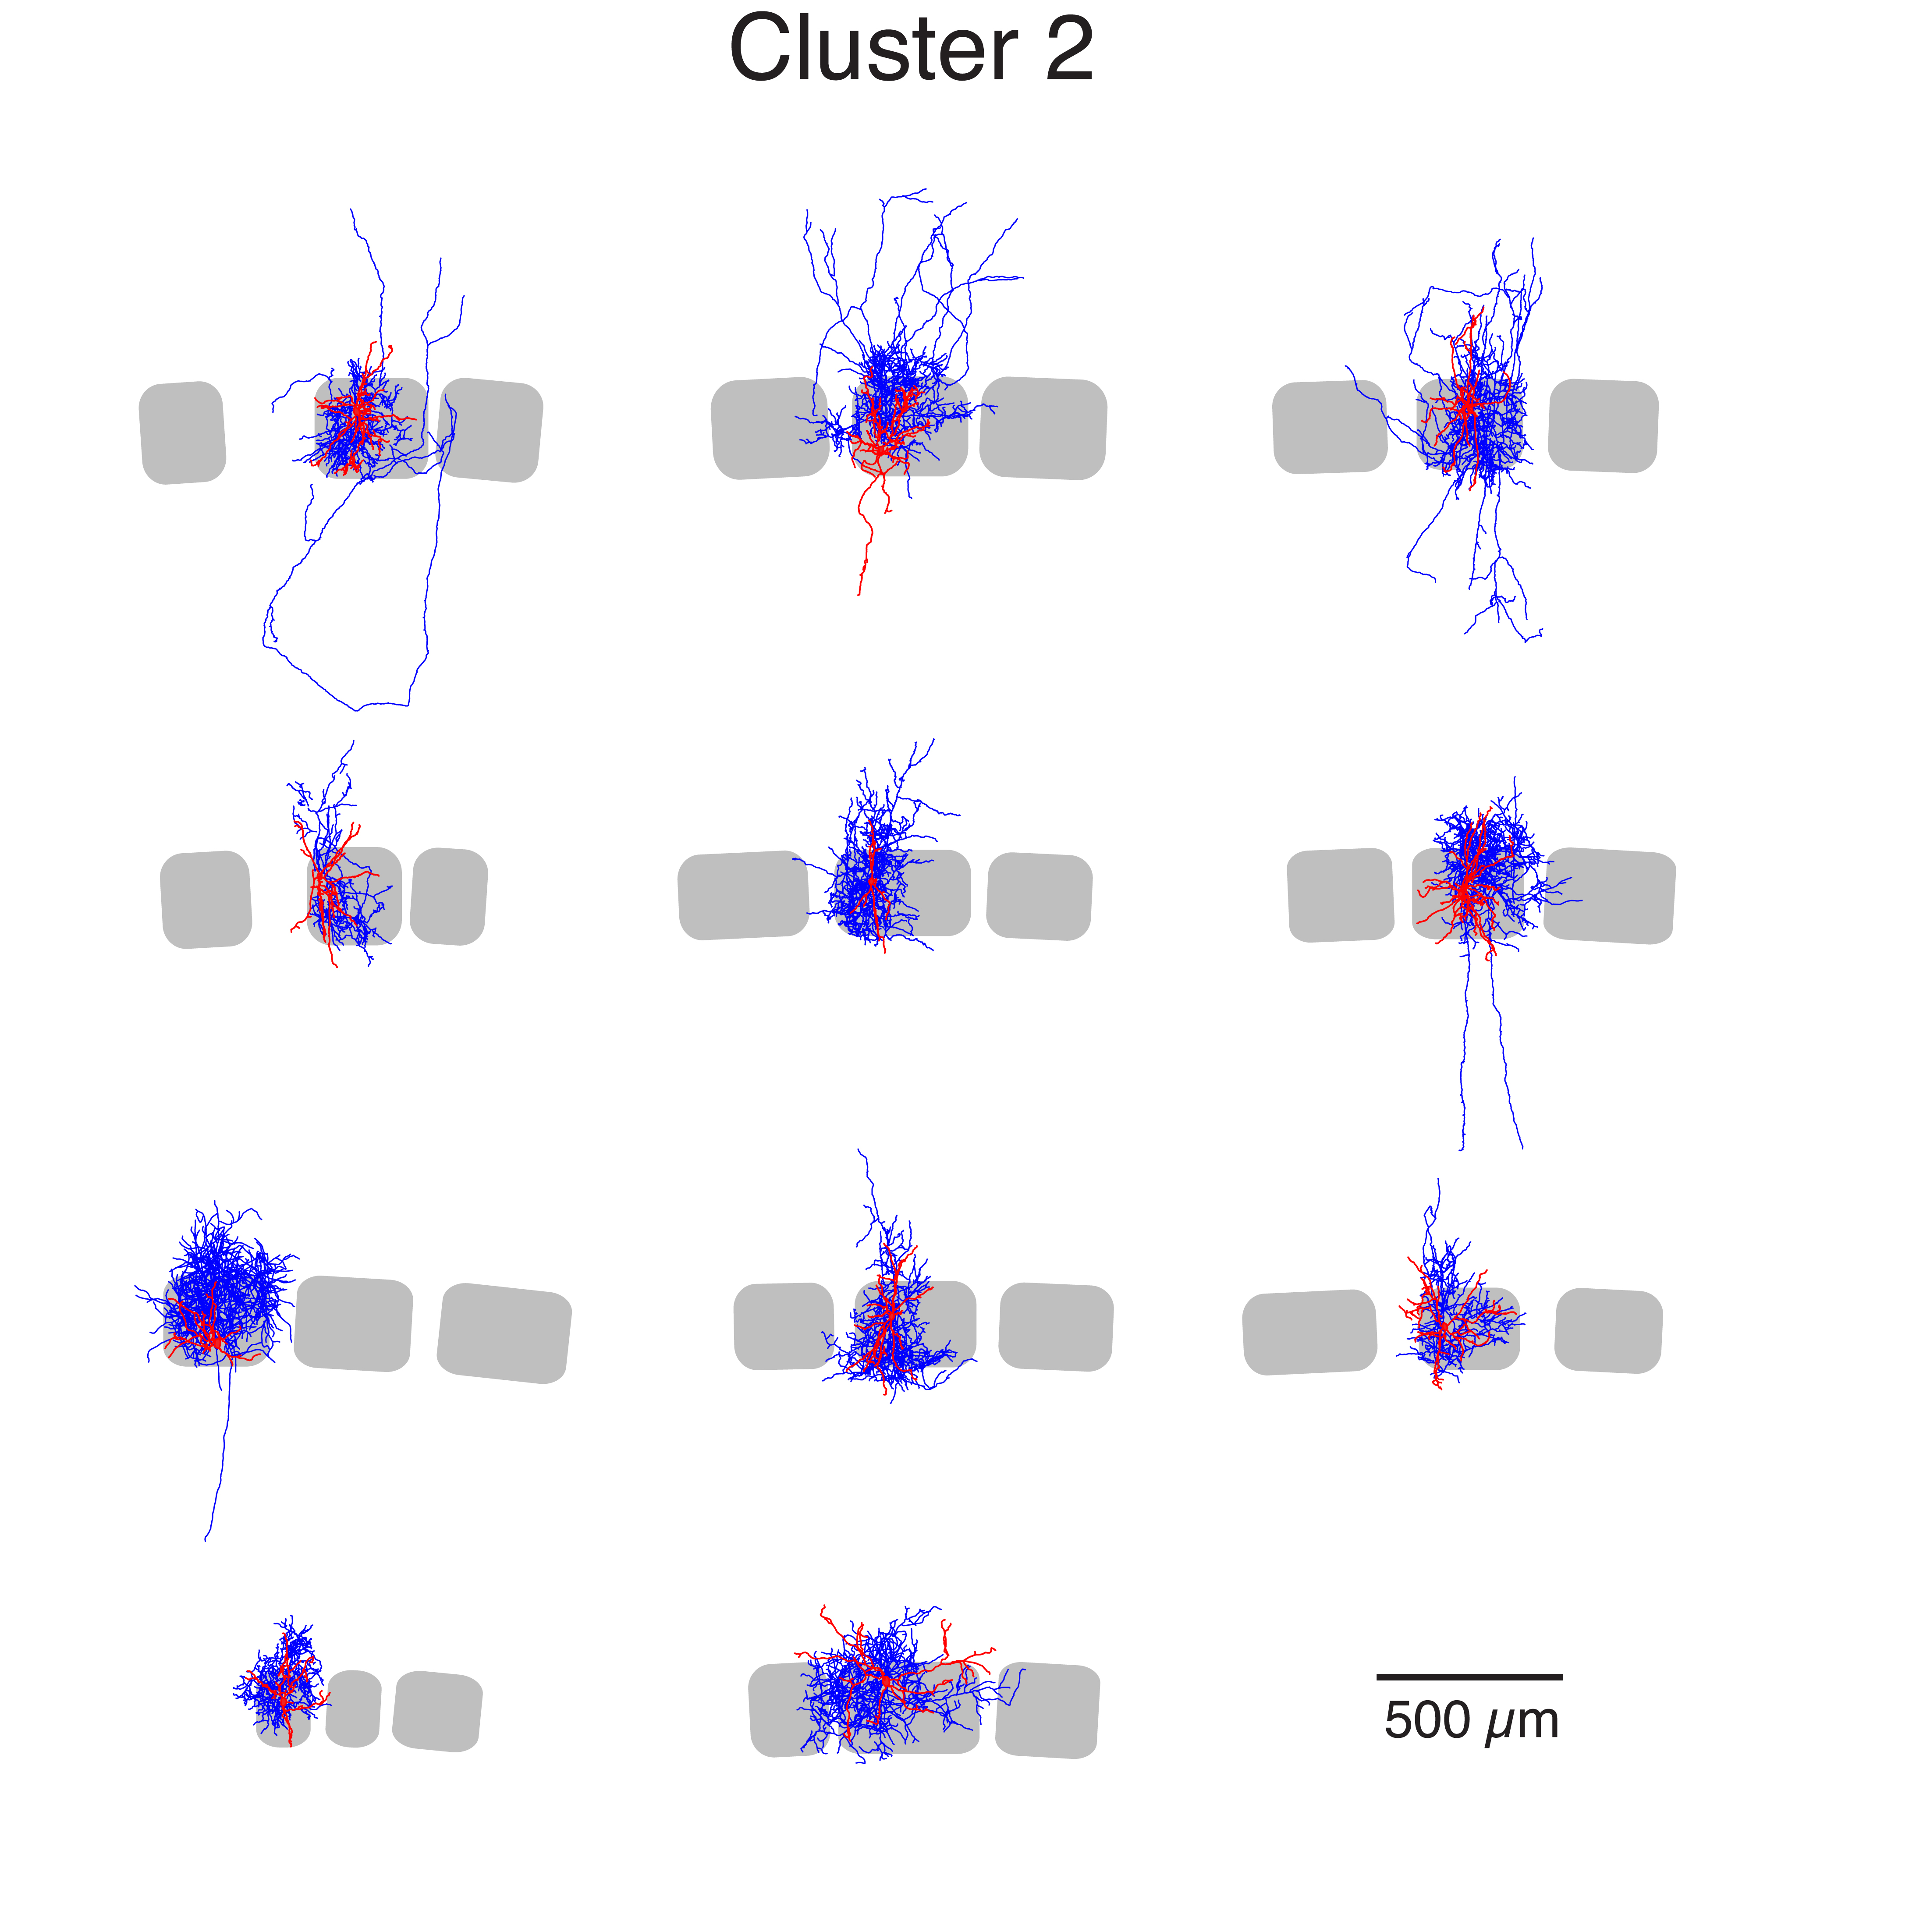
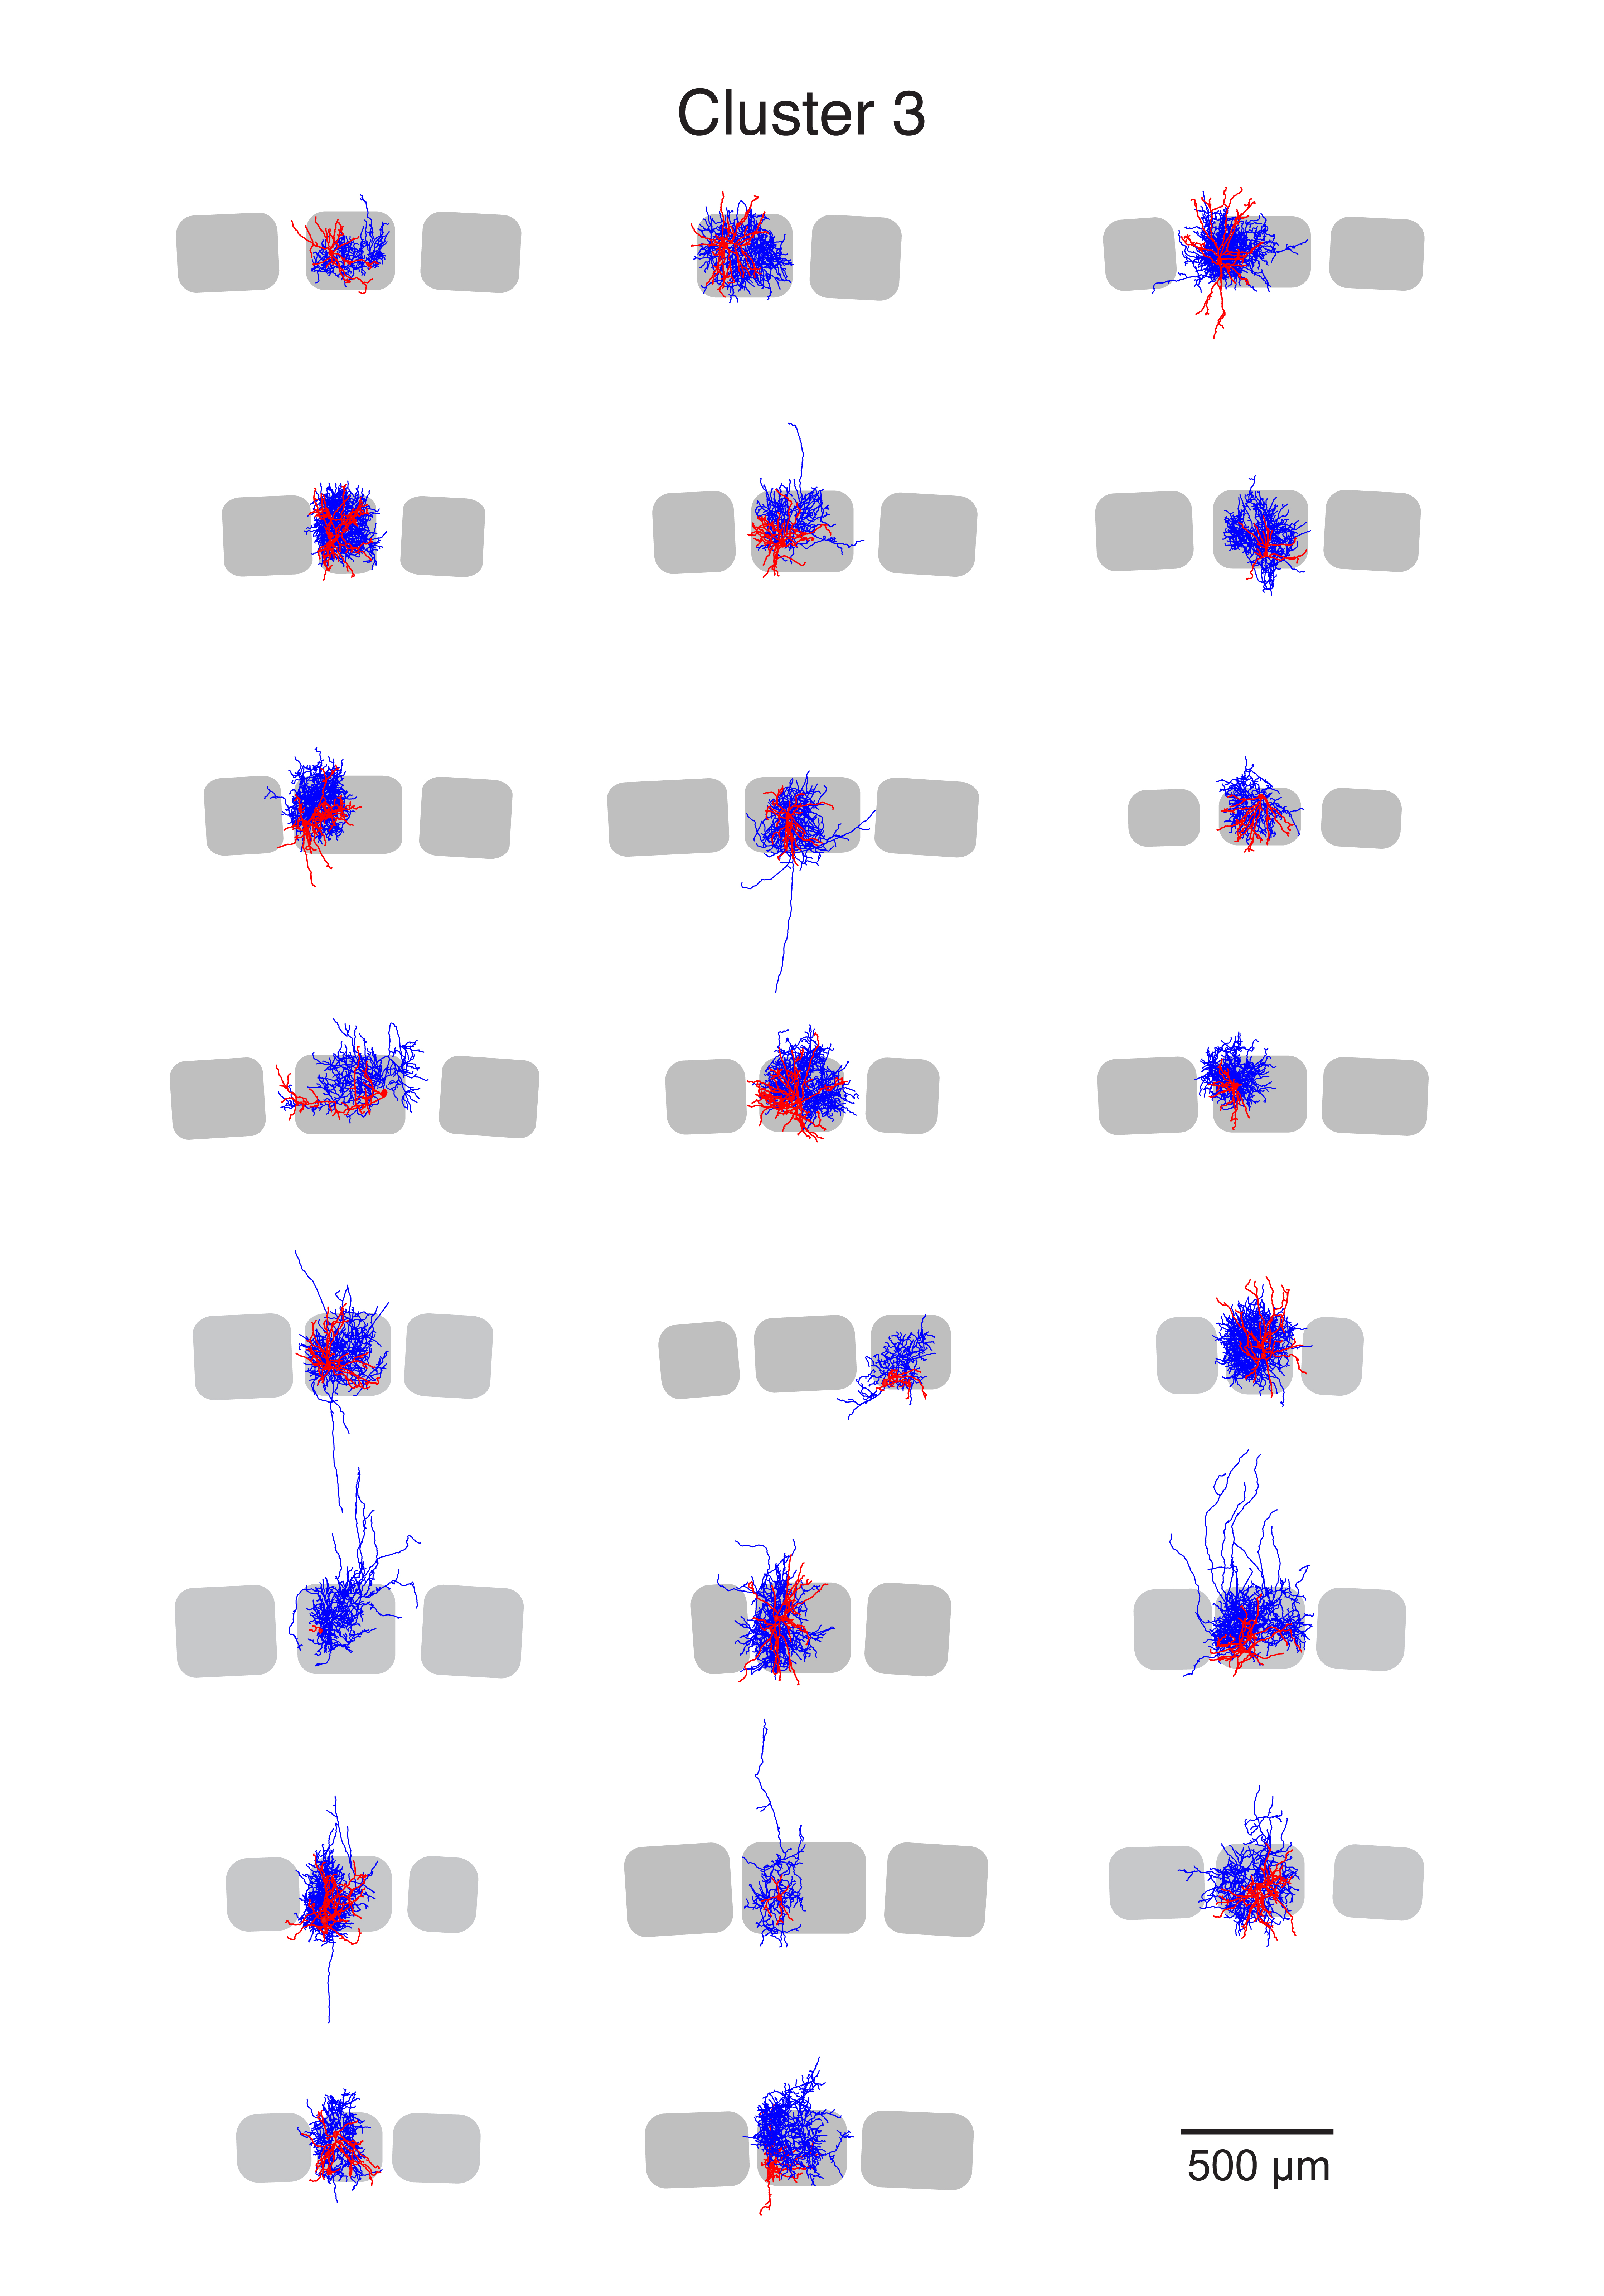