Abstract
The growing number of individuals living beyond age 80 underscores the need for accurate measurement of mortality at advanced ages. Our earlier published study challenged the common view that the exponential growth of mortality with age (Gompertz law) is followed by a period of deceleration, with slower rates of mortality increase (Gavrilov and Gavrilova 2011). This refutation of mortality deceleration was made using records from the U.S. Social Security Administration’s Death Master File (DMF).
Taking into account the significance of this finding for actuarial theory and practice, we tested these earlier observations using additional independent datasets and alternative statistical approaches. In particular, the following data sources for U.S. mortality at advanced ages were analyzed: (1) data from the Human Mortality Database (HMD) on age-specific death rates for 1890–99 U.S. birth cohorts, (2) recent extinct birth cohorts of U.S. men and women based on DMF data, and (3) mortality data for railroad retirees.
In the case of HMD data, the analyses were conducted for 1890–99 birth cohorts in the age range 80–106. Mortality was fitted by the Gompertz and logistic (Kannisto) models using weighted nonlinear regression and Akaike information criterion as the goodness-of-fit measure. All analyses were conducted separately for men and women. It was found that for all studied HMD birth cohorts, the Gompertz model demonstrated better fit of mortality data than the Kannisto model in the studied age interval. Similar results were obtained for U.S. men and women born in 1890–99 and railroad retirees born in 1895–99 using the full DMF file (obtained from the National Technical Information Service, or NTIS). It was also found that mortality estimates obtained from the DMF records are close to estimates obtained using the HMD cohort data.
An alternative approach for studying mortality patterns at advanced ages is based on calculating the age-specific rate of mortality change (life table aging rate, or LAR) after age 80. This approach was applied to age-specific death rates for Canada, France, Sweden and the United States available in HMD. It was found that for all 24 studied single-year birth cohorts, LAR does not change significantly with age in the age interval 80–100, suggesting no mortality deceleration in this interval. Simulation study of LAR demonstrated that the apparent decline of LAR after age 80 found in earlier studies may be related to biased estimates of mortality rates measured in a wide five-year age interval.
Taking into account that there exists several empirical estimates of hazard rate (Nelson-Aalen, actuarial and Sacher), a simulation study was conducted to find out which one is the most accurate and unbiased estimate of hazard rate at advanced ages. Computer simulations demonstrated that some estimates of mortality (Nelson-Aalen and actuarial) as well as kernel smoothing of hazard rates may produce spurious mortality deceleration at extreme ages, while the Sacher estimate turns out to be the most accurate estimate of hazard rate. Possible reasons for finding apparent mortality deceleration in earlier studies are also discussed.
1. Introduction
The growing number of people living beyond age 80 underscores the need for accurate measurement of mortality at advanced ages. Accurate estimates of mortality at advanced ages are essential for improving forecasts of mortality and predicting the population size of the oldest-old age group.
Earlier studies suggest that the exponential growth of mortality with age (Gompertz law) is followed by a period of deceleration, with slower rates of mortality increase (Greenwood and Irwin 1939; Horiuchi and Wilmoth 1998; Thatcher 1999; Thatcher, Kannisto and Vaupel 1998). It is believed mortality at advanced ages has a tendency to deviate from the Gompertz law (Gavrilov and Gavrilova 1991) so the logistic model is suggested for fitting human mortality after age 80 (Horiuchi and Wilmoth 1998; Wilmoth et al. 2007).
At the same time, estimating hazard rates at very old ages is difficult because of the very small fraction of survivors at these ages in most countries. Data for extremely long-lived individuals are scarce and subject to age exaggeration. To minimize statistical noise in estimates of mortality at advanced ages, researches have to pool data for several calendar periods (Depoid 1973; Thatcher 1999). Single-year life tables for many countries have very small numbers of survivors to age 100, which makes estimates of mortality at advanced ages unreliable. On the other hand, aggregation of deaths for several calendar periods creates a heterogeneous mixture of cases from different birth cohorts. Theoretical models suggest that mortality deceleration at advanced ages may be caused by population heterogeneity even if individual risk of death follows the Gompertz law (Beard 1959, 1971; Vaupel, Manton and Stallard 1979).
In addition to the heterogeneity problem, there is the issue of using proper empirical estimates of hazard rate at extreme ages when mortality is high and grows with age very rapidly. This problem is sometimes overlooked by researchers who believe that mortality estimates, which work well at young adult ages (like one-year probability of death) can work equally well at very old ages.
Finally, the problem of age misreporting by older people may still be a problem affecting estimates of mortality at advanced ages (Coale and Kisker 1986; Elo et al. 1996; Hill et al. 1997; Jdanov et al. 2008; Kestenbaum 1992). In most cases, age misreporting at older ages results in mortality underestimation (Preston, Elo and Stewart 1999). Taking into account that the accuracy of age reporting is positively correlated with education, it is reasonable to expect improvement in age reporting over time and less expressed mortality underestimation at older ages. Indeed, it was found that mortality in older U.S. cohorts deviated more from the Gompertz model than did the mortality of younger birth cohorts (Gavrilov and Gavrilova 2011).
In this paper, we analyze mortality trajectories at advanced ages using two independent sources of mortality data and two different approaches of analyzing age patterns at older age. This study is based on data from the U.S. Social Security Administration Death Master File (DMF), which allows compiling data for large single-year birth cohorts. Some already extinct birth cohorts covered by DMF could be studied by the method of extinct generations (Vincent 1951), which is more accurate than traditional methods based on death statistics and population census data. Another data source is the Human Mortality Database (HMD), which became a traditional resource for demographers and actuaries. Methods of mortality trajectory analysis include comparing alternative models of mortality using standard goodness-of-fit measure and study of age patterns for life table aging rate (LAR) at advanced ages (Horiuchi and Coale 1990; Horiuchi and Wilmoth 1998).
2. Testing competing mortality models using two independent data sources
Actuaries, including Gompertz himself, were the first to notice the phenomenon of mortality deceleration. They proposed a logistic formula for fitting mortality growth with age to account for mortality leveling off at advanced ages (Perks 1932; Beard 1959, 1971). British actuary Robert Eric Beard introduced a model of population heterogeneity with gamma-distributed individual risk to explain mortality deceleration at older ages (Beard 1959). This is now considered to be the most common explanation of the mortality deceleration phenomenon (Horiuchi and Wilmoth 1998).
Previous studies of mortality trajectories used data of reasonably good quality for European countries and Japan, which had relatively small population sizes. As a result, few individuals in these countries survived to advanced ages and the researchers often had to pool data for as many as 10 years to provide a sufficient sample size for the study. The United States has the largest population size among the advanced economies. The quality of vital statistics in the United States was not considered acceptable when the first comprehensive studies of mortality trajectories were conducted (Horiuchi and Coale 1990; Horiuchi and Wilmoth 1998; Thatcher et al. 1998). However, the quality of U.S death data improved over time (Manton, Akushevich and Kulminski 2008) and now can be used in mortality analysis. In this study, we compared two models (Gompertz and Kannisto) commonly used in actuarial practice by analyzing U.S. cohort mortality data taken from two independent data sources.
2.1. Data sources
A. Social Security Administration Death Master File
Social Security Administration Death Master File (DMF) is a database of more than 60 million death records for individuals enrolled in the U.S. Social Security program since 1936. Until recently, DMF was a publicly available data resource, which allowed a search for deceased individuals in the United States using various search criteria: birth date, death date, first and last names, Social Security number, place of last residence, etc. This resource covered deaths starting in 1937 (Faig 2001) and captured about 95 percent of deaths recorded by the National Death Index (Sesso, Paffenbarger and Lee 2000). According to other estimates, DMF covered about 90 percent of all deaths for which death certificates are issued (see Faig 2001) and 92–96 percent of deaths for those older than 65 (Hill, Rosenwaike, 2001). Unfortunately, recent developments made this data source publicly unavailable and introduced significant gaps in the number of records available in DMF.
In this study, we used the DMF full file obtained from the National Technical Information Service (NTIS). This is the latest available complete version of DMF and the last deaths occurred in September 2011. The advantage of this data source is that some already extinct birth cohorts covered by DMF could be studied by the method of extinct generations (Kannisto 1988, 1994; Vincent 1951). In our earlier study, we conducted analyses of DMF data for both sexes pooled together. In this study, mortality at advanced ages is studied separately for men and women belonging to 10 recent extinct and almost extinct birth cohorts. The SSA DMF does not have information about sex of the deceased. To cope with this limitation of data sample, we conducted a procedure of sex identification using information about the 1,000 most commonly used baby first names in the 1900s provided by the Social Security Administration.1 These data come from a sample of 5 percent of all Social Security cards issued to individuals born during the 1900s in the United States. The detailed procedure of sex assignment for DMF records was described elsewhere (Gavrilov and Gavrilova 2011). Eventually, we were able to identify sex for 91–93 percent of the individuals in our sample. The remaining 7–9 percent of individuals with unknown sex had approximately the same mean life span as the remaining percent of individuals with identified sex pooled together (checked with the t-test statistics), so the existence of possible sex nonidentification bias in mortality seems unlikely.
We obtained data for those who died before 2011 and were born in 1890–99. Individuals born in these years and alive in 2011 would survive to at least 112 years, which can be considered a very unlikely event. Thus, the 1890–99 birth cohorts in this sample may be considered practically extinct. Assuming that the number of living people belonging to these birth cohorts in 2011 is close to zero, it is possible to construct a cohort life table using the well-known method of extinct generations, which was suggested and explained by Vincent (1951) and developed further by Kannisto (1994).
DMF provides information about years and months of birth and death. However, information on exact day of death is not available for all records, so we were not able to calculate life span in days. Nevertheless we were able to calculate individual life span with one-month accuracy, which is still higher than the accuracy of traditional yearly estimates of life span. In the first stage of our analyses, we calculated an individual life span in completed months.
Using single-year birth cohort data from DMF, we were able to minimize the effects of population heterogeneity on age-related mortality dynamics. We were also able to calculate more accurate monthly estimates of hazard rates, which are less prone to possible biases caused by violation of typical assumptions used in mortality estimation (Kimball 1960). However, we were not able to control for possible age misreporting among the deceased. The most common type of age misreporting among very old individuals is age exaggeration (Willcox et al. 2008). This type of age misreporting results in underestimation of mortality rates at advanced ages (Preston, Elo and Stewart 1999).
One approach to evaluate data quality at advanced ages is to calculate the female-to-male ratio at advanced ages. Taking into account that female mortality is always lower than male mortality (Kannisto 1994), it is reasonable to expect the female-to-male ratio should continuously increase with age. On the other hand, old men have a tendency for age exaggeration and in populations with poor age registration, there is a relative excess of men at very advanced ages (Caselli et al. 2006; Willcox et al. 2008). This approach was applied to DMF data in our earlier study and showed that data quality in DMF is acceptable up to the age 106 (Gavrilov and Gavrilova 2011). These results are supported by an independent study of age verification in DMF records, which found that invalid age claims in this source increase from 65 percent at age 110–111 to 98 percent by age 115. This finding suggests a high proportion of age misreporting after age 110 and probably after age 106 as well (Young et al. 2010).
To use mortality data with better quality, we also selected DMF records for a so-called “non-Southern” group. To create this group, we excluded less reliable records for those individuals who applied for a Social Security number in the Southeast states (Arkansas, Alabama, Georgia, Mississippi, Louisiana, Tennessee, Florida, Kentucky, South Carolina, North Carolina, Virginia and West Virginia), Southwest states (Arizona, New Mexico, Texas and Oklahoma), Puerto Rico and Hawaii. We also excluded all records for people who applied for a Social Security number in New York and California because of the very high proportion of immigrants (with unknown quality of age reporting) residing in these states. We found the non-Southern group demonstrated significantly less mortality understatement (Gavrilov and Gavrilova 2011), which suggests better age reporting in this group (Preston, Elo and Stewart 1999).
B. Human Mortality Database
HMD was created to provide detailed mortality and population data to researchers, students, journalists, policy analysts and others interested in the history of human longevity. This is a publicly available data resource.2
We used age-specific death rates for 1890–99 single-year U.S. birth cohorts. These are raw mortality data not fitted at advanced ages by any parametric formula. Data for 1900 and later birth cohorts were smoothed using the Kannisto formula (from a personal communication to Dmitry JdanovTallinn, September 6, 2012) so they were not used in this analysis. We analyzed only 1890–99 single-year U.S. cohort age-specific death rates separately for men and women. Mortality rates of period life tables in HMD were smoothed after age 80 by fitting a logistic function to observed death rates (Wilmoth et al. 2007).
For study of mortality changes using life table aging rate measure, cohort age-specific death rates were used for the following countries: Canada, France, Sweden and the United States.
2.2. Statistical methods
Study of data quality control at advanced ages suggests that age reporting among the oldest-old in the United States is good until age 106 (Gavrilov and Gavrilova 2011). It means that comparing mortality models beyond this age is not feasible because of the poor quality of mortality data.
For the DMF dataset, we used a subsample of deaths for individuals who applied for Social Security numbers in the non-Southern states (described above) and born in 1890–99 because data for these birth cohorts have reasonably good quality. The Stata software calculates nonparametric estimates of major survival functions including the Nelson-Aalen estimator of hazard rate (force of mortality). In this study, survival times were measured in months, so the estimates of hazard rates initially had a dimension of month−1. For the purpose of comparability with other published studies, which typically use the year−1 time scale, we transformed the monthly hazard rates to the more conventional units of year−1, by multiplying these estimates by a factor of 12 (one month in the denominator of hazard rate formula is equal to 1/12 year). It should be noted that hazard rate, in contrast to probability of death, can be greater than 1, and therefore its logarithm can be greater than 0 (and we indeed observed these values at extreme old ages in some cases). In this paper, we focus our analyses on 1890–99 birth cohorts because we found that data quality for earlier cohorts is not particularly good. We tested competing models of mortality in the age interval 85–106 using the nonlinear regression method.
In the case of HMD data, a weighted nonlinear regression model was applied to age-specific death rates in the age interval 80–106. Age-specific exposure values were used as weights (Muller, Wang and Capra 1997). Mortality data were fitted using the most frequently used models of adult mortality: the Gompertz model (Beard 1971; Gavrilov and Gavrilova 1991; Gompertz 1825) and the Kannisto model (Thatcher, Kannisto and Vaupel 1998).
| (1) |
| (2) |
Goodness of fit for the Gompertz and Kannisto models was evaluated using the Akaike information criterion (AIC) (Akaike 1974):
where lnL is the maximized log-likelihood of the model and k is the number of parameters estimated. Calculations of AIC were performed using Stata command estat ic after parameters of each model were estimated using the nonlinear regression procedure.
AIC is widely used as a measure of the goodness of fit of an estimated statistical model, and the best model demonstrates minimal value of AIC. It is not the absolute size of the AIC value, it is the relative values, and particularly the AIC differences (Δi), that are important in model selection (Burnham and Anderson 2002).
For both datasets, data for men and women were studied separately. Calculations were done using the Stata statistical software, release 11 (StataCorp 2009).
2.3. Results
A. DMF data
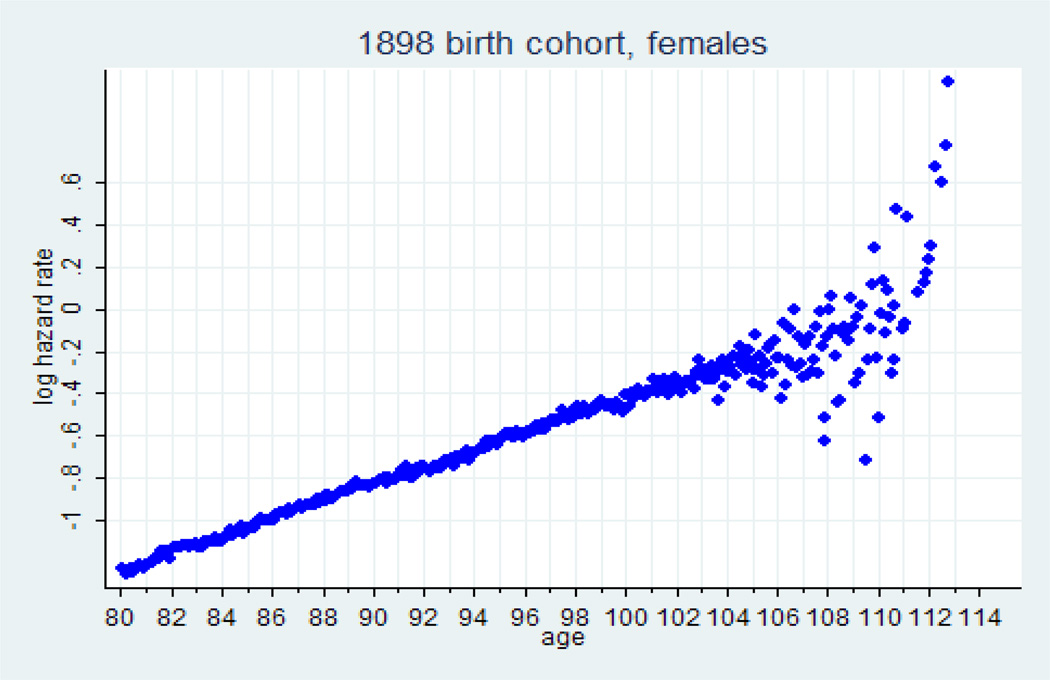
Results of the hazard rate estimation for 1898 U.S. female birth cohort are presented in figure 1. Note that mortality trajectory in semi-log scale is linear up to the age 106, suggesting that mortality follows the Gompertz law. After age 106, data points show very high variation probably because of declining data quality (possible age misreporting).
Figure 1.
Monthly estimates of hazard rate at advanced ages in semi-log scale, U.S. females, 1898 birth cohort
The next step was to compare two competing models of mortality at advanced ages—Gompertz and Kannisto. Study of data quality at advanced ages suggests that age reporting among the oldest-old in the United States is reasonably good until age 106 (Gavrilov and Gavrilova 2011). It means that comparing mortality models beyond this age is not feasible because of poor quality of mortality data. Also, it was found that quality of age reporting is not good for older age cohorts and for individuals who applied for Social Security numbers in the Southern states, resulting in spurious mortality deceleration at advanced ages (Gavrilov and Gavrilova 2011). For this reason, in this paper we used a subsample of deaths for individuals who applied for Social Security numbers in the non-Southern states (described above) and born in 1890–99 because these data have reasonably good quality.
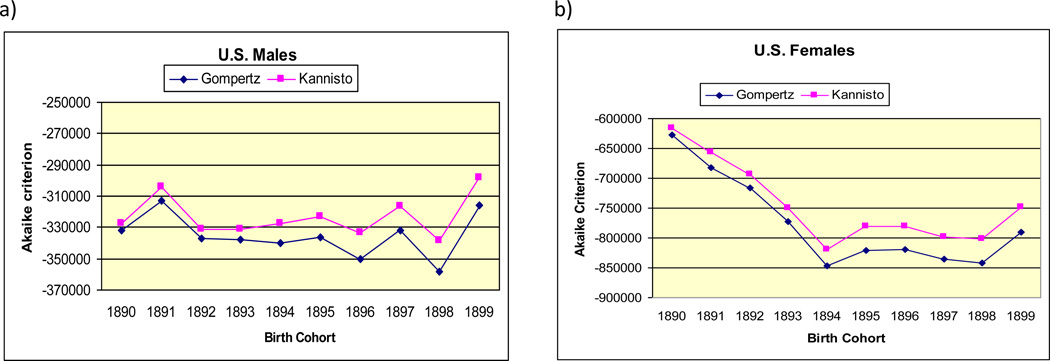
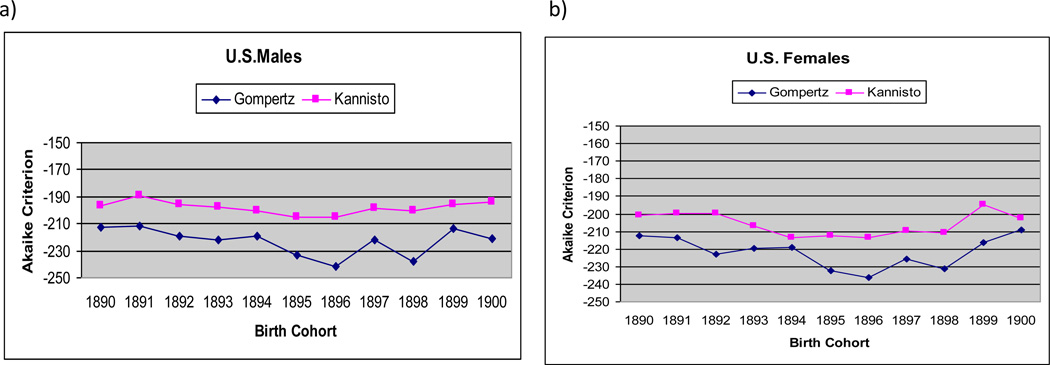
Figures 2a and 2b present values of AIC for Gompertz and Kannisto models for 10 studied birth cohorts of men and women respectively. Note that in all cases (studied birth cohorts), the Gompertz model demonstrates better fit (lower AIC) than the Kannisto model in age interval 85–106.
Figure 2.
Akaike information criterion (AIC) for Kannisto and Gompertz models, by U.S. birth cohort (non-Southern states); a) men, b) women
Obtained values of AIC shown in figures 2a and 2b are negative, and this fact sometimes raises questions from researchers. Negative values of AIC are totally compatible with its definition and appear in some research papers (Lee and Russell 2004). A discussion about negative AIC values can be found on the Internet, including the ResearchGate service.3
At this moment, we cannot make a conclusion that the Gompertz model fits mortality data better than the logistic model after age 106 because of low quality of age reporting beyond this age. At the same time, the available data indicate that the Gompertz model fits mortality data well until age 106. Taking into account that survival beyond age 106 is a rather rare event, it would be reasonable to suggest the use of the Gompertz model of hazard rate rather than the Kannisto model for closing cohort life tables in actuarial practice. In this case, mortality modeling could be done first for hazard rate (mortality force) function and then all life table functions (including probability of death, qx) could be derived on the basis of modeled values of hazard rate.
B. Mortality of railroad workers
Our earlier study demonstrated that deceleration of mortality in later life is more expressed for data with lower quality (Gavrilov and Gavrilova 2011). The DMF database does not contain specific information about occupation but it has information about railroad workers who receive special governmental pensions and who have a specific first 3-digits (700–728) of their Social Security numbers. Our hypothesis was that railroad workers (due to specifics of their occupation) may have better age reporting compared to the rest of the same birth cohort. If this hypothesis is correct, then mortality of railroad workers at advanced ages should not demonstrate mortality deceleration at advanced ages.
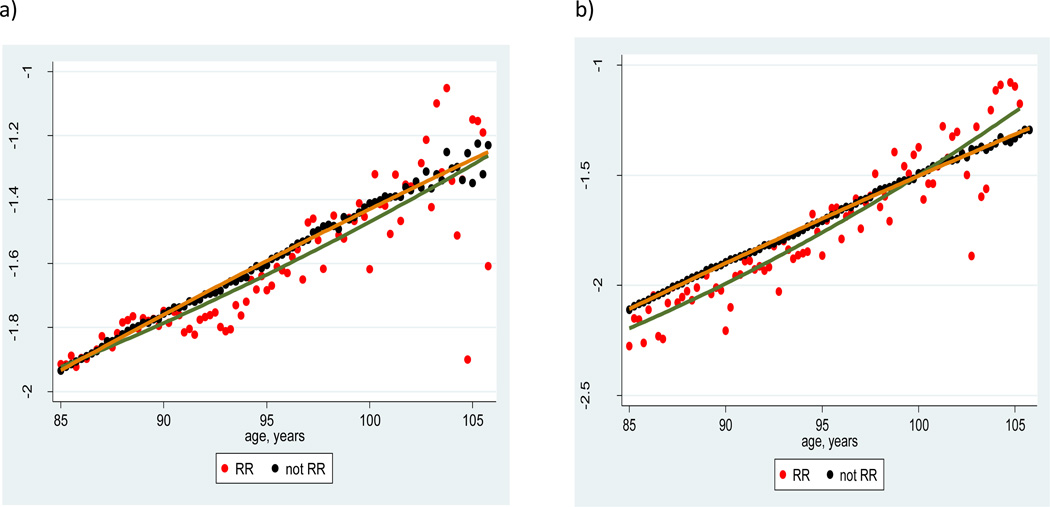
Figures 3a and 3b show mortality for railroad workers and for the rest of the same birth cohort (born in 1895–99) for men and women respectively. Note that mortality of railroad workers in semi-log coordinates is steeper compared to the rest of the corresponding birth cohort.
Figure 3.
Mortality of railroad retirees and their nonrailroad peers, 1895–99 U.S. birth cohort; a) men, b) women
Mortality in semi-log coordinates was fitted with the quadratic regression model for age interval 85–105. The model has a significant and positive (rather than negative) quadratic term for male and female railroad workers, suggesting an acceleration rather than deceleration of mortality. For mortality of the rest of the 1895–99 cohort, the quadratic term was not different from zero for both men and women, suggesting mortality at advanced ages follows the Gompertz law. We may conclude that (as predicted) mortality trajectories of railroad retirees are slightly steeper compared to the rest of the cohort.
C. Human Mortality Database
Taking into account that the complete DMF file is not readily available now, we decided to use a well-known data resource (HMD) so that our results can be easily reproduced by other researchers.
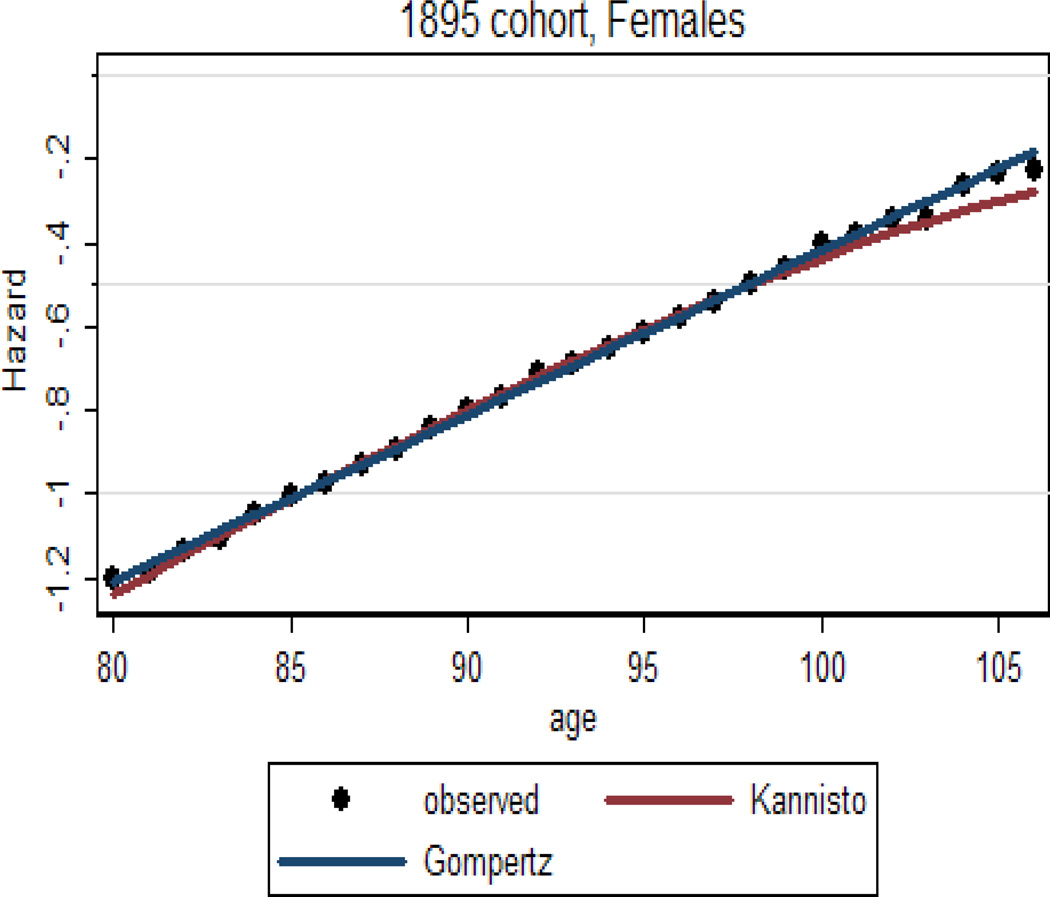
Figure 4 presents age-specific death rates in semi-log scale for the 1895 birth cohort of U.S. women. Note that the mortality trajectory follows the Gompertz law fairly well up to very advanced ages.
Figure 4.
Age-specific hazard rates for U.S. females (1895 birth cohort) fitted by Gompertz and Kannisto models
To quantify this finding, we compared Gompertz and Kannisto models using AIC as a goodness-of-fit measure. The analysis included 10 single-year U.S. birth cohorts (1890–99) and was conducted separately for men and women. The results of this study for men and women are presented in figures 5a and 5b respectively. Note that for all 10 cases, the Gompertz model demonstrates better fit than the Kannisto model for both men and women in age interval 80–106. Also, it was found that AIC differences (Δi) between the best (Gompertz) model and the Kannisto model are higher than 10 for the studied 1890–99 U.S. birth cohorts (Gavrilova and Gavrilov 2014). Manuals on model selection suggest that competing models with Δi > 10, when compared to the best model with minimal AIC, have little support from empirical data (Burnham and Anderson 2002). Thus, we may conclude that the Gompertz model is significantly better supported by data on U.S. mortality compared to the competing mortality deceleration Kannisto model.
Figure 5.
Akaike information criterion (AIC) for comparison with Kannisto and Gompertz models, by birth cohort (U.S. data from HMD); a) men, b) women
Due to some limitations of the DMF data (incompleteness of death registration before the 1970s), we were unable to estimate mortality before the age 85–88. There is also a question of whether our estimates of Gompertz parameters based on DMF data (slope parameter in particular) are applicable to a wider age interval or they are specific only for advanced ages (the two-stage Gompertz model). Age-specific death rates from the Human Mortality Database are available for much younger ages so there is an opportunity to compare results obtained from these two independent data sources.
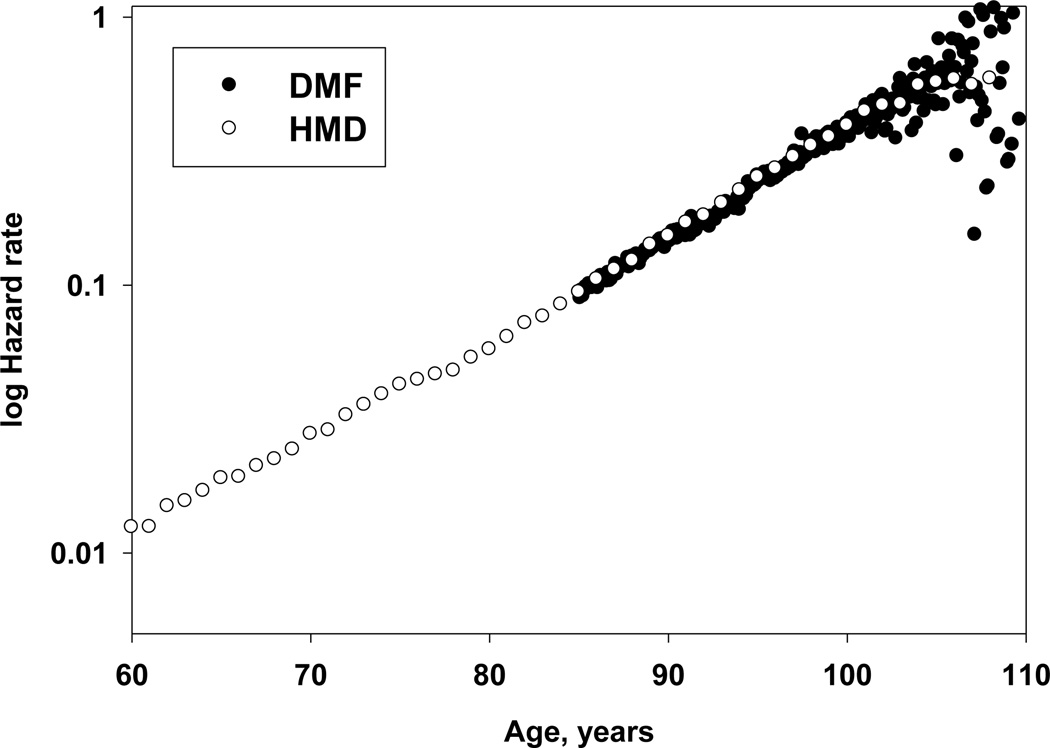
Figure 6 shows the trajectories of age-specific hazard rates for the 1898 birth cohort of females based on data from HMD and DMF over a broad interval starting at age 60. Note that hazard rate estimates for the DMF birth cohort are practically identical to the age-specific death rates obtained from HMD. Also note that mortality of the DMF birth cohort has the same slope in semi-log coordinates as mortality of the HMD birth cohort calculated for a much wider age interval, which does not support the suggestion about the two-stage Gompertz model of mortality at advanced ages.
Figure 6.
Comparison of DMF and HMD mortality data for the 1898 birth cohort of U.S. women
Indeed, the maximum likelihood estimator of the Gompertz slope parameter for mortality in the 1898 cohort measured in the interval 88–106 years (0.0786 year−1, 95 percent confidence interval [CI]: 0.0786–0.0787) does not differ from the slope parameter calculated over the age interval 40–105 for HMD data: 0.0785 year−1, 95 percent CI: 0.0772–0.0797. Thus, we may conclude that the estimates of hazard rates at advanced ages based on individual mortality data practically coincide with hazard rate estimates calculated on the basis of age-specific death rates available in HMD. This finding was discussed at the 2012 international conference on mortality in Tallinn, Estonia, with Jdanov, a representative from the Human Mortality Database team, who acknowledged that HMD uses the Kannisto model to fit period mortality after age 80. In the case of cohort data, mortality of U.S. birth cohorts born before 1900 is not subjected to fitting. However, mortality of cohorts born after 1900 is fitted using the Kannisto formula.
3. Analyzing mortality trajectories using life table aging rate
Coale and Kisker (1990) proposed a method to calculate mortality schedules at advanced ages. This method is based on calculating a measure of mortality change that the authors called the age-specific rate of mortality change with age, or kx. This measure is defined in the following way:
where mx is mortality rate at age x.
If kx is a constant function of age, then mortality follows the Gompertz law. If kx declines with age, then there is a mortality deceleration. A similar measure was proposed by Horiuchi and Coale (1990); later this measure was called a life table aging rate (Horiuchi and Wilmoth 1997).
This approach, based on calculating mortality change, was applied in several earlier studies of mortality trajectories at advanced ages (Horiuchi and Coale 1990; Horiuchi and Wilmoth 1998; Thatcher, Kannisto and Vaupel 1998; Wilmoth 1995). These earlier studies demonstrated that values of kx tend to decline after age 80, suggesting mortality deceleration at advanced ages. Most of these studies used cross-sectional data. As we noted earlier, mortality deceleration may be caused by age misreporting at older ages and previous studies of mortality trajectories were conducted almost 20 years ago. Thus, it is reasonable to repeat these earlier analyses using data on more recent extinct or almost extinct birth cohorts. In this paper, we analyze mortality data for the following four countries: Canada, France, Sweden and the United States. Analyses are based on age-specific cohort death rates for the most recent extinct birth cohorts available in the Human Mortality Database (1894, 1896 and 1898). A linear regression model was applied to verify if kx is declining with age after age 80.
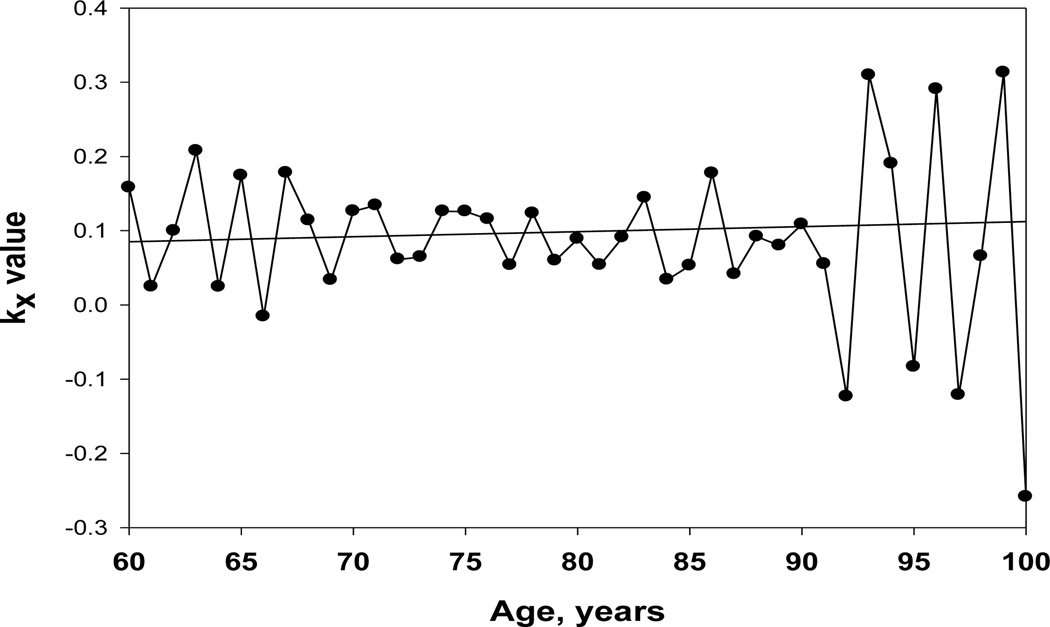
Figure 7 presents the age pattern of kx for the Swedish female 1895–99 cohort. Note that values of kx do not show any decline with age up to very advanced ages and, after age 100, random variation of kx is very high. Overall, the kx age pattern is in a good agreement with the Gompertz law and does not demonstrate any significant decline with age.
Figure 7.
Age-specific rate of mortality change with age, kx, Swedish males, 1896 birth cohort
To quantify this finding, we conducted linear regression analyses for kx as a dependent variable and age as a predictor variable in the age interval 80–100. If kx does not change with age, then the slope coefficient for this regression model should not be significantly different from zero. Table 1 presents regression slope coefficients and corresponding p-values for all 24 studied single-year birth cohorts.
Table 1.
Slope parameter estimates and corresponding p-values for the linear regression model of kx as a function of age,* by country, sex and birth cohort
| Country | Sex | Birth cohort | |||||
|---|---|---|---|---|---|---|---|
| 1894 | 1896 | 1898 | |||||
| slope | p-value | slope | p-value | slope | p-value | ||
| Canada | F | −0.00023 | 0.914 | 0.00004 | 0.984 | 0.00066 | 0.583 |
| M | 0.00112 | 0.778 | 0.00235 | 0.499 | 0.00109 | 0.678 | |
| France | F | −0.00070 | 0.681 | −0.00179 | 0.169 | −0.00165 | 0.181 |
| M | 0.00035 | 0.907 | −0.00048 | 0.808 | 0.00207 | 0.369 | |
| Sweden | F | 0.00060 | 0.879 | −0.00357 | 0.240 | −0.00044 | 0.857 |
| M | 0.00191 | 0.742 | −0.00253 | 0.635 | 0.00165 | 0.792 | |
| USA | F | 0.00016 | 0.884 | 0.00009 | 0.918 | 0.000006 | 0.994 |
| M | 0.00006 | 0.965 | 0.00007 | 0.946 | 0.00048 | 0.610 | |
All regressions were run in the age interval 80–100.
As follows from table 1, the slope coefficients for all studied birth cohorts are not significantly different from zero. Thus, the shape of mortality curve after age 80, as measured by the kx function, appears to be consistent with the Gompertz model.
These results do not agree with earlier studies that showed linear decline of kx after age 80 (Horiuchi and Wilmoth 1998; Thatcher, Kannisto and Vaupel 1998; Wilmoth 1995). There may be several reasons these studies found mortality deceleration in advanced ages. In most cases, these studies analyzed cross-sectional data combined into five-year or 10-year time intervals, which may be prone to mortality deceleration due to secular decline of mortality. Some studies analyzed cohort data aggregated into five-year or 10-year birth cohorts. Such aggregation may result in mortality deceleration if mortality in aggregated single-year birth cohorts is significantly different from each other. To test this hypothesis, we calculated kx values using age-specific death rates for five-year birth cohorts available in HMD. Table 2 shows slope parameters and corresponding p-values for linear regression model of kx as a function of age in the age interval 80–100. Note that in the case of aggregated birth cohorts, there are some cohorts where kx is declining with age.
Table 2.
Slope parameter estimates and corresponding p-values for linear regression model, by country, sex and five-year birth cohort
| Country | Sex | Birth cohort | |||||||
|---|---|---|---|---|---|---|---|---|---|
| 1880–84 | 1885–89 | 1890–94 | 1895–99 | ||||||
| slope | p-value | slope | p-value | slope | p-value | slope | p-value | ||
| Canada | F | −0.00150 | 0.145 | −0.00069 | 0.372 | 0.00015 | 0.851 | −0.00002 | 0.983 |
| M | −0.00247 | 0.135 | −0.00065 | 0.642 | 0.00094 | 0.306 | 0.00022 | 0.850 | |
| France | F | −0.00167 | 0.074 | −0.00273 | 0.047 | −0.00191 | 0.005 | −0.00165 | 0.002 |
| M | −0.00072 | 0.818 | −0.00082 | 0.515 | −0.00049 | 0.661 | −0.00047 | 0.412 | |
| Sweden | F | −0.00043 | 0.759 | −0.00036 | 0.749 | −0.00122 | 0.185 | −0.00210 | 0.122 |
| M | 0.00141 | 0.663 | −0.00234 | 0.309 | −0.00127 | 0.330 | −0.00089 | 0.696 | |
| USA | F | −0.00131 | 0.113 | −0.00030 | 0.654 | −0.00027 | 0.685 | 0.00004 | 0.915 |
| M | −0.00187 | 0.008 | −0.00050 | 0.417 | −0.00039 | 0.399 | 0.00002 | 0.972 | |
Still, only four out of 32 cohorts show negative slope coefficients, suggesting decline in kx with age and mortality deceleration. This example demonstrates that even in countries with smaller populations compared to the United States, mortality deceleration at advanced ages is rather an exception than a rule. Thus, we may conclude that the analysis of age-specific rates of mortality change for four countries suggests that in most cases, mortality deceleration at advanced ages is not supported by existing data. These results are mixed because for some populations (French women) mortality deceleration does exist for all studied birth cohorts while in other countries (Canada), we do not observe mortality deceleration at all.
A more important factor resulting in the spurious decline of kx is related to the use of inappropriate measures of hazard rate at advanced ages. In the previous studies of old-age mortality, the values of kx were calculated not for one-year but for five-year age intervals:
where mx represents a five-year mortality rate.
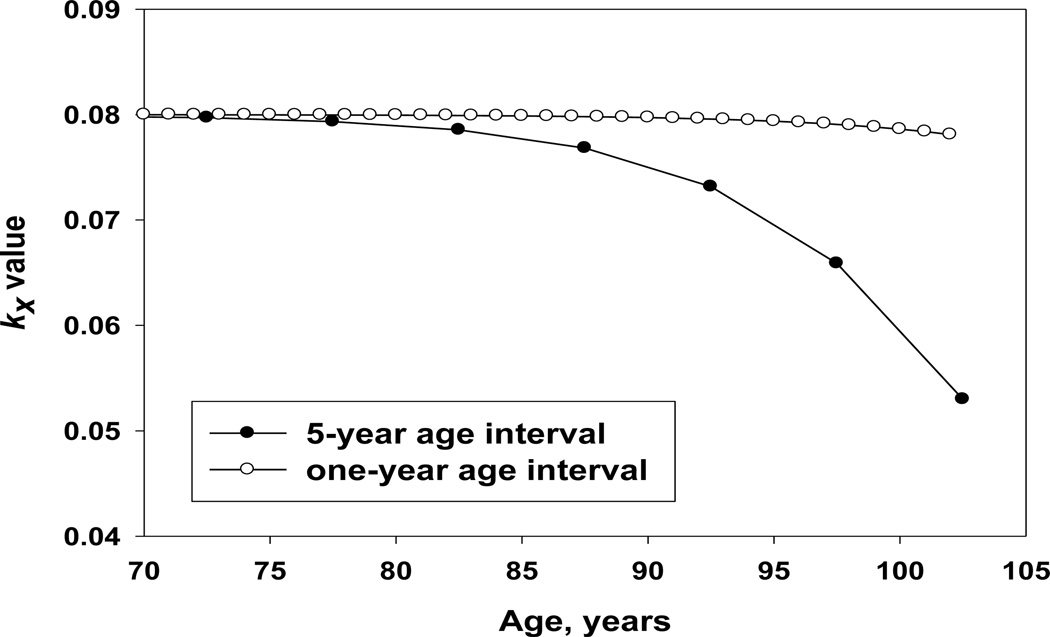
It should be noted that a five-year age interval is too wide for analyzing mortality (and hazard rate) at advanced ages when mortality is particularly high. In this case, the assumption about uniform distribution of deaths over the age interval (used for this estimate of hazard rate) does not work. As a result, hazard rate estimates become biased downward, resulting in a decline of five-year kx values with age. As an example of these effects, we present in figure 8 the result of numerical simulation using survival data, which follow the Gompertz model with typical parameters (see the appendix for more detail). In this example, we calculate mortality rates for five-year age intervals and then calculate age-specific mortality change function (kx) using the formula provided in Wilmoth (1995). Theoretically, we should obtain a constant value of kx because our simulated data follow the Gompertz law. Instead, we get a declining pattern of kx with age (see figure 8), which is similar to trajectories reported in previous publications (Horiuchi and Wilmoth 1998; Wilmoth 1995).
Figure 8.
Age-specific rate of mortality change with age, kx, by age interval for mortality calculation; simulated data assuming that hazard rate follows the Gompertz law
Thus, there is a possibility that the declining pattern of kx with age found in earlier studies may be partially related to spurious mortality deceleration caused by using too-wide age intervals for hazard rate estimates. It should be noted that in the first publication on this topic, the authors used one-year smoothed estimates of mortality rates and found a similar declining age pattern for kx (Horiuchi and Coale 1990). There are two possible explanations for this phenomenon. One possibility is that the quality of age reporting at advanced ages for the studied populations was not sufficiently high for these time periods (1960s and 1970s). Another possibility is that the authors used cross-sectional data, which are more prone to show mortality deceleration.
We may conclude that the analysis of age patterns of LAR for more recent single-year birth cohorts shows no evidence of mortality deceleration in the age interval 80–100.
4. Discussion
This study of 10 single-year U.S. birth cohorts, based on two independent data sources, found that mortality deceleration at advanced ages is negligible up to the age of 106. Below the age of 107 and for data of reasonably good quality, the Gompertz model fits mortality better than the logistic model (no mortality deceleration). Hazard rate estimates after age 85 obtained from DMF data agree remarkably well with age-specific death rates obtained from the Human Mortality Database. Study of age-specific rate of mortality change used as a measure of mortality deceleration found no mortality deceleration in the age interval 80–100 for single-year birth cohorts of Canada, France, Sweden and the United States. Thus, data suggest that mortality after age 80 follows the Gompertz model not only for the United States but also for countries with smaller populations (like Sweden).
It should be noted that some researchers already found no mortality deceleration at advanced ages but did not conduct a systematic study of the phenomenon. For example, Stauffer (2002) presents mortality of German cohorts, which shows no mortality deceleration up to age 90. Other researchers who found no mortality deceleration at older ages for Canadian cohorts believe this result is associated with problems of quality in their data (Bourbeau and Desjardins 2006). On the other hand, several systematic studies of mortality at older ages conducted in the 1990s came to a conclusion that mortality does decelerate after age 80 (Horiuchi and Wilmoth 1998; Thatcher 1999; Thatcher, Kannisto and Vaupel 1998; Wilmoth 1995).
There are several reasons why earlier studies (Horiuchi and Wilmoth 1998; Kannisto 1994; Robine and Vaupel 2001; Thatcher 1999; Thatcher, Kannisto and Vaupel 1998), including our own research (Gavrilov 1984; Gavrilov and Gavrilova 1991), reported mortality deceleration and mortality leveling-off at advanced ages. First, mortality deceleration may be caused by age misreporting in death data for older individuals (Coale and Kisker 1986; Gavrilov and Gavrilova 2011). Studies conducted more than 10 years ago used data for older birth cohorts when age reporting was not particularly accurate (Jdanov et al. 2008), even for such developed countries as the United Kingdom (Gallop and Macdonald 2005).
Second, mortality deceleration may be a consequence of data aggregation. Most developed countries have much smaller populations compared to the United States and hence studies of mortality at advanced ages for these countries have to combine many single-year birth cohorts, thereby increasing the heterogeneity of the sample.
Finally, some researchers use inappropriate estimates of hazard rates in their studies of mortality at very high ages when hazard rate is high and changes rapidly. Many studies analyze age-specific probability of death rather than hazard rate (Gallop and Macdonald 2005; Gampe 2010; Modig, Drefahl and Ahlbom 2013; Robine and Vaupel 2001). It is not surprising that probability of death has a tendency of deceleration at advanced ages when mortality is high, taking into account that this mortality indicator has a theoretical upper limit equal to one (see appendix). For example, a study of mortality among supercentenarians demonstrated that probability of death for this group does not increase with age (Robine and Vaupel 2001). Some authors do not distinguish between probability of death and hazard rate in their calculations (Le Bras 2005).
Mortality rates calculated for wide age intervals also produce biased estimates of hazard rates. For example, use of five-year mortality rates may produce spurious evidence of mortality deceleration when age-specific rate of mortality change is analyzed (see previous section). Loss of individuals to follow-up in longitudinal studies may also be a factor contributing to apparent mortality deceleration at advanced ages (Manton, Akushevich and Kulminski 2008). The appendix compares accuracy of various estimates of hazard rate at advanced ages and provides a degree of deviation from the correct theoretical values of hazard rate. It appears that age exaggeration, use of inappropriate estimates of hazard rates and perhaps data heterogeneity could lead to downward biases in mortality estimates at older ages reported in previous studies.
The results obtained in this study may be important for actuarial practice, particularly if mortality is analyzed for birth cohorts. These results also may be significant for projections of the size of older populations. Recent mass media reports (Bialik 2012; Cohen 2012) revealed that official projections significantly overstated the number of centenarians both in the United States and the United Kingdom. Inappropriate assumptions about mortality at advanced ages may be partially responsible for these projection inaccuracies.
5. Conclusion
Few people survive to advanced ages and, in standard mortality tables, it is frequently necessary to compile data over an entire decade to obtain a sufficiently large sample. Our work shows that the observed deceleration in measured mortality rates could result, in part, from the heterogeneity of the data. The second problem we examined is frequently overlooked by demographers and actuaries: the problem of correct estimation of the instantaneous mortality rate (hazard rate). At the most advanced ages, the rates of death are so high it is impossible to assume the number of dying is distributed uniformly within the studied one-year age intervals. As a result, the estimates of mortality rates (or central death rates) are biased downward at advanced ages. And finally, the third problem is related to the fact that elderly people tend to round their ages up, thereby exaggerating their true age. In the United States, this may have impaired the accuracy of mortality rate estimates in the past.
Acknowledgements
Supported by the grant from the National Institutes of Health (NIA grant R01 AG028620).
Appendix
Hazard rate (mortality force) estimation at advanced ages: a simulation study
A conventional way to obtain estimates of mortality at advanced ages is construction of a demographic life table with probability of death (qx) as an important life table functions. Although probability of death is a useful indicator for mortality studies, it may not be the most convenient one for studies of mortality at advanced ages. First, the values of qx depend on the length of the age interval Δx for which it is calculated. This hampers both analyses and interpretation. Also, by definition qx is bounded by unity, which would inevitably produce apparent mortality deceleration when death rates are particularly high.
A more useful indicator of mortality at advanced age is instantaneous mortality rate (mortality force) or hazard rate, µx, which is defined as follows:
where Nx is the number of living individuals exposed to risk of death at age x. It follows from the definition of hazard rate that it is equal to the rate of decrease of logarithmic survival function with age. In actuarial practice, hazard rate is often called mortality force as it was done in the original paper by Gompertz (1825). Hazard rate does not depend on the length of the age interval (it is measured at the instant of time x), has no upper boundary and has a dimension of rate (time−1). It should also be noted that the famous law of mortality, the Gompertz law, was first proposed for fitting the age-specific hazard rate function rather than probability of death (Gompertz 1825).
The empirical estimates of hazard rates are often based on the suggestion that age-specific mortality rate or death rate (number of deaths divided by exposure) is a good estimate of theoretical hazard rate. One of the first empirical estimates of hazard rate was proposed by Sacher (1956, 1966):
This estimate is unbiased for slow changes in hazard rate if ΔxΔµx << 1 (Sacher 1966) and was shown to be the maximum likelihood estimate (Gehan and Siddiqui 1973). A simplified version of the Sacher estimate (for small age intervals equal to unity) is often used in demographic studies of mortality: µx = −ln(1 − qx). This estimate was initially suggested by Gehan, who called it a Sacher estimate (Gehan 1969; Gehan and Siddiqui 1973). It is based on the assumption that hazard rate is constant over the age interval and is shifted by one half of a year to younger ages compared to the original Sacher estimate.
Another empirical estimate of hazard rate, often used in life table construction (Klein and Moesberger 1997), is the actuarial estimate, which is calculated in the following way (Kimball 1960):
This estimate assumes uniform distribution of deaths over the age interval and is bounded by 2/Δx so this is not the best estimate of hazard rate at extreme old ages when death rates are particularly high (Gavrilov and Gavrilova 1991).
At advanced ages, when death rates are very high, the assumptions about small changes in hazard rate or a constant hazard rate within the age interval become questionable. The same is true for the assumption of uniform distribution of deaths within the age interval.
We conducted a simulation study to compare and evaluate the accuracy of different empirical estimates of hazard rate. For this purpose, values of survivors at each age were calculated assuming that age-specific hazard rate follows the Gompertz law. The theoretical equation was drawn by integrating the Gompertz formula (Gavrilov, Gavrilova and Nosov 1983):
where Nx/N0 is the probability of survival to age x, i.e., the number of hypothetical cohort at age x divided by its initial number N0. The parameters of Gompertz equation (see formula 1) are a and b. The simulation assumed that the Gompertz law works for the entire age interval and the initial cohort size is equal to 1011 individuals. The Gompertz parameters are typical for the U.S. birth cohorts: slope coefficient (b) = 0.08 year−1; a = 0.0001 year−1. The main focus of this study was on ages beyond 90. Accuracy of various hazard rate estimates (Sacher, Gehan and actuarial) and probability of death is compared at ages 100 and 110.
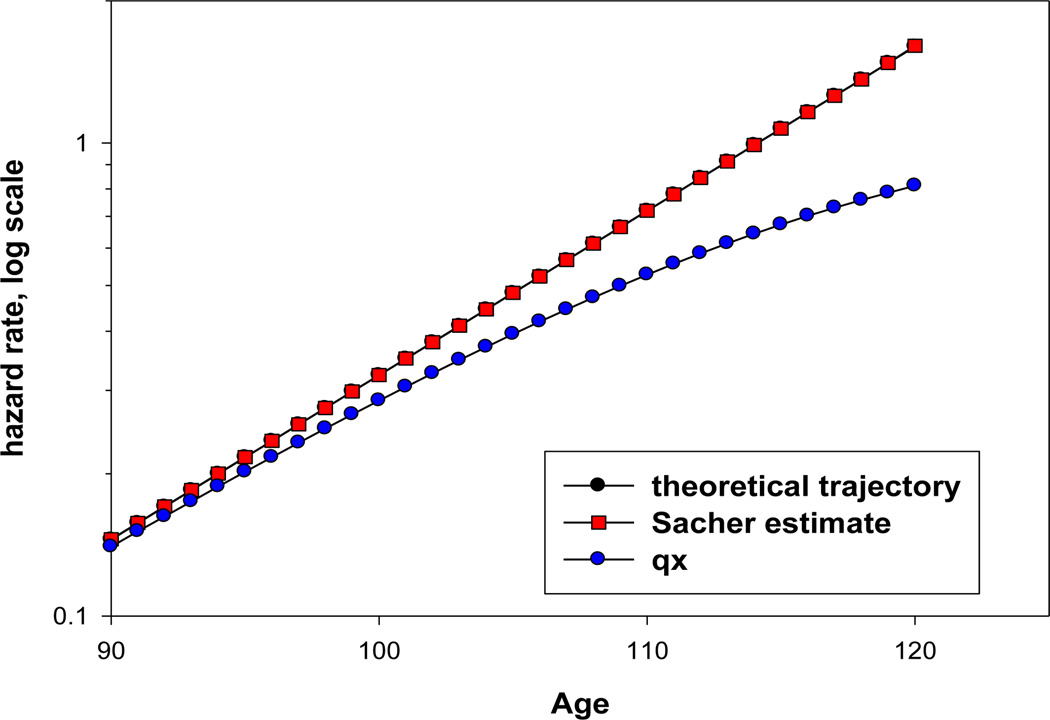
Figure 9 shows theoretical and empirically estimated values of hazard rate after age 90 using the Sacher estimate of hazard rate and one-year probability of death. Note that the Sacher estimates practically coincide with theoretical mortality trajectory. At the same time, probability of death strongly underestimates mortality after age 100.
Figure 9.
Comparison of Sacher estimate of hazard rate with one-year probability of death using simulated data based on the Gompertz mortality model
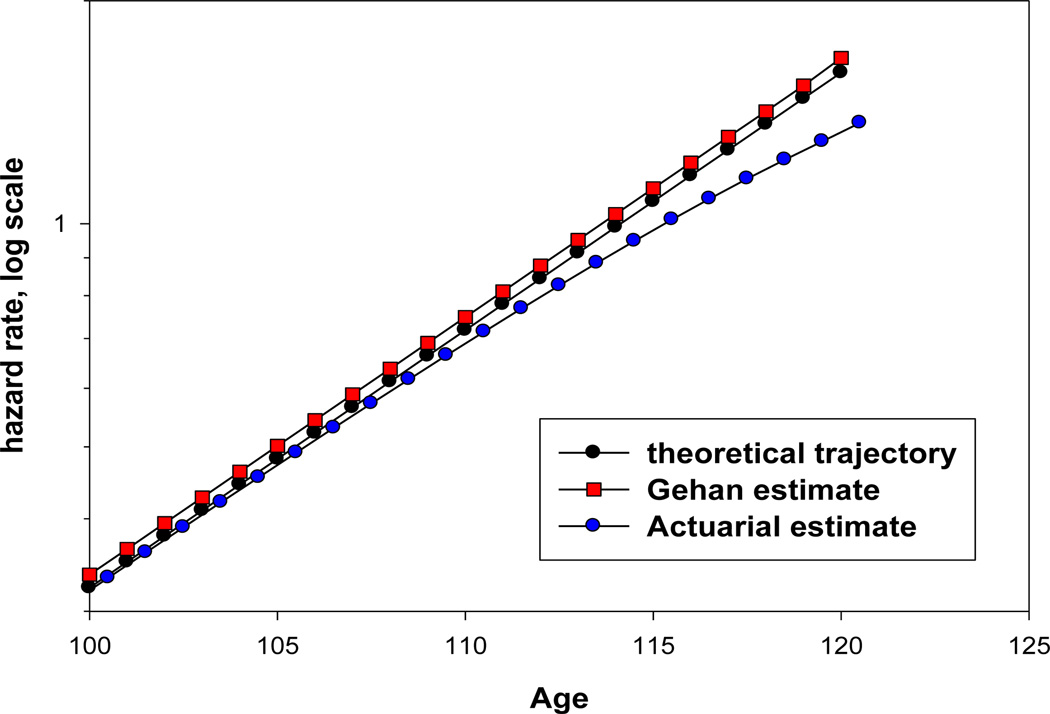
Figure 10 compares theoretical values of hazard rate with empirical estimates of hazard rate using actuarial estimate of hazard rate (equivalent to the age-specific death rate or mortality rate, mx). The actuarial estimates underestimate mortality at a later age (110) compared to one-year probability of death.
Figure 10.
Comparison of actuarial estimate of hazard rate with Gehan estimate of hazard rate using simulated data based on the Gompertz mortality model
Table 3 summarizes the results of our simulation study. It demonstrates that the Sacher estimate of hazard rate is the best one for use at advanced ages. These results underscore that the choice of proper hazard rate estimate is of paramount importance when mortality trajectory at advanced ages is analyzed. Sacher estimate turned out to be the most accurate estimate for advanced ages while one-year probability of death deviates from hazard rate function after age 85. Unfortunately, standard statistical packages do not use the Sacher estimate in their calculations of hazard rate.
Table 3.
Comparison of different estimates of hazard rate with theoretical simulated values of hazard rate based on the Gompertz model
| Estimate of hazard rate | Hazard rate estimate at age 100 | Hazard rate estimate at age 110 |
|---|---|---|
| Probability of death | 11.6% understatement | 26.7% understatement |
| Sacher estimate | 0.1% overstatement | 0.1% overstatement |
| Actuarial estimate | 1.0% understatement | 4.5% understatement |
Some statistical packages may produce biased estimates of hazard rates at advanced ages. This is the case for the Nelson-Aalen hazard rate estimates provided by sts command of Stata statistical software (StataCorp 2009). In fact, the Nelson-Aalen method was initially proposed for cumulative hazard rate estimation (particularly for right-censored survival data) (Klein and Moesberger 1997). In Stata, hazard rate estimation is made by taking the steps of the Nelson-Aalen cumulative hazard function (Cleves et al. 2008) so that for each observed time of death, xj, the estimated hazard contribution is:
where Ĥ (x) is an estimate of cumulative hazard function.
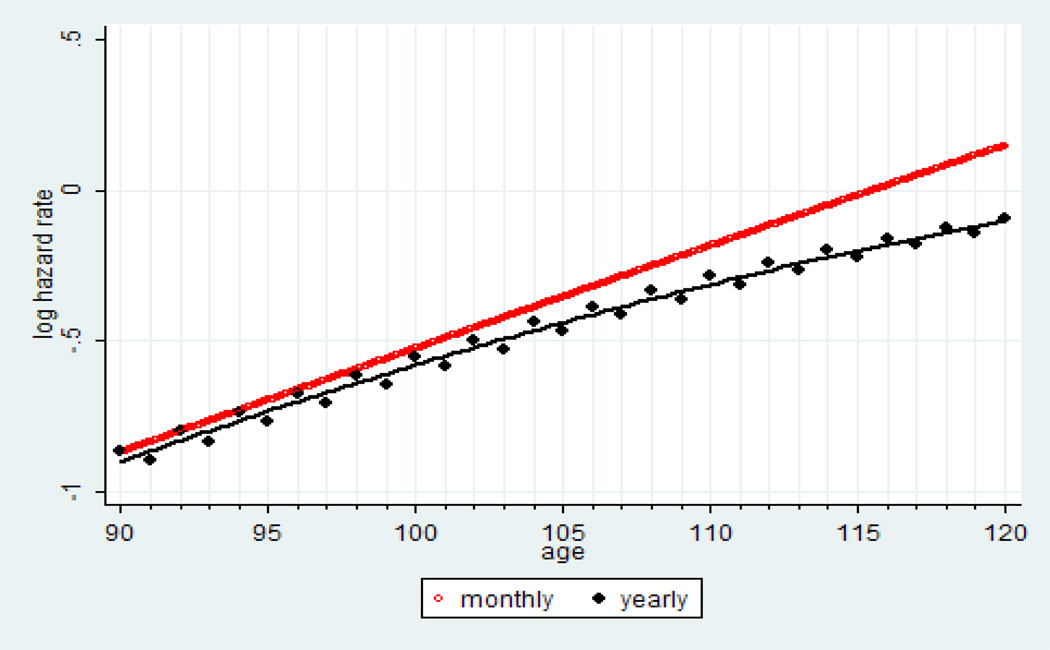
The way hazard rate estimation is conducted in Stata is similar to calculation of life table probability of death (StataCorp 2009), i.e., the number of deaths in the studied age interval is divided by the number alive at the beginning of the age interval. At advanced ages when mortality is high and for relatively wide age intervals, the number of people exposed to risk of death in the middle of the age interval is substantially lower than the number alive at the beginning of the age interval. This would result in downward bias in hazard rate estimates at advanced ages, which is observed when the Nelson-Aalen estimates are applied to yearly age intervals. Simulation studies showed the bias in hazard rate estimation increases with the increase of the age interval (Kimball 1960). Narrowing the age interval for hazard rate estimation from one year to one month helps to improve the accuracy of hazard rate estimation. For smaller monthly age intervals, the problem described above is not so crucial and the Nelson-Aalen method still can be applied. Figure 11 shows Nelson-Aalen hazard rate estimates produced by sts command of Stata for yearly and monthly age intervals using our simulated Gompertz mortality data. Note that hazard rates estimated for yearly age intervals demonstrate substantial mortality deceleration while hazard rate estimates calculated for monthly age intervals follow the Gompertz model.
Figure 11.
Comparison of monthly and yearly estimates of hazard rate using simulated mortality data based on the Gompertz model
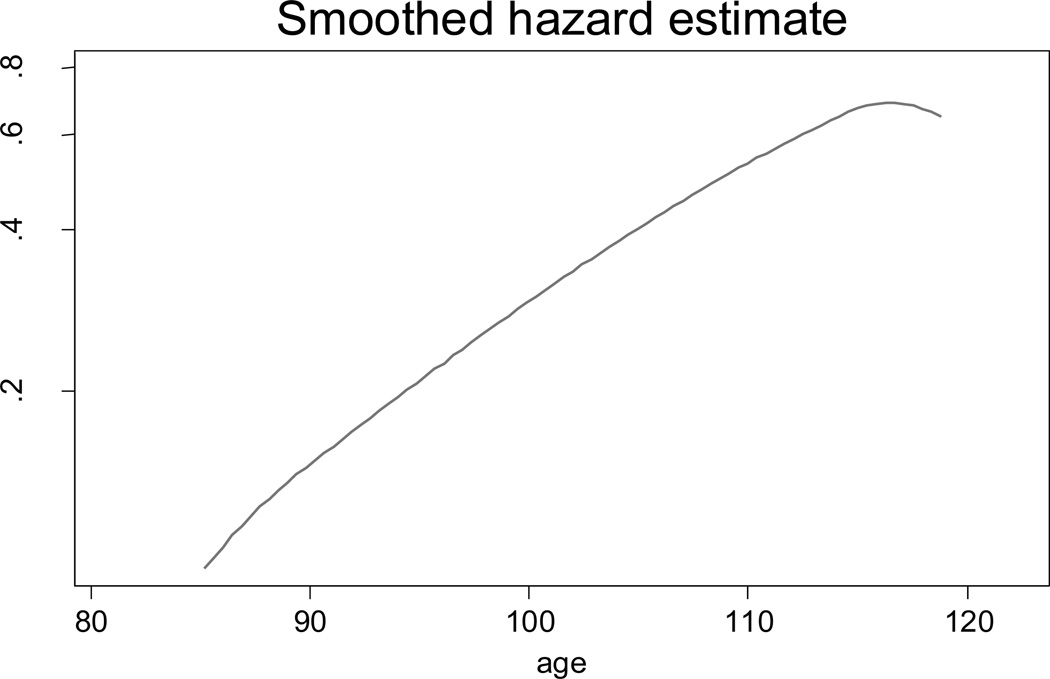
Mortality deceleration and even mortality decline at advanced ages may occur when hazard rates are being smoothed using the kernel smooth procedure. Figure 12 shows mortality trajectory at advanced ages when the Stata kernel smoothing procedure (with default settings) is applied to our simulated Gompertz mortality data.
Figure 12.
Simulated mortality data based on the Gompertz model after the kernel smooth procedure provided by the Stata statistical package
Smoothing procedures assume mortality averaging over rather wide age intervals (bandwidth), which leads to mortality underestimations at very advanced ages when hazard rates grow very rapidly.
These examples suggest that even standard estimates of hazard rates provided by statistical packages should be treated with caution when mortality is studied at very advanced ages.
Footnotes
Presented at the Living to 100 Symposium Orlando, Fla. January 8–10, 2014
All rights reserved by the Society of Actuaries. Permission is granted to make brief excerpts for a published review. Permission is also granted to make limited numbers of copies of items in this monograph for personal, internal, classroom or other instructional use, on condition that the foregoing copyright notice is used so as to give reasonable notice of the Society’s copyright. This consent for free limited copying without prior consent of the Society does not extend to making copies for general distribution, for advertising or promotional purposes, for inclusion in new collective works or for resale.
For example, “Question: Akaike information criterion: Is there any problem if AIC criterion is negative?” http://www.researchgate.net/post/Akaike_information_criterion.
References
- Akaike Hirotugu. A New Look at the Statistical Model Identification. Automatic Control, IEEE Transactions. 1974;19(6):716–723. [Google Scholar]
- Beard Robert E. Note on Some Mathematical Mortality Models. In: Wolstenholme GEW, O’Connor MO, editors. The Lifespan of Animals. Boston: Little, Brown; 1959. pp. 302–311. [Google Scholar]
- Beard Robert E. Some Aspects of Theories of Mortality, Cause of Death Analysis, Forecasting and Stochastic Processes. In: Brass William., editor. Biological Aspects of Demography. London: Taylor and Francis; 1971. pp. 57–68. [Google Scholar]
- Bialik Carl. Death Gets in the Way of Old-Age Gains. The Wall Street Journal. 2012 Mar 2; http://online.wsj.com/news/articles/SB10001424052970203753704577257292958403150?mg=reno64-wsj&url=http%3A%2F%2Fonline.wsj.com%2Farticle%2FSB10001424052970203753704577257292958403150.html. [Google Scholar]
- Bourbeau Robert, Desjardins Bertrand. Mortality at Extreme Ages and Data Quality: The Canadian Experience. In: Robine Jean-Marie, Crimmins Eileen M, Horiuchi Shiro, Yi Zeng., editors. Human Longevity, Individual Life Duration, and the Growth of the Oldest-Old Population. Dordrecht: Springer; 2006. pp. 167–185. [Google Scholar]
- Burnham Kenneth P, Anderson David Raymond. Model Selection and Multimodel Inference: A Practical Information-Theoretic Approach. New York: Springer-Verlag; 2002. [Google Scholar]
- Caselli Graziella, Pozzi Lucia, Vaupel James W, Deiana Luca, Pes Gianni, Carru Ciriaco, Franceschi Claudio, Baggio Giovannella. Family Clustering in Sardinian Longevity: A Genealogical Approach. Experimental Gerontology. 2006;41(8):727–736. doi: 10.1016/j.exger.2006.05.009. [DOI] [PubMed] [Google Scholar]
- Cleves Mario, Gutierrez Roberto, Gould William, Marchenko Yulia. An Introduction to Survival Analysis Using Stata. 2nd ed. College Station, TX: Stata Press; 2008. [Google Scholar]
- Coale Ansley J, Kisker Ellen Eliason. Mortality Crossovers: Reality or Bad Data? Population Studies: A Journal of Demography. 1986;40(3):389–401. [Google Scholar]
- Coale Ansley J, Kisker Ellen Eliason. Defects in Data on Old-Age Mortality in the United States: New Procedures for Calculating Mortality Schedules and Life Tables at the Highest Ages. Asian and Pacific Population Forum. 1990;4(1):1–31. [Google Scholar]
- Cohen Norma. Long-lived Britons Increasing Slower Than Forecast. Financial Times. 2012 Sep 11; http://www.ft.com/intl/cms/s/0/5352ab70-fc2c-11e1-aef9-00144feabdc0.html#axzz33iky7nLX. [Google Scholar]
- Depoid Francoise. Mortality of Old People Over 85. Population. 1973;28(4–5):755–792. [Google Scholar]
- Elo Irma T, Preston Samuel H, Rosenwaike Ira, Hill Mark, Cheney Timothy P. Consistency of Age Reporting on Death Certificates and Social Security Records Among Elderly African Americans. Social Science Research. 1996;25(3):292–307. [Google Scholar]
- Faig Kenneth. Reported Deaths of Centenarians and Near-Centenarians in the U.S. Social Security Administration’s Death Master File. Paper presented at the Society of Actuaries Living to 100 and Beyond Symposium; Orlando, FL.. 2001. [Google Scholar]
- Gallop Adrian, Macdonald Adrian S. Mortality at Advanced Ages in the United Kingdom. Paper presented at the Society of Actuaries Living to 100 and Beyond Symposium; Jan. 12–14; Orlando, FL. 2005. [Google Scholar]
- Gampe Jutta. Human Mortality Beyond Age 110. In: Maier Heiner, Gampe Jutta, Jeune Bernard, Robine Jean-Marie, Vaupel James W., editors. Supercentenarians. Heidelberg: Springer; 2010. pp. 219–230. [Google Scholar]
- Gavrilov Leonid A. Does the Limit of the Life-Span Really Exist? Biofizika. 1984;29(5):908–911. [PubMed] [Google Scholar]
- Gavrilov Leonid A, Gavrilova Natalia S. The Biology of Life Span: A Quantitative Approach. New York: Harwood Academic Publisher; 1991. [Google Scholar]
- Gavrilov Leonid A. Mortality Measurement at Advanced Ages: A Study of the Social Security Administration Death Master File. North American Actuarial Journal. 2011;15(3):432–447. doi: 10.1080/10920277.2011.10597629. [DOI] [PMC free article] [PubMed] [Google Scholar]
- Gavrilov Leonid A, Gavrilova Natalia S, Nosov Victor N. Human Life Span Stopped Increasing: Why? Gerontology. 1983;29(3):176–180. doi: 10.1159/000213111. [DOI] [PubMed] [Google Scholar]
- Gavrilova Natalia S, Gavrilov Leonid A. Biodemography of Old-Age Mortality in Humans and Rodents. The Journals of Gerontology Series A: Biological Sciences and Medical Sciences Published electronically. 2014 Feb. doi: 10.1093/gerona/glu009. [DOI] [PMC free article] [PubMed] [Google Scholar]
- Gehan Edmund A. Estimating Survival Functions From Life Table. Journal of Chronic Diseases. 1969;21(9–10):629–644. doi: 10.1016/0021-9681(69)90035-6. [DOI] [PubMed] [Google Scholar]
- Gehan Edmund A, Siddiqui MM. Simple Regression Methods for Survival Time Studies. Journal of the American Statistical Association. 1973;68(344):848–856. [Google Scholar]
- Gompertz Benjamin. On the Nature of the Function Express five of the Law of Human Mortality and on a New Mode of Determining Life Contingencies. Royal Society of London Philosophical Transactions Series A. 1825;115:513–585. doi: 10.1098/rstb.2014.0379. [DOI] [PMC free article] [PubMed] [Google Scholar]
- Greenwood Major, Irwin JO. The Biostatistics of Senility. Human Biology. 1939;11(1):1–23. [Google Scholar]
- Hill Mark, Rosenwaike Ira. The Social Security Administration's Death Master File: The Completeness of Death Reporting at Older Ages. Social Security Bulletin. 2001;64:45–51. [PubMed] [Google Scholar]
- Hill Mark E, Preston Samuel H, Elo Irma T, Rosenwaike Ira. Age-Linked Institutions and Age Reporting Among Older African Americans. Social Forces. 1997;75(3):1007–1030. [Google Scholar]
- Horiuchi Shiro, Coale Ansley J. Age Patterns of Mortality for Older Women: An Analysis Using the Age-Specific Rate of Mortality Change With Age. Mathematical Population Studies. 1990;2(4):245–267. doi: 10.1080/08898489009525312. [DOI] [PubMed] [Google Scholar]
- Horiuchi Shiro, Wilmoth John R. Age Patterns of the Life Table Aging Rate for Major Causes of Death in Japan, 1951–1990. The Journals of Gerontology Series A: Biological Sciences and Medical Sciences. 1997;52(1):B67–B77. doi: 10.1093/gerona/52a.1.b67. [DOI] [PubMed] [Google Scholar]
- Horiuchi Shiro, Wilmoth John R. Deceleration in the Age Pattern of Mortality at Older Ages. Demography. 1998;35(4):391–412. [PubMed] [Google Scholar]
- Jdanov DA, Jasilionis D, Soroko EL, Rau R, Vaupel JW. Beyond the Kannisto-Thatcher Database on Old Age Mortality: An Assessment of Data Quality at Advanced Ages. MPDIR Working Paper WP 2008–013; Max Planck Institute for Demographic Research; Rostock, Germany. 2008. [Google Scholar]
- Kannisto Vaino. On the Survival of Centenarians and the Span of Life. Population Studies: A Journal of Demography. 1988;42(3):389–406. [Google Scholar]
- Kannisto Vaino. Monographs on Population Aging 1. Odense: Odense University Press; 1994. Development of Oldest-Old Mortality, 1950–1990: Evidence from 28 Developed Countries. [Google Scholar]
- Kestenbaum Bert. A Description of the Extreme Aged Population Based on Improved Medicare Enrollment Data. Demography. 1992;29(4):565–580. [PubMed] [Google Scholar]
- Kimball AW. Estimation of Mortality Intensities in Animal Experiments. Biometrics. 1960;16(4):505–521. [Google Scholar]
- Klein John P, Moesberger Melvin L. Survival Analysis Techniques for Censored and Truncated Data. New York: Springer; 1997. [Google Scholar]
- Le Bras Herve. Mortality Tempo Versus Removal of Causes of Mortality: Opposite Views Leading to Different Estimations of Life Expectancy. Demographic Research. 2005;13:615–640. [Google Scholar]
- Lee Duk Gyoo, Russell Jeffrey S. Panel Data Analysis of Factors Affecting As-Built Roughness of Asphaltic Concrete Pavements. Journal of Transportation Engineering. 2004;130(4):479–485. [Google Scholar]
- Manton Kenneth G, Akushevich Igor, Kulminski Alexander. Human Mortality at Extreme Ages: Data From the NLTCS and Linked Medicare Records. Mathematical Population Studies. 2008;15(3):137–159. [Google Scholar]
- Modig Karin, Drefahl Sven, Ahlbom Anders. Limitless Longevity: Comment on the Contribution of Rectangularization to the Secular Increase of Life Expectancy. International Journal of Epidemiology. 2013;42(3):914–916. doi: 10.1093/ije/dyt035. [DOI] [PMC free article] [PubMed] [Google Scholar]
- Muller Hans-Georg, Wang Jane-Ling, Capra William B. From Lifetables to Hazard Rates: The Transformation Approach. Biometrika. 1997;84(4):881–892. [Google Scholar]
- Perks Wilfred. On some experiments in the graduation of mortality statistics. Journal of the Institute of Actuaries. 1932;63:12–57. [Google Scholar]
- Preston Samuel H, Elo Irma T, Stewart Quincy. Effects of Age Misreporting on Mortality Estimates at Older Ages. Population Studies: A Journal of Demography. 1999;53(2):165–177. [Google Scholar]
- Robine Jean-Marie, Vaupel James W. Supercentenarians: Slower Ageing Individuals or Senile Elderly? Experimental Gerontology. 2001;36(4–6):915–930. doi: 10.1016/s0531-5565(00)00250-3. [DOI] [PubMed] [Google Scholar]
- Sacher George A. On the Statistical Nature of Mortality, With Especial Reference to Chronic Radiation Mortality. Radiology. 1956;67(2):250–257. doi: 10.1148/67.2.250. [DOI] [PubMed] [Google Scholar]
- Sacher George A. The Gompertz Transformation in the Study of the Injury-Mortality Relationship: Application to Late Radiation Effects and Ageing. In: Lindop Patricia J, Sacher George A., editors. Radiation and Ageing. London: Taylor and Francis; 1966. pp. 411–441. [Google Scholar]
- Sesso Howard D, Paffenbarger Ralph S, Lee I-Min. Comparison of National Death Index and World Wide Web Death Searches. American Journal of Epidemiology. 2000;152(2):107–111. doi: 10.1093/aje/152.2.107. [DOI] [PubMed] [Google Scholar]
- StataCorp. Stata Statistical Software: Release 11. College Station, TX: StataCorp LP; 2009. [Google Scholar]
- Stauffer Dietrich. Simple Tools for Forecasts of Population Ageing in Developed Countries Based on Extrapolations of Human Mortality, Fertility and Migration. Experimental Gerontology. 2002;37(8–9):1131–1136. doi: 10.1016/s0531-5565(02)00084-0. [DOI] [PubMed] [Google Scholar]
- Thatcher A. Roger. The Long-Term Pattern of Adult Mortality and the Highest Attained Age. Journal of the Royal Statistical Society Series A: Statistics in Society. 1999;162(1):5–43. doi: 10.1111/1467-985x.00119. [DOI] [PubMed] [Google Scholar]
- Thatcher A. Roger, Kannisto Vaino, Vaupel James W. The Force of Mortality at Ages 80 to 120. Odense: Odense University Press; 1998. [Google Scholar]
- Vaupel James W, Manton Kenneth G, Stallard Eric. Impact of Heterogeneity in Individual Frailty on the Dynamics of Mortality. Demography. 1979;16(3):439–454. [PubMed] [Google Scholar]
- Vincent Paul. La mortalite des Viellards. Population. 1951;6(2):181–204. [Google Scholar]
- Willcox D. Craig, Willcox Bradley J, He Qimei, Wang Nien-chiang, Suzuki Makoto. They Really are That Old: A Validation Study of Centenarian Prevalence in Okinawa. The Journals of Gerontology Series A: Biological Sciences and Medical Sciences. 2008;63(4):338–349. doi: 10.1093/gerona/63.4.338. [DOI] [PubMed] [Google Scholar]
- Wilmoth John R. Are Mortality-Rates Falling at Extremely High Ages? An Investigation Based on a Model Proposed by Coale and Kisker. Population Studies: A Journal of Demography. 1995;49(2):281–295. [Google Scholar]
- Wilmoth John R, Andreev KF, Jdanov DA, Glei DA. Version 5. Germany: Rostock; 2007. Methods Protocol for the Human Mortality Database. [Google Scholar]
- Young Robert D, Desjardins Bertrand, McLaughlin Kirsten, Poulain Michel, Perls Thomas T. Typologies of Extreme Longevity Myths. Current Gerontology and Geriatrics Research, 2010. 2010 doi: 10.1155/2010/423087. [DOI] [PMC free article] [PubMed] [Google Scholar]


