

Abstract
This study was conducted to determine whether spot sign score correlates with average rate of hematoma expansion and whether average rate of expansion predicts in-hospital mortality and clinical outcome in spontaneous intracerebral hemorrhage (ICH). The study included 367 patients presenting to the Emergency Department (ED) from January 1, 2000 to December 31, 2008 with nontraumatic ICH. All received noncontrast computed tomography (NCCT) of the head and multidetector CT angiography (MDCTA) on presentation to the ED and a follow-up NCCT within 48 h. Imaging was used to determine the hematoma location and volume, average rate of expansion, and spot sign score. Primary outcome measures included in-hospital mortality and clinical outcome based on modified Rankin Scale at 3 months or at discharge. Regression analysis was performed to correlate spot sign score and average rate of hematoma expansion. ICH expansion was identified in 194 of 367 patients (53%). In a multivariate analysis, rate of ICH expansion predicted mortality (hazard ratio 1.1, CI 1.08–1.12, p<0.0001). Patients who expired had an average rate of ICH expansion of 2.8 ml/h compared to 0.2 ml/h in survivors. Spot sign score on presentation to the ED correlated with the average rate of hematoma expansion. Average rate of hematoma expansion predicts mortality in spontaneous ICH. Spot sign score on presentation correlates with rate of expansion, supporting the hypothesis that high spot sign scores likely reflect active bleeding in acute ICH.
Keywords: Intracerebral hemorrhage, CT angiography, Mortality, Emergency radiolgy, Hematoma expansion, NCCT
Introduction
Primary intracerebral hemorrhage (ICH) affects over 1 million people worldwide each year and accounts for 20% of all strokes. ICH results in significant mortality, which may reach 30–50% when associated with intraventricular hemorrhage (IVH) and anticoagulation [1, 2]. While multiple factors predict poor outcome including age [3], initial Glasgow coma scale (GCS) [4-7], anticoagulation [8, 9], and intraventricular extension of hemorrhage [3, 7, 10, 11], the volume of blood that exits the ruptured vessel to form the hematoma plays the most potent role in determining prognosis. Because of the role of hematoma volume in ICH outcome, the determinants of hematoma volume have received substantial investigation. In particular, hematoma expansion after initial presentation to the Emergency Department (ED) has become a therapeutic target [4].
Hematoma expansion worsens clinical outcome, and its severity can be predicted by measuring the so-called spot sign score [12] on an initial CT angiogram. While prior reports have determined clinically significant hematoma growth based on absolute growth or as a percent increase of the initial hematoma [13, 14], whether some individuals are bleeding more rapidly than others has never been systematically investigated. A rapid rate of hematoma expansion may result in local traumatic injury and leaves little time for the brain to accommodate to changes in pressure and mass effect. Early identification of patients with high average rates of hematoma expansion may identify a subset of patients most likely to benefit from acute medical or surgical intervention.
Given the relationship between spot sign score and risk of hematoma expansion, we sought to determine whether the average rate of ICH expansion correlates with the spot sign score and predicts in-hospital mortality and clinical outcome at 3 months in patients presenting with nontraumatic intracranial hemorrhage.
Methods
Patient selection
Our study was approved by the hospital’s Institutional Review Board and followed the Health Insurance Portability and Accountability Act of 1996 (HIPPA) regulations in all the phases of the study. We conducted a review of the radiology database and medical records of all patients who presented to our emergency department during a 9-year period, with the following inclusion criteria: (1) evidence of nontraumatic ICH on a noncontrast CT (NCCT) examination of the head; (2) evaluation with a CT angiogram (CTA) of the intracranial circulation within 24 h of admission; and (3) a follow-up NCCT within 48 h of the baseline NCCT. Patients were excluded if they had (1) associated subarachnoid hemorrhage in the basal cisterns or a vascular lesion as the ICH etiology identified in the CTA, (2) loss of gray–white matter differentiation in a vascular territory suggesting a preestablished acute ischemic stroke, (3) anticoagulation between the baseline multi-detector CT angiography (MDCTA) and follow-up NCCT, (4) administration of recombinant factor VIIa, or (5) administration of prothrombin complex concentrate.
Image acquisition
NCCT acquisitions were performed according to standard departmental protocols on 16- or 64-section General Electric helical CT scanners (LightSpeed; GE Medical Systems, Waukesha, WI). NCCT examinations were performed using an axial technique with 120–140 kVp, 170 mA, and 5-mm slice thickness reconstruction. MDCTA was performed by scanning from the base of the C1 vertebral body to the vertex using an axial technique, 0.5 pitch, 1.25-mm collimation, 350 maximal mA, 120 kVp, 22-cm field of view, and 65–85 ml of iodinated contrast material administered by power injector at 4–5 ml/s into an antecubital vein with either a fixed 25-s delay between the onset of contrast injection and the start of scanning, or Smart-Prep, a semi-automatic contrast bolus triggering technique. The decision to perform a follow-up NCCT was at the discretion of the clinical providers.
Image analysis
The NCCT examinations were reviewed by two experienced neuroradiologists (JMR with 10 years of experience and JDA with 4 years of experience, and CAQ certified in the last year) to determine the presence of ICH and associated IVH. Determination of the initial and follow-up ICH and IVH volumes was performed independently and blinded to the initial NCCT with a DICOM image postprocessing software called Analyze 9.0 software (Mayo Clinic, Rochester, MN) The method used was manual hematoma outline and 3D rendering of the baseline and first follow-up NCCT examinations. This method has been used on prior trials with good accuracy [26]. Significant hematoma expansion was considered if the expansion was of 6 ml or 30% compared to baseline ICH as mentioned on prior trials [12]. Average rate of hematoma expansion (ml/h) was calculated as the difference between the initial (ml) and the follow-up hematoma volume (ml), divided by the interval of time between the two exams (h). Subsequently, the 1.25-mm axial CTA source images were independently reviewed in “spot windows” (width 200, level 110) by the same two neuroradiologists to determine the presence of active contrast extravasation, the spot sign, according to the following strict radiological criteria: (1) ≥1 focus of contrast pooling within the ICH; (2) with an attenuation ≥ 120 Hounsfield units (HU); (3) discontinuous from normal or abnormal vasculature adjacent to the ICH; and (4) of any size and morphology [12]. The spot sign score was calculated based on the following criteria: 1–2 spot signs, 1 point; ≥3 spot signs, 2 points; max axial dimension ≥ 5 mm, 1 point; max attenuation ≥ 180 HU, 1 point [22].
Medical record review
Medical records were reviewed for time of ictus, patient age, and gender. We recorded mean arterial blood pressure, international normalized ratio (INR), blood glucose level, history of hypertension, antiplatelet therapy, and surgical intervention within initial 24 h after admission. In addition, the administration of fresh frozen plasma, vitamin K, and platelet transfusions on admission were also recorded. A known time of ictus was only recorded if the onset of symptoms was either witnessed or self reported by the patient within a 15-min margin of error as documented in the Neurology ED consultation notes. For all other patients, including those patients who awoke with neurological symptoms, a known time of ictus was not recorded. Modified Rankin score was calculated at 3 months after discharge, when this score was not obtainable, the discharge modified Rankin score was used. Poor clinical outcome among patients surviving to discharge was defined as patients with a modified Rankin score of 3–6, whereas a favorable clinical outcome was defined as a modified Rankin score of 0–2.
Statistical analysis
Statistical analysis was performed using both Excel (Microsoft) and XLSTAT (Addinsoft USA). Ordinal multivariate logistic regression analysis and linear regression for continuous variables were performed to determine independent predictors of in-hospital mortality and poor clinical outcome. Hazard ratios were calculated to determine mortality risk based on average rate of hematoma expansion and initial IPH volume. The receiver operating characteristic (ROC) analysis was used to determine the area under the curve for the average rate of ICH change in the prediction of mortality and poor outcome among survivors at the time of discharge and at 3-month follow-up. A p value of 0.05 was considered statistically significant. Spearman coefficient (ρ) was performed to correlate average rate of hematoma expansion and spot sign score.
Results
Patient characteristics
During a period of 9 years, a total of 367 patients met our study’s inclusion criteria with a mean age of 66 years (median 68 years, range 6–94 years). A number 202 patients had a known time of ictus (55%; mean time from ictus to MDCTA evaluation 7.4 h, median 5.5 h, range 0.75–37.75 h). Mean time from emergency department admission to MDCTA evaluation was 2.4 h (median 1.25 h, range 0.25–24 h). Mean time to first follow-up NCCT was 14.1 h after the baseline NCCT (median 12 h, range 1–48 h). Mean initial ICH volume was 29 ml (median 19.8 ml, range 0.2–169 ml), and mean initial IVH volume was 11 ml (median 4.1 ml, range 0.1–116 ml). On admission, 62 patients received vitamin K (17%), 68 patients received fresh frozen plasma (18.5%), and 24 patients received platelet transfusions (6.5%).
A number of 451 patients were excluded from the study (55.1%): 252 due to lack of a follow-up NCCT within 48 h of the baseline NCCT, 152 due to the presence of associated subarachnoid hemorrhage within the basal cisterns or a vascular lesion as the ICH etiology, 19 due to incomplete admission clinical data, 15 due to loss of gray–white matter differentiation in a vascular territory, 11 due to immediate anticoagulation treatment for dural venous sinus thrombosis, and 2 due to administration of recombinant factor VIIa. No patient received prothrombin complex concentrate. Table 1 shows demographic characteristics of the population and baseline data.
Table 1.
Demographic characteristics and baseline data (n=367)
| Age (mean±SD) | 66±15 |
| Sex | 58% Male, 42% female |
| Hypertension | 68% |
| Glucose (mean±SD) | 145±51 |
| Platelets (mean±SD) | 245±77 |
| Anticoagulation | Yes (16%), no (27%), unknown (57%) |
| INR (mean±SD) | 1.4±1.0 |
| Antiplatelet medication | Yes (32%), no (68%) |
| Vitamin K | 17% |
| Fresh frozen plasma | 19% |
| Initial ICH volume (mean±SD) | 31.3±33.7 ml |
| IVH | Yes (44%), no (56%) |
| Time of onset to NCCT (mean±SD) | 2.4±3.3 h |
| Time of onset to follow up NCCT (mean±SD) | 14.1±10.2 h |
| Admission ICH volume (median) | 24.3 ml |
| Follow-up ICH volume (median) | 24.4 ml |
| Good outcome (mRs00–2) | 75% (54% rehab, 21% home) |
| Rate of hematoma expansion (mean±SD) | 0.8±5.1 ml/h |
INR International normalized ratio, ICH intracerebral hemorrhage, mRs modified Rankin score
Results based on rate of hematoma expansion
Any ICH growth within 48 h of the baseline NCCT was identified in 194 of 367 patients (53%) within 48 h. Growth of 6 ml or more than 30% from the baseline ICH volume was detected in 56 patients (15%).
Patients who expired had an average rate of ICH expansion of 2.8 ml/h compared to 0.2 ml/h in survivors. Rapid ICH expansion predicted mortality within the first 12 h (hazard ratio 1.1, CI 1.08–1.12, p<0.0001; Fig. 1). In a multivariate analysis, the average rate of ICH expansion (OR 1.3, 95% CI 1.1–1.5, p=0.001) and initial ICH size (OR 9.9, CI 4.9–20.0, p<0.0001) were independent predictors of mortality.
Fig. 1.

Comparison of the average rate of ICH expansion (ml/h) of patients who expired and patients who survived
In order to determine the most relevant average rate of ICH expansion as a predictor of mortality, an optimal operating point was calculated based on an ROC curve analysis. This analysis revealed that an average rate of ICH expansion greater than or equal to 0.6 ml/h resulted in a 5.5-fold increased risk of mortality (OR 5.5; sensitivity of 32%; specificity of 92%). When patients were divided in groups according to average rate of hematoma expansion and compared with their mean survival rate, we detected a stepwise decrease of survival probability with higher average rates of ICH expansion (Fig. 2). Table 2 compares baseline characteristics of patients with ≥0.6 and <0.6 ml/h
Fig. 2.
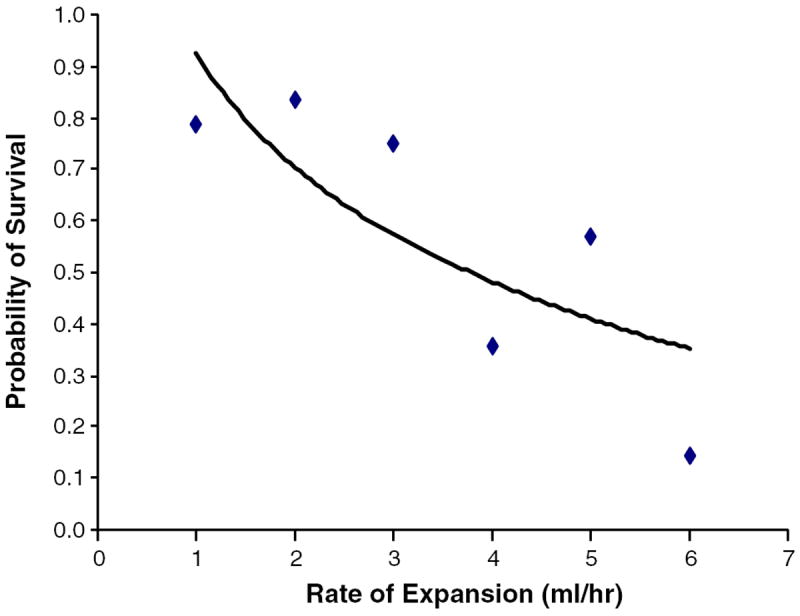
Correlation of average rate of ICH expansion and probability of survival
Table 2.
Baseline characteristics of high expansion rate and low expansion rate ICH
| Low expansion rate (<0.6 ml/h) | High expansion rate (>0.6 ml/h) | p Value | |
|---|---|---|---|
| Age (mean±SD) | 65±16 | 70±13 | 0.10* |
| Sex | 43% Male, 57% female | 37% Male, 63% female | 0.45a |
| Hypertension + | 70% | 80% | 0.15a |
| Glucose (mean±SD) | 143±49 | 157±61 | 0.06* |
| Platelets (mean±SD) | 245±77 | 246±77 | 0.89* |
| Anticoagulation | Yes (14%), no (26%), unknown (59%) | Yes (27%), no (33%), unknown (40%) | 0.11** |
| INR (mean±SD) | 1.3±0.7 | 1.8±2.1 | 0.002* |
| Antiplatelet medication | 30% | 50% | 0.02a |
| Vitamin K | 20% | 30% | 0.05a |
| Fresh frozen plasma | 20% | 30% | 0.05a |
| Initial ICH volume (mean±SD) | 25.0±24.8 | 52.0±32.2 | <0.001* |
| IVH | 40% | 60% | 0.02a |
| Time of onset to CT (mean±SD) | 2.6±3.5 | 1.1±1.3 | 0.002* |
| Time of onset to follow up CT (mean±SD) | 15.5±10.2 | 6.1±4.1 | <0.001* |
| Admission ICH Volume (median) | 16 | 47.5 | <0.001b |
| Follow up ICH volume (median) | 15.4 | 69.9 | <0.001b |
| Rate of hematoma expansion (mean±SD) | (-) 0.06±0.3 | 6.3±12.4 | <0.001* |
ICH Intracerebral hemorrhage, INR international normalized ratio
Student’s t test,
ANOVA
Fisher’s exact test
Mann–Whitney test
Results correlating mRs and rate of hematoma expansion
A logistic regression was used to correlate the rate of hematoma expansion and modified Rankin score (mRs). Although a strong trend was observed in the correlation between average rate of hematoma expansion with clinical outcome (mRs) among all patients, the analysis did not reach statistical significance (p=0.07; 95% CI 0.023–0.421).
Results based on initial hematoma volume
The average rate of ICH expansion was an independent predictor of mortality when patients were divided into those that had an initial ICH volume of more than 30 ml (p value 0.02) and those that had smaller hematomas with less than 30 ml (p value 0.002). (Fig. 3).
Fig. 3.

Comparisons of the average rate of ICH expansion of patients with baseline ICH volume < 30 ml to patients <30 ml and mortality. p Values: 0.002 (Initial ICH<30 ml, Survivor to Expired); 0.02 (Initial ICH>30 ml Survivor to Expired)
Results based on time of follow-up NCCT
When patients were divided into those that had a follow-up NCCT in the initial 3, 4–6, 7–12, 12–24, and 24–48 h, the average rate of expansion was significantly higher in patients who expired compared to the patients who survived only within the initial 12 h. There was no significant difference in patients who survived compared to those who expired after 12 h (Fig. 4).
Fig. 4.

Comparisons of the average rates of ICH expansion within the different time frames of follow-up imaging and mortality
Correlation of average rate of expansion and spot sign score
There was a significant moderate positive correlation between progressively increased average rates of ICH expansion and higher spot sign scores (ρ=0.5, p≤0.0001; Fig. 5).
Fig. 5.
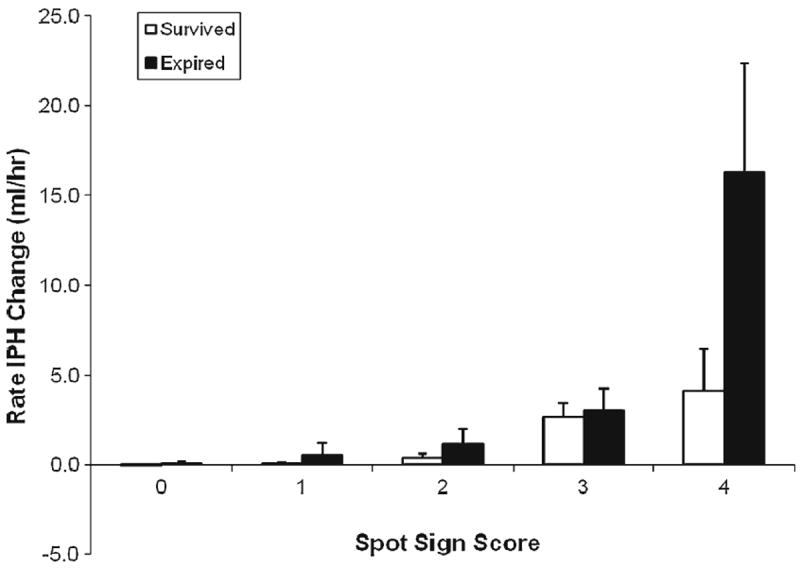
Average rate of ICH expansion compared to assigned spot sign score in patients who survived and patients who expired
Correlation of the spot sign and spot sign score on the prediction of mortality and clinical outcome in primary ICH
The spot sign score was entered into the multivariate logistic regression model, and became the only independent predictor of significant hematoma expansion (P0.0001) independent of time from ictus to MDCTA evaluation, admission INR, mean arterial blood pressure, blood glucose level, as well as initial ICH volume and controlling for the administration of fresh frozen plasma, vitamin K, and platelet transfusions.
Discussion
In this study, we explored the relationship between the average rate of ICH expansion and mortality risk as well as clinical outcome (mRs). We found that higher average rates of expansion in the initial 12 h strongly predict in-hospital mortality. Based on the short term follow-up NCCT scan of the head, we detected a significant difference in the average rate of hematoma expansion in those patients that expired (2.8 ml/h) compared to the patients that survived (0.2 ml/h; HR=1.1; p≤00001) In a multivariate analysis, adjusting for baseline volume and time from ictus to imaging, we found that the average rate of expansion independently predicts mortality. We have reproduced results of previous studies that reported that initial ICH volume is related to increased mortality risk [6, 7, 14, 15]. Also similar to prior reports [14, 16, 17] we found higher absolute and percentage hematoma growth in patients with larger baseline ICH volume.
The observation that patients with higher average rate of hematoma expansion also had larger initial ICH volumes raised the question of whether the increased mortality in these patients reflected the initial ICH size rather than the average rate of expansion. To address this question, we explored the influence of average rate of expansion in smaller hematomas, and we found that even in hematomas of 30 cc or smaller, there was a significant difference in the average rate of hematoma expansion in the patients that expired compared to those who survived as shown in Fig. 2. These results demonstrate that although the size of the initial hematoma is a key factor in mortality risk, the average rate at which the hematoma expands, including in small hematomas, also has an influential role.
Earlier follow-up NCCT exams correlated with higher average rates of expansion and higher rates of mortality in our study. A likely explanation is that the occurrence of early clinical deterioration serves as a trigger for request for follow-up imaging. This effect was previously proposed by Leira and collaborators [16], who demonstrated that early ICH growth had an OR of 4.3 for early clinical deterioration. When patients were divided into groups according to the time to follow-up imaging (<3, 3–4, 4–6, 6–12, 13–24, and 25–48 h), we found that among patients who underwent follow-up imaging in the initial 12 h, those who expired had significantly higher hematoma expansion rates than those who survived (see Fig. 4). These data show that average rate of hematoma expansion is an important predictor of mortality independent of the time to follow-up imaging.
We found that IVH was associated with higher rates of mortality. This association has been previously reported [10]. Our rates of IVH of 44% were similar to prior studies [11]. Patients with higher average rates of expansion had significantly increased INR, anti-platelet medication, shorter time from ictus to initial CT, and shorter time from ictus to follow-up exam, IVH, and larger initial ICH volume, compared with patients with lower average rates of hematoma expansion. Additionally, a strong trend (p=0.06) was observed in the correlation between average rate of hematoma expansion with clinical outcome.
Prior studies have demonstrated that hematoma growth correlates with mortality [4]. In our study, 15% of patients demonstrated significant hematoma growth (>6 ml or >30% of the initial volume). This finding is similar to the results of a prior study, which reported that 14% of hematomas grew within the initial 24 h [18]. By contrast, another prior study demonstrated significant growth in 38% of the patients [19]. One possible explanation for the apparent discrepancy in the percentage of patients exhibiting significant hematoma growth is the differences in time to follow-up imaging. Studies with shorter time to follow-up imaging are expected to demonstrate a lower percentage of significant hematoma growth relative to studies with a longer time to follow-up imaging. Intracerebral hematoma absolute growth has been evaluated in recent prospective trials [4] and case series [20, 21], and they have found that absolute ICH growth is an independent predictor of mortality in patients with spontaneous ICH. Although absolute growth was also a key factor for mortality and clinical outcome in the present study, we observed that the average rate of hematoma expansion also plays a significant role.
There was a strong correlation between the average rate of ICH expansion and the spot sign score. Higher spot sign scores were positively correlated to a higher average rate of ICH expansion. The absence of spot sign (spot sign score of 0) had a mean rate of expansion of 0.006 ml/h, while a spot sign score of 4 had a mean average rate of expansion of 13.08 ml/h, as shown in Fig. 5. This finding supports the proposition that the spot sign score is a measure of active bleeding [22-25].
The limitations of this trial include its retrospective design and the potential bias introduced by the likely shorter time to follow-up NCCT in patients with higher average rates of hematoma expansion. Also, we acknowledge that the average rate of expansion of any given hematoma may not be continuous and that the actual rate may be different than was estimated by the imaging approach that was employed. Average rate is an approximation to the real rate of hematoma expansion and is likely close given that it is capturing most of the lifetime of hematoma expansion within the two NCCT. It is likely that sequential imaging every 1 to 2 h may result in a more precise measurement of ICH rate of expansion. However, the logistics of precisely scheduled follow-up scans in a critically ill patient population and the risk of excessive patient radiation make scheduled follow-up NCCT an impractical strategy. This is a limitation of the current clinical practice; however, given the short time interval for follow-up NCCT in this population, we believe that this limitation does not significantly affect our conclusions.
In conclusion, there significant correlation between the average rate of hematoma expansion and the spot sign score, strongly suggesting that the spot sign is a radiological marker of active bleeding, and that the spot sign score may be a valuable predictor of the average rate of hematoma expansion. The average rate of hematoma expansion is an independent risk factor for mortality in patients with spontaneous ICH including in patients with initial hematomas smaller than 30 cc. Early detection of patients that exhibit high average rates of hematoma expansion may be an ideal target for medical or surgical hemostatic therapy.
Abbreviations
- ICH
Intracerebral hemorrhage
- IVH
Intraventricular hemorrhage
- NCCT
Noncontrast computed tomography
- MDCTA
Multidetector CT angiography
Footnotes
Conflicts of interest None.
Contributor Information
Javier M. Romero, Email: jmromero@partners.org, Division of Neuroradiology, Department of Radiology, Massachusetts General Hospital, Harvard Medical School, 55 Fruit Street, Gray B, Office # 279, Boston, MA 01778, USA.
Jeremy J. Heit, Division of Neuroradiology, Department of Radiology, Massachusetts General Hospital, Harvard Medical School, 55 Fruit Street, Gray B, Office # 279, Boston, MA 01778, USA
Josser E. Delgado Almandoz, Interventional Neuroradiology, Abbott Northwestern Hospital, Minneapolis, MN, USA
Joshua N. Goldstein, Department of Emergency Medicine, Massachusetts General Hospital, Harvard Medical School, Boston, MA, USA
Jingjing Lu, Division of Neuroradiology, Department of Radiology, Massachusetts General Hospital, Harvard Medical School, 55 Fruit Street, Gray B, Office # 279, Boston, MA 01778, USA.
Elkan Halpern, Division of Neuroradiology, Department of Radiology, Massachusetts General Hospital, Harvard Medical School, 55 Fruit Street, Gray B, Office # 279, Boston, MA 01778, USA.
Steven M. Greenberg, Department of Neurology, Massachusetts General Hospital, Harvard Medical School, Boston, MA, USA
Jonathan Rosand, Department of Neurology, Massachusetts General Hospital, Harvard Medical School, Boston, MA, USA.
R. Gilberto Gonzalez, Division of Neuroradiology, Department of Radiology, Massachusetts General Hospital, Harvard Medical School, 55 Fruit Street, Gray B, Office # 279, Boston, MA 01778, USA.
References
- 1.Qureshi AI, Tuhrim S, Broderick JP, Batjer HH, Hondo H, Hanley DF. Spontaneous intracerebral hemorrhage. N Engl J Med. 2001;344:1450–1460. doi: 10.1056/NEJM200105103441907. [DOI] [PubMed] [Google Scholar]
- 2.Zhang LF, Yang J, Hong Z, Yuan GG, Zhou BF, Zhao LC, Huang YN, Chen J, Wu YF. Proportion of different subtypes of stroke in china. Stroke. 2003;34:2091–2096. doi: 10.1161/01.STR.0000087149.42294.8C. [DOI] [PubMed] [Google Scholar]
- 3.Cheung RT, Zou LY. Use of the original, modified, or new intracerebral hemorrhage score to predict mortality and morbidity after intracerebral hemorrhage. Stroke. 2003;34:1717–1722. doi: 10.1161/01.STR.0000078657.22835.B9. [DOI] [PubMed] [Google Scholar]
- 4.Davis SM, Broderick J, Hennerici M, Brun NC, Diringer MN, Mayer SA, Begtrup K, Steiner T. Hematoma growth is a determinant of mortality and poor outcome after intracerebral hemorrhage. Neurology. 2006;66:1175–1181. doi: 10.1212/01.wnl.0000208408.98482.99. [DOI] [PubMed] [Google Scholar]
- 5.Broderick JP, Brott TG, Duldner JE, Tomsick T, Huster G. Volume of intracerebral hemorrhage. A powerful and easy-to-use predictor of 30-day mortality. Stroke. 1993;24:987–993. doi: 10.1161/01.str.24.7.987. [DOI] [PubMed] [Google Scholar]
- 6.Rost NS, Smith EE, Chang Y, Snider RW, Chanderraj R, Schwab K, FitzMaurice E, Wendell L, Goldstein JN, Greenberg SM, Rosand J. Prediction of functional outcome in patients with primary intracerebral hemorrhage: the FUNC score. Stroke. 2008;39:2304–2309. doi: 10.1161/STROKEAHA.107.512202. [DOI] [PubMed] [Google Scholar]
- 7.Hemphill JC, 3rd, Bonovich DC, Besmertis L, Manley GT, Johnston SC. The ICH score: a simple, reliable grading scale for intracerebral hemorrhage. Stroke. 2001;32:891–897. doi: 10.1161/01.str.32.4.891. [DOI] [PubMed] [Google Scholar]
- 8.Rosand J, Eckman MH, Knudsen KA, Singer DE, Greenberg SM. The effect of warfarin and intensity of anticoagulation on outcome of intracerebral hemorrhage. Arch Intern Med. 2004;164:880–884. doi: 10.1001/archinte.164.8.880. [DOI] [PubMed] [Google Scholar]
- 9.Flaherty ML, Tao H, Haverbusch M, Sekar P, Kleindorfer D, Kissela B, Khatri P, Stettler B, Adeoye O, Moomaw CJ, Broderick JP, Woo D. Warfarin use leads to larger intracerebral hematomas. Neurology. 2008;71:1084–1089. doi: 10.1212/01.wnl.0000326895.58992.27. [DOI] [PMC free article] [PubMed] [Google Scholar]
- 10.Hallevi H, Dar NS, Barreto AD, Morales MM, Martin-Schild S, Abraham AT, Walker KC, Gonzales NR, Illoh K, Grotta JC, Savitz SI. The IVH score: a novel tool for estimating intraventricular hemorrhage volume: clinical and research implications. Crit Care Med. 2009;37:969–974, e1. doi: 10.1097/CCM.0b013e318198683a. [DOI] [PMC free article] [PubMed] [Google Scholar]
- 11.Steiner T, Diringer MN, Schneider D, Mayer SA, Begtrup K, Broderick J, Skolnick BE, Davis SM. Dynamics of intraventricular hemorrhage in patients with spontaneous intracerebral hemorrhage: risk factors, clinical impact, and effect of hemostatic therapy with recombinant activated factor VII. Neurosurgery. 2006;59:767–773. doi: 10.1227/01.NEU.0000232837.34992.32. discussion 773–764. [DOI] [PubMed] [Google Scholar]
- 12.Delgado Almandoz JE, Yoo AJ, Stone MJ, Schaefer PW, Oleinik A, Brouwers HB, Goldstein JN, Rosand J, Lev MH, Gonzalez RG, Romero JM. The spot sign score in primary intracerebral hemorrhage identifies patients at highest risk of inhospital mortality and poor outcome among survivors. Stroke. 2010;41:54–60. doi: 10.1161/STROKEAHA.109.565382. [DOI] [PMC free article] [PubMed] [Google Scholar]
- 13.Anderson CS, Huang Y, Arima H, Heeley E, Skulina C, Parsons MW, Peng B, Li Q, Su S, Tao QL, Li YC, Jiang JD, Tai LW, Zhang JL, Xu E, Cheng Y, Morgenstern LB, Chalmers J, Wang JG. Effects of early intensive blood pressure-lowering treatment on the growth of hematoma and perihematomal edema in acute intracerebral hemorrhage: the intensive blood pressure reduction in acute cerebral haemorrhage trial (INTERACT) Stroke. 2010;41:307–312. doi: 10.1161/STROKEAHA.109.561795. [DOI] [PubMed] [Google Scholar]
- 14.Broderick JP, Diringer MN, Hill MD, Brun NC, Mayer SA, Steiner T, Skolnick BE, Davis SM. Determinants of intracerebral hemorrhage growth: an exploratory analysis. Stroke. 2007;38:1072–1075. doi: 10.1161/01.STR.0000258078.35316.30. [DOI] [PubMed] [Google Scholar]
- 15.Godoy DA, Pinero G, Di Napoli M. Predicting mortality in spontaneous intracerebral hemorrhage: can modification to original score improve the prediction? Stroke. 2006;37:1038–1044. doi: 10.1161/01.STR.0000206441.79646.49. [DOI] [PubMed] [Google Scholar]
- 16.Leira R, Davalos A, Silva Y, Gil-Peralta A, Tejada J, Garcia M, Castillo J. Early neurologic deterioration in intracerebral hemorrhage: predictors and associated factors. Neurology. 2004;63:461–467. doi: 10.1212/01.wnl.0000133204.81153.ac. [DOI] [PubMed] [Google Scholar]
- 17.Silva Y, Leira R, Tejada J, Lainez JM, Castillo J, Davalos A. Molecular signatures of vascular injury are associated with early growth of intracerebral hemorrhage. Stroke. 2005;36:86–91. doi: 10.1161/01.STR.0000149615.51204.0b. [DOI] [PubMed] [Google Scholar]
- 18.Fujii Y, Takeuchi S, Sasaki O, Minakawa T, Tanaka R. Multivariate analysis of predictors of hematoma enlargement in spontaneous intracerebral hemorrhage. Stroke. 1998;29:1160–1166. doi: 10.1161/01.str.29.6.1160. [DOI] [PubMed] [Google Scholar]
- 19.Brott T, Broderick J, Kothari R, Barsan W, Tomsick T, Sauerbeck L, Spilker J, Duldner J, Khoury J. Early hemorrhage growth in patients with intracerebral hemorrhage. Stroke. 1997;28:1–5. doi: 10.1161/01.str.28.1.1. [DOI] [PubMed] [Google Scholar]
- 20.Chen ST, Chen SD, Hsu CY, Hogan EL. Progression of hypertensive intracerebral hemorrhage. Neurology. 1989;39:1509–1514. doi: 10.1212/wnl.39.11.1509. [DOI] [PubMed] [Google Scholar]
- 21.Kelley RE, Berger JR, Scheinberg P, Stokes N. Active bleeding in hypertensive intracerebral hemorrhage: computed tomography. Neurology. 1982;32:852–856. doi: 10.1212/wnl.32.8.852. [DOI] [PubMed] [Google Scholar]
- 22.Delgado Almandoz JE, Yoo AJ, Stone MJ, Schaefer PW, Goldstein JN, Rosand J, Oleinik A, Lev MH, Gonzalez RG, Romero JM. Systematic characterization of the computed tomography angiography spot sign in primary intracerebral hemorrhage identifies patients at highest risk for hematoma expansion: the spot sign score. Stroke. 2009;40:2994–3000. doi: 10.1161/STROKEAHA.109.554667. [DOI] [PMC free article] [PubMed] [Google Scholar]
- 23.Goldstein JN, Fazen LE, Snider R, Schwab K, Greenberg SM, Smith EE, Lev MH, Rosand J. Contrast extravasation on ct angiography predicts hematoma expansion in intracerebral hemorrhage. Neurology. 2007;68:889–894. doi: 10.1212/01.wnl.0000257087.22852.21. [DOI] [PubMed] [Google Scholar]
- 24.Wada R, Aviv RI, Fox AJ, Sahlas DJ, Gladstone DJ, Tomlinson G, Symons SP. Ct angiography “Spot sign” Predicts hematoma expansion in acute intracerebral hemorrhage. Stroke. 2007;38:1257–1262. doi: 10.1161/01.STR.0000259633.59404.f3. [DOI] [PubMed] [Google Scholar]
- 25.Becker KJ, Baxter AB, Bybee HM, Tirschwell DL, Abouelsaad T, Cohen WA. Extravasation of radiographic contrast is an independent predictor of death in primary intracerebral hemorrhage. Stroke. 1999;30:2025–2032. doi: 10.1161/01.str.30.10.2025. [DOI] [PubMed] [Google Scholar]
- 26.Minnerup J, Wersching H, Bernd Ringelstein E, Heindel W, Niederstadt T, Schilling M, Schäbitz W-R, Kemmling A. Prediction of malignant middle cerebral artery infarction using computed tomography-based intracranial volume reserve measurements. Stroke. 2011;42:3403–3409. doi: 10.1161/STROKEAHA.111.619734. [DOI] [PubMed] [Google Scholar]