

Abstract
It is unclear whether strength training (ST) or power training (PT) is the more effective intervention at improving muscle strength and power and physical function in older adults. The authors compared the effects of lower extremity PT with those of ST on muscle strength and power in 45 older adults (74.8 ± 5.7 yr) with self-reported difficulty in common daily activities. Participants were randomized to 1 of 3 treatment groups: PT, ST, or wait-list control. PT and ST trained 3 times/wk for 12 wk using knee-extension (KE) and leg-press (LP) machines at ~70% of 1-repetition maximum (1RM). For PT, the concentric phase of the KE and LP was completed “as fast as possible,” whereas for ST the concentric phase was 2–3 s. Both PT and ST paused briefly at the midpoint of the movement and completed the eccentric phase of the movement in 2–3 s. PT and ST groups showed significant improvements in KE and LP 1RM compared with the control group. Maximum KE and LP power increased approximately twofold in PT compared with ST. At 12 wk, compared with control, maximum KE and LP power were significantly increased for the PT group but not for the ST group. In older adults with compromised function, PT leads to similar increases in strength and larger increases in power than ST.
Keywords: aging, resistance training, disability, physical function
It is well established that muscle mass declines with age, a process termed sarcopenia (Rosenberg, 1989). A wide range of factors have been identified to explain the etiology of sarcopenia, including loss of motor units and muscle fibers (Doherty, Vandervoort, & Brown, 1993; Lexell, Taylor, & Sjostrom, 1988), declines in hormones such as testosterone and growth hormone that are anabolic to skeletal muscle (Lamberts, van den Beld, & van der Lely, 1997; Short & Nair, 1999), and disuse or reduced physical activity (D’Antona et al., 2003; D’Antona, Pellegrino, Carlizzi, & Bottinelli, 2007; DiPietro, 2001). Furthermore, there is a decrease in the specific tension of both Type I and Type II muscle fibers with aging (Frontera, Suh, et al., 2000; Morse, Thom, Reeves, Birch, & Narici, 2005). There is a close association between decreases in muscle mass and muscle cross-sectional area with declines in muscle strength (Evans & Campbell, 1993; Frontera, Huges, et al., 2000; Frontera, Suh, et al.; Frontera, Hughes, Lutz, & Evans, 1991; Lexell et al.; Young, Stokes, & Crowe, 1984, 1985). According to most longitudinal data, the rate of strength decline with advancing age appears to be ~1–2% per year, a rate slightly greater than that reported in cross-sectional studies (Aniansson, Hedberg, Henning, & Grimby, 1986; Bassey, 1998; Bassey & Harries, 1993; Frontera, Hughes, et al., 2000; Hughes et al., 2001; Kallman, Plato, & Tobin, 1990; Lindle et al., 1997; Metter, Conwit, Tobin, & Fozard, 1997; Rantanen et al., 1998; Winegard, Hicks, Sale, & Vandervoort, 1996).
Because muscle power is a combination of force and speed, muscle power also declines with age. However, the data on the rate of decline of muscle power, although limited, suggest that power may decline as much as ~3.5% per year (Skelton, Greig, Davies, & Young, 1994; Young, 1997). Metter et al. (1997) observed that muscle power declined earlier than strength in women, and “the age decline in power was about 10% greater than the decline in strength from age 20 to 80 years (significant for men but not women)” (p. 273). The explanation for the more rapid decline in muscle power than in strength often centers around the age-related changes that occur in Type I, Type IIa, and Type IIb muscle fibers. It appears that there is a selective loss and/or atrophy of Type II fibers in older adults, which is problematic because Type II fibers have a power output three to four times that of Type I fibers (Brooks & Faulkner, 1994; Brooks, Faulkner, & McCubbrey, 1990). For example, early work by Larsson and colleagues (Larsson, Grimby, & Karlsson, 1979; Larsson, Sjodin, & Karlsson, 1978) demonstrated a decreased proportion of Type II fibers and a selective atrophy of Type II fibers with increasing age. Subsequently, Lexell et al. (1988) reported that atrophy of the vastus lateralis muscle, beginning around age 25, was caused mainly by a general loss of Type I and Type II fibers (about 50% loss from 20 to 80 years of age) and to a lesser extent by a reduction in fiber size, mostly of Type II fibers. Coggan et al. (1992) showed that the percentage of Type I, Type IIa, and Type IIb fibers did not differ between young (~24 years) and old (~64 years) participants, but Type I fibers occupied a larger percentage of total muscle area in the older men and women because Type IIa and Type IIb fibers were 13–31% smaller in the older adults. In addition, the maximal unloaded shortening velocity and the specific tension (force/cross-sectional area) decline in both Type I and Type IIa fibers by as much as 40% with aging (Larsson, Li, & Frontera, 1997). Older muscle also contracts and relaxes more slowly (Vandervoort & McComas, 1986), which may be related to a reduction in sarcoplasmic reticulum activity (Delbono, Renganathan, & Messi, 1997). Finally, tendon stiffness declines with aging, which may lead to a decline in the rate of force development, that is, declines in muscle power (Macaluso & De Vito, 2004; Reeves, Narici, & Maganaris, 2006).
Whereas reductions in both muscle strength and muscle power have been predictive of functional limitations and disability in older adults (Bassey et al., 1992; Foldvari et al., 2000; Young & Skelton, 1994), it has been suggested that the loss in lower extremity muscle power may be more important than strength loss with respect to limiting mobility-related activities of daily living (Bassey et al.; Bean et al., 2003; Izquierdo, Aguado, Gonzalez, Lopez, & Hakkinen, 1999; Marsh et al., 2006; Suzuki, Bean, & Fielding, 2001) and to the etiology of falls (Skelton, Kennedy, & Rutherford, 2002).
Studies that have incorporated higher movement speeds in resistance-training interventions in older adults suggest that significant improvements in strength, as well as muscle power, are possible (Bean et al., 2004; Earles, Judge, & Gunnarsson, 2001; Fielding et al., 2002; Hakkinen, Kraemer, Newton, & Alen, 2001; Hruda, Hicks, & McCartney, 2003; Izquierdo et al., 2001; Macaluso, Young, Gibb, Rowe, & De Vito, 2003). However, it is not clear from the literature whether ST or PT is the more effective intervention at improving muscle strength or power. For example, in studies that have directly compared PT and ST in older adults (Bottaro, Machado, Nogueira, Scales, & Veloso, 2007; Fielding et al.; Henwood, Riek, & Taaffe, 2008; Henwood & Taaffe, 2006), PT did not always lead to greater improvements in muscle strength or power than ST. Likewise, it is not clear in the literature whether PT increases physical function more than ST does in older adults. For example, studies have reported the following: (a) increases in muscle power after PT and ST but increases in 30-s chair stand and 8-ft up-and-go in the PT group only (Bottaro et al.); (b) increases in power but no change in balance, chair rise, stair climb, or gait speed (Sayers et al., 2003) or similar increases in power for PT and ST with improvements in function that did not favor PT over ST (Henwood et al.); (c) no changes in strength or peak anaerobic power after PT or ST but greater increases in the Continuous Scale Physical Functional Performance test with PT (Miszko et al., 2003); and (d) increases in chair rise and gait speed (Henwood & Taaffe, 2005; Hruda et al.) and balance (Orr et al., 2006) concomitant with changes in muscle strength and power, but without an ST comparison group.
With the aforementioned data in mind, the primary aim of this 12-week randomized, controlled pilot study was to test the efficacy of PT by examining changes in lower extremity muscle strength and power after either a PT or ST intervention targeting the lower extremity in older adults with mild to moderate self-reported disability. We hypothesized that PT would lead to similar improvements in muscle strength but greater improvements in muscle power than ST. Secondary aims involved (a) obtaining estimates of the effects of this short-term intervention on physical function, body composition, and self-reported disability to determine variances and effect sizes for sample-size calculations for a future randomized trial and (b) assessing whether changes in strength and power were related to changes in lower extremity function, assessed using two scores from the Short Physical Performance Battery (SPPB), gait speed, and chair rises.
Methods
Design
This study was a randomized, controlled 12-week pilot study to determine the effects of PT and ST on lower extremity strength and power, lower extremity physical function, and self-reported disability in older adults with mild to moderate self-reported disability.
Participants
Older adults were recruited from local retirement communities, a database containing the names of older adults interested in clinical-trials research, and advertisements placed in the local newspaper. A brief prescreening questionnaire on demographics, health, and self-reported disability was administered to all respondents. Disability was defined as self-reported difficulty with at least one of the following: walking a quarter mile, climbing stairs, getting in and out of a car, rising from a chair, lifting and carrying groceries, getting out of bed, getting out of the bathtub, or performing shopping, cleaning, or self-care activities. The eligibility criteria for participation were being 65 years or older, community dwelling, and capable of walking unassisted or with a cane and having self-reported disability. Respondents were excluded if they were moving from the area within 1 year, under hospice care, or receiving active treatment for cancer (other than skin cancer); had shortness of breath or chest pain at rest, myocardial infarction in the past 6 months, a Mini Mental State Examination (MMSE) score < 24, upper or lower extremity amputation, unstable cardiovascular disease, severe congestive heart failure, stroke, peripheral vascular disease, coronary artery disease, valvular heart disease, major psychiatric disease, severe anemia, liver or renal disease, uncontrolled diabetes or hypertension, orthopedic impairment, blindness or deafness, or upper or lower extremity fracture within the past 6 months; consumed more than two alcoholic drinks per day; or were currently participation in regular exercise sessions or in a research study. Respondents meeting the inclusion criteria who received written approval from their primary-care physician and who passed a resistance-training safety screening (i.e., physician review of ECG obtained during a mock resistance-training session on one machine) were eligible for the study. Figure 1 provides an overview of the participant flow during the study. After baseline testing, participants were assigned to treatment using a computer-generated randomization scheme integrated into a Web-based data-entry and -management system. The protocol was approved by the Wake Forest University Health Sciences Institutional Review Board, and all participants provided written informed consent.
Figure 1.
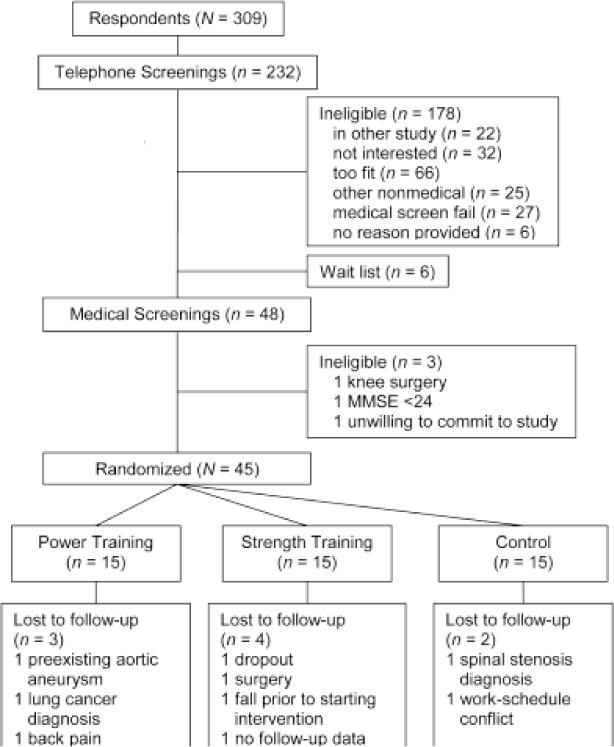
Flow of participants through the study.
Data Collection
Age, gender, and race were self-reported. Each participant was assessed at baseline for body mass, height, cognitive function (MMSE; Folstein, Folstein, & McHugh, 1975), medical diagnoses, and medications. Body-mass index was calculated using measured values of body mass from a calibrated scale and height from a stadiometer.
Muscle strength and power were assessed using pneumatic leg-press (LP) and knee-extension (KE) machines (Keiser A420, Keiser Sports Health Equipment, Fresno, CA). The LP machine was used in double-leg mode. The machines were calibrated monthly. These machines were also used for all PT and ST. The protocols used in this study were based on those described in several previous studies (Foldvari et al., 2000; Thomas, Fiatarone, & Fielding, 1996). Strength and power outcomes were assessed at baseline, at 6 weeks, and after the completion of the 12-week intervention. A brief warm-up of walking or cycling and stretching followed by several submaximal efforts on the KE and LP equipment always preceded strength testing, which was always done first because prior knowledge of the one-repetition maximum (1RM) was required for muscle-power testing. Before randomization, two testing sessions conducted 3–4 days apart were completed, with the highest value of the two being designated as the baseline measurement of KE or LP 1RM and KE or LP power.
Muscle strength of the lower extremities was assessed on the KE and LP equipment using the 1RM. Data are presented in Newtons (N). The 1RM was defined as the maximum resistance that could be moved once through the full range of motion with correct form. The movement speed was standardized; that is, all participants completed the concentric movement in 2 s, paused briefly at the midpoint, and completed the eccentric phase in 2 s. The assessor increased the resistance until the participant was no longer able to complete the movement through the full range of motion. A 1- to 2-min rest was provided between efforts, and the 1RM was typically identified in three to five efforts (Henwood & Taaffe, 2006).
Muscle power was assessed on the KE and LP equipment at six relative intensities (40%, 50%, 60%, 70%, 80%, and 90% of 1RM). Data are presented in Watts. The concentric phase of each movement was performed as fast as possible, and the eccentric phase was completed in 2 s at each randomly presented intensity, with a 1-min rest between efforts (Fielding et al., 2002). The hardware and software integrated with the KE and LP equipment calculated work and power during the concentric phase of the movement. The highest value of power over the six intensities was used as the measure of maximum power for each machine.
Lower extremity physical performance was assessed with the SPPB (Guralnik et al., 1994). Time to complete the following items was recorded: rising from a chair five times, 4-m-walk test, and up to three hierarchical balance tests (side-by-side stance, modified tandem stance, tandem stance). Time measures were converted to an ordinal scale with a range of 0 (lowest performance) to 12 (highest performance). The SPPB is a predictor of future institutionalization, hospital admission, mortality, and disability (Guralnik et al.) and improves after a physical activity intervention (The LIFE Study Investigators, 2006). Intraclass correlation coefficients range from .88 to .92 for measures made 1 week apart, with a 6-month average correlation coefficient of .78 (Ostir, Volpato, Fried, Chaves, & Guralnik, 2002). Mobility was also assessed with a lateral-mobility task (Marsh et al., 2005). In this task, participants were asked to move laterally while sequentially stepping over an 18-cm-high crossbar, ducking under a 128-cm-high crossbar, and transferring into a seat that had a raised step in front of it. This task is similar to the movement of getting into a car through the passenger-side door. Each participant was asked to complete three trials, each as quickly as possible. Times for all three trials were recorded, and the fastest time was used for analysis.
We assessed self-reported disability with a 23-item questionnaire (Ettinger et al., 1997). The questionnaire is not disease specific and asks about perceived difficulties in common activities of daily living experienced during the last month. The questionnaire has been validated by Rejeski et al. (1995) and is sensitive to a physical activity intervention (Ettinger et al.; Messier et al., 2004). The SPPB, lateral mobility, and self-reported disability were assessed at baseline, 6 weeks, and 12 weeks.
Body composition of all participants was assessed using a dual-energy X-ray absorptiometry (DXA) scanner (Delphi ATM, Hologic Inc., Bedford, MA). Whole-body and regional (left arm, right arm, left leg, and right leg) lean mass, fat mass, and bone mass were measured. Fat-free mass was calculated as the sum of lean soft-tissue mass and bone-mineral content. Percent body fat was calculated as 100 × fat mass/body weight. Appendicular skeletal muscle was calculated as the sum of lean-mass measurements for left arm, right arm, left leg, and right leg. Percent coefficients of variation are 1.15% for whole-body fat mass, 0.51% for whole-body lean mass, 2.01% for lower extremity fat mass, 1.3% for lower extremity lean mass, 2.96% for upper extremity fat mass, and 1.96% for upper extremity lean mass.
Computed tomography (CT) examinations of the lower extremity were performed on a random sample of 5 participants from each group. One participant in the ST group was lost to follow-up. The multidetector scanner (LightSpeed Plus, General Electric Medical Systems) was set at KV 120, mA 240. For thigh-muscle measurement, the technologist prescribed the start and stop locations from the AP scanogram. Scans were acquired in the helical mode, from just above the top of the femur, with a 10-mm slice collimation. The technologist used the 35-cm field of view and the standard reconstruction kernel. Analyses of CT images were performed with a GE Advantage workstation using Volume Analysis software (GE Medical Systems, Waukesha, WI). The muscle-volume measurement was composed of a slice one third of the way down the femur and two slices above and below this slice (for a total of five slices, i.e., a 40-mm width). Thigh-muscle volume appears to be more strongly related to total skeletal mass than thigh cross-sectional area (Lee, Janssen, Heymsfield, & Ross, 2004; Tracy et al., 2003). For quality assurance, daily calibration scans were obtained. This calibration is part of the daily scanner start-up routine and follows the manufacturer’s recommended procedure.
PT and ST Interventions
Training occurred at a university clinical-research facility, and all sessions were supervised by two American College of Sports Medicine–certified interventionists. Participants randomized to either PT or ST attended a one-on-one orientation session in which the details of the ST or PT intervention were explained. The PT and ST interventions for the lower extremity were conducted on Keiser pneumatic-resistance machines that allowed fast and slow movement speeds. Although the focus of the intervention and study outcomes was the lower extremity, we included several upper body ST exercises using dumbbells (chest press, biceps curl, triceps kickback) and Nautilus machines (overhead shoulder raise, seated row) to assist with participant retention and compliance. During the orientation, participants were fitted on the adjustable upper body machines and a 1RM test was done to determine the training intensity for this equipment. For the upper body, participants completed one or two sets of 10–12 repetitions at 60–70% 1RM and used the speed of movement for the lower extremity ST intervention, that is, concentric and eccentric phases completed in 2–3 s each.
After orientation, participants trained 3 days/week for 12 weeks. They trained in small groups (7 or 8 individuals) and rotated through the exercise stations. The interventionists made sure that participants adjusted the equipment appropriate to their body size and completed the resistance exercises with correct form. Participants in the PT group trained at a different time than the ST group. Each exercise session lasted ~1 hr, with a warm-up of walking or cycling for 5 min, stretching exercises of major muscle groups for 5 min, resistance training for 40 min, and a cooldown of stretching exercises for 5–10 min. The training goal for this study was for each participant to complete three sets of 8–10 repetitions on the bilateral LP and KE machines at 70% of their 1RM. In the first week the intensity was ~40–50% of 1RM, and all participants completed three sets of 8–10 repetitions. All participants progressed to 70% 1RM by the second week. The resistance on the LP and KE machines was adjusted every two weeks after repeating the 1RM testing.
Participants in the PT intervention were instructed to complete the concentric phase of the movement “as fast as possible,” pause briefly at the midpoint of the movement, and complete the eccentric phase of the movement in approximately 2–3 s. Participants in the ST intervention were instructed to complete the concentric phase of the movement in approximately 2–3 s, pause briefly at the midpoint of the movement, and complete the eccentric phase of the movement in approximately 2–3 s.
Participants in the wait-list control group were contacted each month to determine whether they had made any significant changes in their lifestyle. In addition, as an incentive to participate, they were offered the more effective of the exercise interventions after completion of the follow-up testing.
Statistical Analyses
Each participant’s longitudinal strength and power measurements were initially plotted against time to inspect for trends and potential outliers. Tests for differences in outcomes between randomized groups were performed using repeated-measures analysis of covariance, with the baseline value as a covariate. We used ANCOVA controlling for the pretest score in the analyses of the outcome measures because it typically has greater statistical power than ANOVA on follow-up values or change scores, and it controls for possible imbalances in randomization (Rausch, Maxwell, & Kelley, 2003). Models were fit that included terms for randomized group, time, the baseline value of the outcome, and a time-by-treatment interaction term. Least-squares estimates of the mean follow-up outcome values were calculated, and the percentage change from baseline to Week 12 was calculated for each group using these least-squares means. All follow-up data on participants were used in the analyses. Analyses of physical-function outcomes tested at baseline and at 6 and 12 weeks were performed using repeated-measures ANCOVA techniques as described previously for power and strength. Spearman’s correlation coefficients were used to relate 12-week changes in physical-function outcomes to 12-week changes in power and strength measurements. All analyses were conducted using SAS version 9.1 (SAS, Cary, NC), and a p value of .05 was considered significant. All reported p values are two-sided.
Results
Participant Characteristics
Descriptive characteristics of the study sample are presented in Table 1. There were no baseline differences in any of the sociodemographic, physical-function, and health-status variables between the three groups for participants who completed the study.
Table 1.
Baseline Characteristics of the Study Sample, M (SD)
| Power Training, n = 15
|
Strength Training, n = 15
|
Control Group, n = 15
|
p for completers | ||||
|---|---|---|---|---|---|---|---|
| Completers, n = 12 | Dropouts, n = 3 | Completers, n = 11 | Dropouts, n = 4 | Completers, n = 13 | Dropouts, n = 2 | ||
| Age, years | 76.8 (6.4) | 78.0 (2.6) | 74.6 (5.4) | 71.7 (5.7) | 74.4 (5.2) | 67.5 (3.5) | .54 |
| Gender, % female | 58 | 100 | 82 | 100 | 69 | 100 | .54 |
| Height, cm | 162.2 (10.0) | 159.3 (8.1) | 161.3 (13.7) | 158.5 (5.9) | 163.1 (8.7) | 158.0 (2.8) | .92 |
| Body mass, kg | 81.2 (18.3) | 78.2 (14.1) | 77.9 (17.2) | 68.6 (16.9) | 81.0 (20.3) | 79.0 (9.9) | .90 |
| Body-mass index, kg/m2 | 30.7 (5.4) | 30.8 (5.0) | 30.0 (6.0) | 27.2 (5.9) | 30.4 (7.1) | 31.6 (2.8) | .97 |
| Education, n | .88 | ||||||
| HS or <HS | 2 | 0 | 2 | 0 | 1 | 0 | |
| >HS but <college | 4 | 3 | 3 | 3 | 6 | 2 | |
| ≥college | 6 | 0 | 6 | 1 | 6 | 0 | |
| SPPB, 0–12 | 9.2 (1.9)a | 7.0 (1.7) | 9.2 (1.8)c | 8.7 (1.0) | 9.6 (1.7) | 10.5 (0.7) | .85 |
| Self-reported disability, 0–5 | 1.81 (0.58) | 2.17 (0.20) | 1.69 (0.39) | 1.74 (0.19) | 2.07 (0.62) | 1.56 (0.30) | .22 |
| Habitual gait speed, m/s | 1.00 (0.25)a | 0.79 (0.26) | 0.93 (0.35) | 0.85 (0.22) | 1.02 (0.21)d | 1.10 (0.16) | .70 |
| MMSE, 0–30 | 29.2 (1.0) | 29.0 (0.0) | 28.7 (1.2)b | 29.0 (0.8) | 28.9 (1.5) | 28.5 (2.1) | .70 |
| Knee-extension strength | 253.72 (115.5) | 181.63 (55.48) | 216.74 (87.46) | 187.37 (46.06) | 245.50 (98.39) | 225.74 (36.17) | .662 |
| Leg-press strength | 922.59 (334.40) | 748.75 (372.53) | 972.11 (353.64) | 731.14 (166.03) | 921.59 (305.63) | 786.18 (42.46) | .921 |
| Maximum knee-extension power | 148.33 (84.5) | 122.5 (21.47) | 134.57 (58.83) | 127.06 (11.25) | 161.46 (62.44) | 146.63 (38.36) | .647 |
| Maximum leg-press power | 171.06 (89.04) | 136.33 (24.70) | 214.76 (93.84) | 154.78 (14.40) | 185.47 (75.64) | 159.25 (56.04) | .492 |
| Number of medical diagnoses, n | 2.50 (1.17) | 3.33 (0.58) | 2.27 (2.20) | 1.00 (1.15) | 2.23 (1.54) | 2.00 (0.00) | .91 |
| hypertension | 8 | 2 | 7 | 2 | 8 | 2 | 1.00 |
| diabetes | 1 | 1 | 5 | 1 | 2 | 0 | .12 |
| cancer | 5 | 0 | 1 | 0 | 1 | 0 | .10 |
| respiratory disorder | 2 | 1 | 0 | 0 | 3 | 0 | .34 |
| CVD* | 3 | 2 | 2 | 0 | 4 | 0 | 1.00 |
| arthritis | 10 | 3 | 7 | 1 | 9 | 2 | .88 |
| Medications per day, n | .54 | ||||||
| 0 | 1 | 0 | 0 | 0 | 2 | 0 | |
| 1 | 1 | 0 | 4 | 1 | 2 | 0 | |
| 2 | 4 | 1 | 2 | 2 | 4 | 2 | |
| 3 | 2 | 0 | 2 | 1 | 4 | 0 | |
| ≥4 | 4 | 2 | 3 | 0 | 1 | 0 | |
Note. HS = high school; SPPB = Short Physical Performance Battery; MSSE = Mini Mental State Examination.
Sample size equals 11.
Sample size equals 10.
Sample size equals 9.
Sample size equals 12.
Recruitment, Retention, Adherence, and Adverse Events
Fifteen participants were randomized to each of the three groups. At the 12-week assessment, 12 PT, 11 ST, and 13 control-group participants completed strength or power testing, the primary outcomes. One ST and one control participant were lost to follow-up—they dropped out of the study because of time conflicts. In the remainder of cases, an unusual timing of a medical event or undiagnosed preexisting medical condition was responsible for the loss to follow-up. Participants who completed the testing did not exhibit unique characteristics compared with those who were lost to follow-up, with the exception that all participants lost to follow-up were women (Table 1). Considering all randomized participants, intervention adherence (defined as the average of participants’ attendance at the intervention sessions) was 78% in the PT group and 64% in the ST group. When we excluded the participants with attendance below 46% (PT n = 2, ST n = 2) and those who were randomized but unable to start the intervention (PT n = 1, ST n = 1), adherence was 90% in the PT group and 79% for the ST group.
There were 23 adverse events (AEs; power = 9, strength = 8, control = 6). The most prevalent AEs were falls that did not result in a fracture (PT n = 3, ST n = 4, control n = 3) and temporary localized joint pain (PT n = 3, ST n = 2, control n = 1). There were seven serious adverse events (SAEs), two in the PT group (aortic aneurism, and lung cancer), both of which were preexisting but undiagnosed before randomization; four in the ST group (surgery, preexisting brain tumor, hiatal hernia, severe fall resulting in hospitalization after randomization but before the start of intervention); and one in the C group (hospitalization as a result of exacerbation of MS condition). A data safety and monitoring board reviewed all AEs and SAEs and did not attribute any of them to the interventions.
Muscle Strength and Power
Intraclass correlations for the test–retest (over a maximum 4-day span before randomization) of the strength and power primary outcome measures ranged from .83 to .89. In Table 2 and Figures 2 and 3, we present the 12-week least-squares means obtained from analyses of KE 1RM, LP 1RM, maximum KE power, and maximum LP power. Pairwise comparisons between intervention groups are provided in Table 3. We observed similar increases in KE and LP 1RM in the PT and ST groups compared with the control group. For both these outcomes, there were no significant differences between the average follow-up values observed for PT and ST groups (p = .825 for KE 1RM, p = .635 for LP 1RM). For maximum KE and LP power, PT produced significantly higher maximum power than the control group. The maximum KE and LP power percentage change from the baseline means was approximately twofold greater in PT than in ST, although the change in KE power was not significant (p = .097; Tables 2 and 3). However, unlike PT, ST did not result in a significant difference for these outcomes relative to the control group (maximum KE power p = .177, maximum LP power p = .401). We also conducted an analysis of the strength and power data, normalizing for body mass. Of the 12 comparisons, two changed: For the strength versus control comparison on the KE strength outcome, the observed effect size changed from 50.9% on the nonnormalized data to 48.9% on the normalized data, resulting in the p value changing from the reported .049 to .076 and for the power-versus-strength comparison on the maximum-knee-extension-power outcome, and the observed effect size changed from 69.4% on the nonnormalized data to 80.9% on the normalized data, resulting in the p value changing from the reported .097 to .031.
Table 2.
Estimated Mean (SE) and Percent Change From Baseline at Week 12 Follow-Up
| Group | Knee-Extension Strength, N
|
Leg-Press Strength, N
|
Maximum Knee-Extension Power, W
|
Maximum Leg-Press Power, W
|
||||
|---|---|---|---|---|---|---|---|---|
| Mean at Week 12 (SE) |
Change from baseline | Mean at Week 12 (SE) |
Change from baseline | Mean at Week 12 (SE) |
Change from baseline | Mean at Week 12 (SE) |
Change from baseline | |
| Power | 287.7 (15.9) | 19.9% | 1,155.5 (53.3) | 22.3% | 221.3 (16.9) | 34.4% | 308.7 (16.0) | 41.4% |
| Strength | 282.5 (17.0) | 18.5% | 1,193.4 (58.4) | 24.7% | 178.1 (18.3) | 18.5% | 231.5 (17.7) | 21.8% |
| Control | 235.3 (15.6) | 2.0% | 981.9 (52.0) | 8.5% | 143.6 (16.9) | −1.0% | 211.4 (15.7) | 14.4% |
Note. Estimated means obtained as least-squares mean estimates from ANCOVA containing baseline outcome, intervention, time, and Time × Intervention effects.
Figure 2.
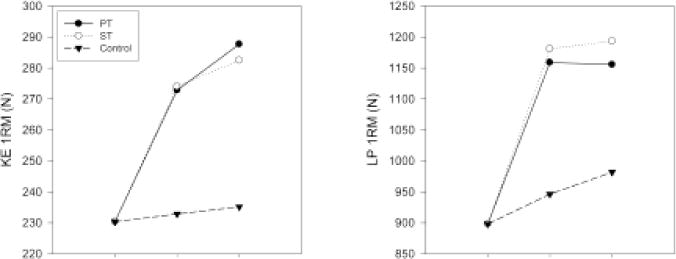
Changes in knee-extension (KE) and leg-press (LP) strength assessed using one-repetition maximum (1RM). Data are least-squares means in Newtons (N). PT = power training; ST = strength training.
Figure 3.
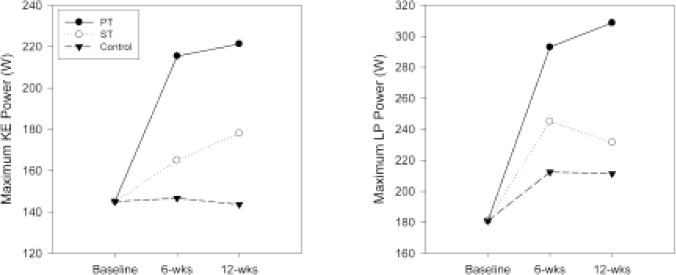
Changes in maximum knee-extensor (KE) and leg-press (LP) power. Data are least-squares means in Watts (W). PT = power training; ST = strength training.
Table 3.
Estimated Mean Differences at Week 12 Follow-Up
| Group
|
Knee-Extension Strength, N
|
Leg-Press Strength, N
|
Maximum Knee-Extension Power, W
|
Maximum Leg-Press Power, W
|
|||||
|---|---|---|---|---|---|---|---|---|---|
| 1 | 2 | Mean difference (ES) |
p | Mean difference (ES) |
p | Mean difference (ES) |
p | Mean difference (ES) |
p |
| Power | Strength | 5.19 (5.6%) | .825 | −37.87 (12.2%) | .635 | 43.2 (69.4%) | .097 | 77.2 (98.8%) | .003 |
| Power | Control | 52.51 (56.6%) | .024 | 173.63 (56.2%) | .026 | 77.7 (124.8%) | .003 | 97.3 (124.5%) | <.001 |
| Strength | Control | 47.32 (50.9%) | .049 | 211.50 (68.4%) | .011 | 34.4 (55.3%) | .177 | 20.1 (25.7%) | .401 |
Note. Estimated mean difference obtained as differences in least-squares mean estimates between Group 1 and Group 2 from ANCOVA containing baseline outcome, intervention, time, and Time × Intervention effects. Effect sizes estimated as mean difference divided by baseline standard deviation, expressed as a percentage.
Physical Function
Physical-function measurements are presented in Table 4. Hypothesis tests for comparing means between groups were not performed on these measurements because this study had low power to detect meaningful differences between groups for them. However, results from repeated-measures ANCOVA were used to estimate the pooled SD and least-squares means at 12 weeks for the physical-function variables (Table 5). To detect a 0.5 SD with 80% power for any of these endpoints, using a two-sided .05 significance level, would require 64 observations per group. For 90% power, 86 observations per group would be required.
Table 4.
Means at Baseline and Follow-Up for Physical Function, Self-Reported Disability, and Body Composition, n (SD)
| Power Group Observed Means
|
Strength Group Observed Means
|
Control Group Observed Means
|
||||
|---|---|---|---|---|---|---|
| Baseline | 12 weeks | Baseline | 12 weeks | Baseline | 12 weeks | |
| SPPB, 0–12 | 8.7 (14/2.0) |
9.6 (11/1.6) |
9.1 (13/1.6) |
9.4 (10/1.0) |
9.7 (14/1.6) |
9.4 (11/1.3) |
| Lateral mobility, s | 8.06 (14/3.07) |
5.92 (11/1.32) |
7.76 (14/3.15) |
7.39 (10/4.10) |
5.46 (12/1.28) |
5.30 (10/1.31) |
| Self-reported disability, 0–5 | 1.88 (15/0.54) |
1.59 (12/0.49) |
1.70 (15/0.34) |
1.70 (12/0.39) |
2.00 (15/0.61) |
1.83 (12/0.66) |
| Dual-energy X-ray absorptiometry | ||||||
| total body mass, kg | 79.8 (15/16.9) |
79.1 (12/17.8) |
77.0 (15/16.6) |
78.4 (12/17.0) |
80.7 (15/19.1) |
81.4 (12/21.5) |
| fat mass, kg | 29.2 (15/7.4) |
27.8 (12/7.2) |
29.8 (15/6.9) |
29.8 (12/7.9) |
31.7 (15/9.8) |
31.8 (12/11.0) |
| lean body mass, kg | 48.5 (15/12.9) |
49.1 (12/14.1) |
45.2 (15/10.7) |
46.5 (12/10.2) |
46.9 (15/11.6) |
47.6 (12/13.1) |
| appendicular skeletal-muscle mass, kg | 20.2 (15/6.3) |
20.8 (12/6.8) |
19.1 (15/4.7) |
19.8 (12/4.4) |
19.9 (15/5.0) |
20.1 (12/5.5) |
Note. SPPB = Short Physical Performance Battery.
Table 5.
Estimated Least-Squares Means at Follow-Up for Physical Function and Self-Reported Disability
| Estimated Least-Squares Means at 12 Weeks
|
|||||
|---|---|---|---|---|---|
| Measurement | Baseline M ± SD | Power | Strength | Control | Pooled SD at 12 weeksa |
| SPPB (0–12)b | 9.17 ± 1.77 | 9.40 | 9.51 | 9.26 | 0.88 |
| Lateral mobility (s)b | 7.18 ± 2.87 | 5.80 | 6.44 | 6.50 | 1.48 |
| Self-reported disability (0–5)b | 1.86 ± 0.51 | 1.63 | 1.83 | 1.68 | 0.39 |
| Dual-energy X-ray absorptiometryc | |||||
| total body mass (kg) | 80.2 ± 17.7 | 80.8 | 81.3 | 81.0 | 1.5 |
| fat mass (kg) | 30.9 ± 7.7 | 30.4 | 30.5 | 30.6 | 1.2 |
| lean body mass (kg) | 47.3 ± 11.9 | 48.2 | 48.7 | 48.4 | 1.0 |
| appendicular skeletal muscle mass (kg) | 19.9 ± 5.5 | 20.6 | 20.7 | 20.4 | 0.6 |
| CT midthigh muscle volume (cm3) | 1,008 ± 235 | 1,045 | 1,028 | 1,008 | 33.21 |
Note. SPPB = Short Physical Performance Battery
SD obtained from model adjusting for baseline value of outcome as covariate (e.g., square root of the mean squared error).
Least-squares means estimated from a repeated-measures model containing the baseline measurement, intervention effect, time effect, and Intervention × Time effects.
Least-squares means estimated from an analysis of covariance model containing the baseline measurement and intervention effect. Dual-energy X-ray absorptiometry and CT were only measured at baseline and Week 12.
Body Composition
Table 4 contains body-composition measurements obtained via DXA. Table 5 contains the estimated 12-week least-squares means for the DXA and CT measurements. No changes were observed between the groups, although the trends in the CT data tend to support PT as a way to increase muscle mass. The largest difference between any two group means is approximately 0.5 SD for the comparison of the strength and control conditions for the appendicular lean-mass endpoint. To have 80% power to detect this difference in future studies would require at least 64 observations per group.
To examine the association between changes in strength and power and changes in physical function, we selected the 4-m self-paced walk test and chair rises, as well as a composite measure of physical function—the SPPB score. We examined correlations between 12-week change in the four power and strength measures and changes in these physical-function measures, that is, follow-up minus baseline. The change in maximum KE power and KE 1RM were both significantly correlated with the change in time to complete the chair-stand task, rs = −.44, p = .014 for maximum KE power and rs = −.414, p = .021 for KE 1RM. There were no significant correlations between change in 4-m walk or SPPB score and change in any of the four strength and power measures. With a total of 36 observations at the 12-week follow-up, this study had at least 80% power to detect correlations of .45 or larger.
Discussion
The primary aim of this study was to examine changes in lower extremity muscle strength and power after a 12-week progressive resistance program of either PT or ST in older adults with mild to moderate self-reported disability. Consistent with our study hypothesis, participants in the PT and ST groups exhibited similar improvements in muscle strength (18.5–24.7% increase). However, the PT group experienced significantly greater improvements in LP muscle power than the ST group. Given that both groups received the same exercise prescription with the exception of the speed of movement, PT may be a more time-efficient method of resistance training for older adults to ameliorate the effects of sarcopenia. The protocols for ST and PT used in this study resulted in a marked difference in muscle power. This is critical to future trials focused on the effect of changes in muscle power on function in older adults.
A strength of the current study is that it included an ST arm, which might be considered a usual-care control based on current physical activity guidelines for older adults (Nelson et al., 2007), as well as a wait-list control group. This design provided unique insight because it showed that the increases in strength and power in the PT group were always significantly different from the control group, whereas the ST group differed from the control in strength but not in power. This study also included men and women, directly compared PT with ST, and used a randomized controlled design. These data, when combined with the observation that PT was feasible and safe, suggest that PT may be a more effective mode of resistance training for increasing strength and power in older adults with mild to moderate self-reported disability than ST. We have also reported that the PT group reported significantly more change in self-efficacy, satisfaction with physical function, and the Satisfaction with Life Scale than the control group, whereas the ST group reported greater change than the control group only in self-efficacy (Katula, Rejeski, & Marsh, 2008).
The magnitude of improvement in strength and power is consistent with the work of Fielding et al. (2002), who compared the effects of 16 weeks of PT and ST on strength and power in women with self-reported disability. This is important because it shows that this training protocol is very effective in this population of older adults. Several studies have reported no or modest improvements in power after high-velocity resistance training, potentially related to the intervention protocol and/or method used to assess muscle power. Earles et al. (2001) reported a modest 22% increase in LP power after a 12-week program of PT. They used a conservative training protocol. That is, they did not add resistance and the speed of the contractions was “comfortable” during the first 2 weeks. In addition, participants were not trained on the LP until the third week. By the end of the intervention, the PT group performed three sets of 8–10 repetitions at 94% 1RM on the LP. However, only 12% of the work was completed on this machine; the remaining work was done with weight belts using chair rises or plantar-flexion movements and step-up boxes. Of note, the LP 1RM strength outcome in the PT group did not differ from results in a walking group, whereas the PT group increased power and the walking group decreased power. This latter pattern in the data led to a significant between-groups difference in power. Bean et al. (2002) also used a weighted-vest approach during stair climbing in their intervention compared with a walking program. They reported an increase of 17% in LP peak power but no significant improvement in LP strength. Furthermore, there were no significant between-groups changes in KE power, but there was a 9.5% improvement in leg-extensor strength. The walking program did not lead to significant changes in LP or KE power or strength. There was a significant difference between the weighted-vest stair climb and the walking group in LP power. Clearly, completing daily tasks (stair climbing, chair rises) with added resistance is appealing because of its ecological validity. However, these interventions are not as effective at increasing strength and power as resistancetraining machines. In contrast to these two studies, Mizko et al. (2003) did not observe an increase in peak anaerobic power after PT, which, as the authors point out, may have been related to the use of the Wingate cycle test of power, a very different testing protocol than LP. Finally, de Vos et al. (2005) reported increases in LP power and strength of 9–14% and ~16%, respectively, and increases in KE power and strength of 14–18% and 16–27%, respectively, after PT at three different training loads (20%, 50%, and 80% 1RM). These modest improvements may be related to the higher function of the participants, that is, less room for improvement and a reduced training load because the participants trained 2 days/week.
Numerous resistance-training protocols have been developed to enhance various aspects of muscle function (Kraemer et al., 2002). However, older adults are less likely to engage in vigorous physical activity or resistance training than aerobic activity (U.S. Department of Health and Human Services, 1996). The feasibility of implementing resistance-training programs in community-based interventions or translating them to older adults exercising unsupervised is questionable given the considerable complexity of the various prescriptions. Two recent studies published on the same cohort showed that muscle power improved similarly in three groups of healthy older adults who trained 8–12 weeks, twice weekly, using three sets of eight repetitions at loads of either low, medium, or high intensity (20%, 50%, or 80% of 1RM). A balance summary score improved in all groups but more so in the group that trained at 20% of 1RM (de Vos et al., 2005; Orr et al., 2006). It is difficult to reconcile how a fourfold increase in intensity resulted in the same improvements in power (14%) or why the lowest intensity training produced the largest improvements in balance. As the authors noted, these data create a challenge for exercise prescription. We have shown that a very simple modification (concentric phase “as fast as possible”) to a typical ST protocol (three sets, 8–10 repetitions, 70% 1RM) can produce substantial improvements in lower extremity power. This is important because effective manipulation of muscle power is critical if investigators are to evaluate its relative importance in physical function and fall prevention in older adults.
It is clear that improvements in strength and power can occur rapidly in older adults. We observed that strength and power increased dramatically from baseline to midpoint testing and then increased little from midpoint to follow-up. Fielding et al. (2002) observed a similar response whereby strength and power increased dramatically at 4 weeks and then more gradually over the remainder of their intervention. It is well known that resistance training changes muscle activation and recruitment—neurologic factors—as well as muscle morphology and proteins (Ferri et al., 2003; Hakkinen et al., 2001; Hakkinen et al., 1998; Harridge, Kryger, & Stensgaard, 1999; Komi, 1986; Narici, Roi, Landoni, Minetti, & Cerretelli, 1989; Woolstenhulme, Conlee, Drummond, Stites, & Parcell, 2006; see Folland & Williams, 2007 for a recent review) and that the time course of change differs for these two factors (Moritani & deVries, 1979, 1980; Sale, 1988), with changes in neurologic factors occurring rapidly and leading to increases in strength before any hypertrophy or morphologic changes in the muscle. In addition, Keen, Yue, and Enoka (1994) reported that for young and older participants, after 12 weeks of strength training the average increase in muscle volume was ~7% compared with an increase in isometric strength of 39%. This suggests that, in the short term, muscle hypertrophy is relatively less important to improving strength than neural adaptations. Although the determinants of change in strength and power were not the focus of this study, it is reasonable to speculate that the rapid increase in strength and power we observed at Week 6 is related more to neurologic factors, and the gradual increase (not significant) from Week 6 to 12 is related to some combination of neurologic and hypertrophic factors (Moritani & deVries, 1979; Phillips, 2000).
We did not observe any significant differences between the groups in appendicular lean mass assessed via DXA. Given the increase in strength and power in the PT group, this would indicate an increase in muscle quality and muscle-power quality, that is, strength or power per unit of muscle (Hunter, McCarthy, & Bamman, 2004; Tracy et al., 1999). As discussed previously, it also underscores the importance of neurologic factors compared with hypertrophy in short-term strength gains in older adults. We would expect to see increases in lean tissue with a longer duration of resistance exercise. For example, Henwood et al. (2008) did observe an increase of 1.2 and 1.4 kg of lean tissue after 24 weeks of PT and ST, respectively. The CT data showing a trend for an increase in thigh-muscle volume after resistance training suggest that muscle hypertrophy did occur. However, because we only obtained CT data on a subsample, and others have shown that DXA and CT measurements are closely related (Levine et al., 2000; Visser, Fuerst, Lang, Salamone, & Harris, 1999), it seems reasonable to conclude that no significant muscle hypertrophy occurred over the short duration of the study.
In general, the PT intervention led to favorable but modest trends toward improvements in physical function and self-reported disability. This is consistent with previous work that also reported modest changes in physical function after short-duration PT resistance training (Earles et al., 2001; Miszko et al., 2003; Sayers et al., 2003; Skelton, Young, Greig, & Malbut, 1995). The failure of these differences to reach conventional levels of statistical significance likely occurred because the study was not powered to test hypotheses on the secondary outcomes. In addition, the short duration of the study likely precluded us from observing larger changes in physical function in spite of the large increases in muscle power in the PT group, or declines in physical function in the control group. However, the changes in SPPB scores of 0.84 in PT, 0.32 in ST, and −0.35 in control in only 12 weeks support further investigation of the potential added benefits of PT to improve physical function. These data are encouraging, especially in light of recent work suggesting that changes of 0.5 points on the SPPB are clinically meaningful (Perera, Mody, Woodman, & Studenski, 2006).
The analysis of correlations between the changes in strength and power and changes in physical function over the 12-week intervention was completed with the assumption that changes in performance of tasks that required maximal effort would be more strongly associated with changes in strength and power (Salem, Wang, Young, Marion, & Greendale, 2000). The data supported this idea because the change in the time to complete five chair rises, a timed test of maximal performance, was related to the change in strength or power of the KE muscles. The change in 4-m-walk time, a usual-pace test, and the SPPB, a composite measure that includes the 4-m walk and five chair rises, was not related to changes in strength or power. These results should be viewed in the context of the small sample size and short duration of the study.
This study had several limitations. First, we tested strength and power on the same machines that were used in the intervention. A stronger test of the effectiveness of PT and ST would be to use a different assessment tool for strength and power. However, the fact that the observed changes mirrored those of the functional test (chair stands) that is most clearly power related suggests that the difference in the training effect is genuine. Recently, Callahan, Phillips, Carabello, Frontera, and Fielding (2007) proposed a new valid and reliable method of testing muscle power using Keiser machines. They reported that this new method results in higher values of muscle power than the methods used in the current study and that of Fielding et al. (2002). Because the new method is highly correlated with the method we used, we would hypothesize that our data interpretation would not have changed had we used this new assessment method. It may be the case that the new method is more sensitive to change after a resistance-training intervention, but Callahan et al. did not report sensitivity-to-change information on their new measure, so this remains to be determined. The 12-week intervention limited the time available for any changes in strength and power to be translated into changes in physical function. This limited our ability to address whether PT leads to greater improvements in physical function than does ST. As with any study of this type, selection bias may affect the generalizability of the results. Excluding older adults with significant chronic-disease burden and the poorest health may have resulted in the intervention appearing safer or more feasible. However, our exclusion criteria may have reduced the impact of the intervention on the change in the SPPB, because more-frail individuals may have more potential to improve on measures of physical function. Finally, the loss to follow-up and the number of AEs and SAEs in this short-term pilot study are an abiding source of concern. Two participants dropped out of the study because of time conflicts rather than lack of enjoyment or difficulty with the intervention. AEs are a common and expected feature of trials of older functionally impaired adults. The events arising in this study were reviewed by an independent board that did not attribute any AEs or SAEs to the ST or PT intervention.
In conclusion, both PT and ST groups showed significant improvements in KE and LP 1RM compared with the control group, and maximum KE and LP power increased approximately twice as much in the PT group as in the ST group. This pilot study demonstrated that a simple modification of a standard ST protocol, that is, to complete the concentric phase of the movement “as fast as possible,” is a feasible, safe, and effective intervention to increase strength and power of the lower extremity in older adults with mild to moderate self-reported disability.
Acknowledgments
This study was supported by the Wake Forest University Claude D. Pepper Older Americans Independence Center (NIA grant P30-AG-021332-01). Additional support was provided by the Wake Forest University General Clinical Research Center (Grant M01-RR07122).
Footnotes
The authors do not have any financial interest or conflict of interest to disclose.
Dr. Marsh participated in study concept, design of the study, analysis and interpretation of data, and preparation of the manuscript. Dr. Miller participated in the design of the study, interpretation of the data, and preparation of the manuscript. Dr. Rejeski participated in interpretation of the data and preparation of the manuscript. Stacy Hutton participated in the conduct of the intervention. Dr. Kritchevsky contributed to data interpretation and preparation of the manuscript.
The sponsors did not have any role in the design, methods, participant recruitment, data collection, analysis, or preparation of this paper.
Contributor Information
Anthony P. Marsh, Dept. of Health and Exercise Science, Wake Forest University, Winston-Salem, NC 27109-7868
Michael E. Miller, Dept. of Biostatistical Sciences, Wake Forest University, Winston-Salem, NC 27109-7868
W. Jack Rejeski, Dept. of Health and Exercise Science, Wake Forest University, Winston-Salem, NC 27109-7868.
Stacy L. Hutton, Dept. of Health and Exercise Science, Wake Forest University, Winston-Salem, NC 27109-7868
Stephen B. Kritchevsky, Dept. of Internal Medicine, Wake Forest University, Winston-Salem, NC 27109-7868
References
- Aniansson A, Hedberg M, Henning GB, Grimby G. Muscle morphology, enzymatic activity, and muscle strength in elderly men: A follow-up study. Muscle & Nerve. 1986;9:585–591. doi: 10.1002/mus.880090702. [DOI] [PubMed] [Google Scholar]
- Bassey EJ. Longitudinal changes in selected physical capabilities: Muscle strength, flexibility and body size. Age and Ageing. 1998;27(Suppl. 3):12–16. doi: 10.1093/ageing/27.suppl_3.12. [DOI] [PubMed] [Google Scholar]
- Bassey EJ, Fiatarone MA, O’Neill EF, Kelly M, Evans WJ, Lipsitz LA. Leg extensor power and functional performance in very old men and women. Clinical Science (London, England : 1979) 1992;82:321–327. doi: 10.1042/cs0820321. [DOI] [PubMed] [Google Scholar]
- Bassey EJ, Harries UJ. Normal values for handgrip strength in 920 men and women aged over 65 years, and longitudinal changes over 4 years in 620 survivors. Clinical Science (London, England : 1979) 1993;84:331–337. doi: 10.1042/cs0840331. [DOI] [PubMed] [Google Scholar]
- Bean J, Herman S, Kiely DK, Callahan D, Mizer K, Frontera WR, et al. Weighted stair climbing in mobility-limited older people: A pilot study. Journal of the American Geriatrics Society. 2002;50:663–670. doi: 10.1046/j.1532-5415.2002.50160.x. [DOI] [PubMed] [Google Scholar]
- Bean JF, Herman S, Kiely DK, Frey IC, Leveille SG, Fielding RA, et al. Increased Velocity Exercise Specific to Task (InVEST) training: A pilot study exploring effects on leg power, balance, and mobility in community-dwelling older women. Journal of the American Geriatrics Society. 2004;52:799–804. doi: 10.1111/j.1532-5415.2004.52222.x. [DOI] [PubMed] [Google Scholar]
- Bean JF, Leveille SG, Kiely DK, Bandinelli S, Guralnik JM, Ferrucci L. A comparison of leg power and leg strength within the InCHIANTI study: Which influences mobility more? The Journals of Gerontology. Series A, Biological Sciences and Medical Sciences. 2003;58:728–733. doi: 10.1093/gerona/58.8.m728. [DOI] [PubMed] [Google Scholar]
- Bottaro M, Machado SN, Nogueira W, Scales R, Veloso J. Effect of high versus low-velocity resistance training on muscular fitness and functional performance in older men. European Journal of Applied Physiology. 2007;99:257–264. doi: 10.1007/s00421-006-0343-1. [DOI] [PubMed] [Google Scholar]
- Brooks SV, Faulkner JA. Skeletal muscle weakness in old age: Underlying mechanisms. Medicine and Science in Sports and Exercise. 1994;26:432–439. [PubMed] [Google Scholar]
- Brooks SV, Faulkner JA, McCubbrey DA. Power outputs of slow and fast skeletal muscles of mice. Journal of Applied Physiology. 1990;68:1282–1285. doi: 10.1152/jappl.1990.68.3.1282. [DOI] [PubMed] [Google Scholar]
- Callahan D, Phillips E, Carabello R, Frontera WR, Fielding RA. Assessment of lower extremity muscle power in functionally-limited elders. Aging Clinical and Experimental Research. 2007;19:194–199. doi: 10.1007/BF03324689. [DOI] [PubMed] [Google Scholar]
- Coggan AR, Spina RJ, King DS, Rogers MA, Brown M, Nemeth PM, et al. Histochemical and enzymatic comparison of the gastrocnemius muscle of young and elderly men and women. Journal of Gerontology. 1992;47:B71–B76. doi: 10.1093/geronj/47.3.b71. [DOI] [PubMed] [Google Scholar]
- D’Antona G, Pellegrino MA, Adami R, Rossi R, Carlizzi CN, Canepari M, et al. The effect of ageing and immobilization on structure and function of human skeletal muscle fibres. The Journal of Physiology. 2003;552:499–511. doi: 10.1113/jphysiol.2003.046276. [DOI] [PMC free article] [PubMed] [Google Scholar]
- D’Antona G, Pellegrino MA, Carlizzi CN, Bottinelli R. Deterioration of contractile properties of muscle fibres in elderly subjects is modulated by the level of physical activity. European Journal of Applied Physiology. 2007;100:603–611. doi: 10.1007/s00421-007-0402-2. [DOI] [PubMed] [Google Scholar]
- de Vos NJ, Singh NA, Ross DA, Stavrinos TM, Orr R, Fiatarone Singh MA. Optimal load for increasing muscle power during explosive resistance training in older adults. The Journals of Gerontology. Series A, Biological Sciences and Medical Sciences. 2005;60:638–647. doi: 10.1093/gerona/60.5.638. [DOI] [PubMed] [Google Scholar]
- Delbono O, Renganathan M, Messi ML. Excitation-Ca2+ release-contraction coupling in single aged human skeletal muscle fiber. Muscle & Nerve. 1997;5:S88–S92. doi: 10.1002/(sici)1097-4598(1997)5+<88::aid-mus21>3.0.co;2-u. Supplement. [DOI] [PubMed] [Google Scholar]
- DiPietro L. Physical activity in aging: Changes in patterns and their relationship to health and function. The Journals of Gerontology. Series A, Biological Sciences and Medical Sciences. 2001;56(Spec No 2):13–22. doi: 10.1093/gerona/56.suppl_2.13. [DOI] [PubMed] [Google Scholar]
- Doherty TJ, Vandervoort AA, Brown WF. Effects of ageing on the motor unit: A brief review. Canadian Journal of Applied Physiology. 1993;18:331–358. doi: 10.1139/h93-029. [DOI] [PubMed] [Google Scholar]
- Earles DR, Judge JO, Gunnarsson OT. Velocity training induces power-specific adaptations in highly functioning older adults. Archives of Physical Medicine and Rehabilitation. 2001;82:872–878. doi: 10.1053/apmr.2001.23838. [DOI] [PubMed] [Google Scholar]
- Ettinger WH, Jr, Burns R, Messier SP, Applegate W, Rejeski WJ, Morgan T, et al. A randomized trial comparing aerobic exercise and resistance exercise with a health education program in older adults with knee osteoarthritis. The Fitness Arthritis and Seniors Trial (FAST) Journal of the American Medical Association. 1997;277:25–31. [PubMed] [Google Scholar]
- Evans WJ, Campbell WW. Sarcopenia and age-related changes in body composition and functional capacity. The Journal of Nutrition. 1993;123:465–468. doi: 10.1093/jn/123.suppl_2.465. [DOI] [PubMed] [Google Scholar]
- Ferri A, Scaglioni G, Pousson M, Capodaglio P, Van Hoecke J, Narici MV. Strength and power changes of the human plantar flexors and knee extensors in response to resistance training in old age. Acta Physiologica Scandinavica. 2003;177:69–78. doi: 10.1046/j.1365-201X.2003.01050.x. [DOI] [PubMed] [Google Scholar]
- Fielding RA, LeBrasseur NK, Cuoco A, Bean J, Mizer K, Fiatarone Singh MA. High-velocity resistance training increases skeletal muscle peak power in older women. Journal of the American Geriatrics Society. 2002;50:655–662. doi: 10.1046/j.1532-5415.2002.50159.x. [DOI] [PubMed] [Google Scholar]
- Foldvari M, Clark M, Laviolette LC, Bernstein MA, Kaliton D, Castaneda C, et al. Association of muscle power with functional status in community-dwelling elderly women. The Journals of Gerontology. Series A, Biological Sciences and Medical Sciences. 2000;55:M192–M199. doi: 10.1093/gerona/55.4.m192. [DOI] [PubMed] [Google Scholar]
- Folland JP, Williams AG. The adaptations to strength training: Morphological and neurological contributions to increased strength. Sports Medicine (Auckland, NZ) 2007;37:145–168. doi: 10.2165/00007256-200737020-00004. [DOI] [PubMed] [Google Scholar]
- Folstein MF, Folstein SE, McHugh PR. “Mini-Mental State.” A practical method for grading the cognitive state of patients for the clinician. Journal of Psychiatric Research. 1975;12:189–198. doi: 10.1016/0022-3956(75)90026-6. [DOI] [PubMed] [Google Scholar]
- Frontera WR, Hughes VA, Fielding RA, Fiatarone MA, Evans WJ, Roubenoff R. Aging of skeletal muscle: A 12-yr longitudinal study. Journal of Applied Physiology. 2000a;88:1321–1326. doi: 10.1152/jappl.2000.88.4.1321. [DOI] [PubMed] [Google Scholar]
- Frontera WR, Hughes VA, Lutz KJ, Evans WJ. A cross-sectional study of muscle strength and mass in 45- to 78-yr-old men and women. Journal of Applied Physiology. 1991;71:644–650. doi: 10.1152/jappl.1991.71.2.644. [DOI] [PubMed] [Google Scholar]
- Frontera WR, Suh D, Krivickas LS, Hughes VA, Goldstein R, Roubenoff R. Skeletal muscle fiber quality in older men and women. American Journal of Physiology. Cell Physiology. 2000b;279:C611–C618. doi: 10.1152/ajpcell.2000.279.3.C611. [DOI] [PubMed] [Google Scholar]
- Guralnik JM, Simonsick EM, Ferrucci L, Glynn RJ, Berkman LF, Blazer DG, et al. A short physical performance battery assessing lower extremity function: Association with self-reported disability and prediction of mortality and nursing home admission. Journal of Gerontology. 1994;49:M85–M94. doi: 10.1093/geronj/49.2.m85. [DOI] [PubMed] [Google Scholar]
- Hakkinen K, Kraemer WJ, Newton RU, Alen M. Changes in electromyographic activity, muscle fibre and force production characteristics during heavy resistance/power strength training in middle-aged and older men and women. Acta Physiologica Scandinavica. 2001;171:51–62. doi: 10.1046/j.1365-201X.2001.00781.x. [DOI] [PubMed] [Google Scholar]
- Hakkinen K, Newton RU, Gordon SE, McCormick M, Volek JS, Nindl BC, et al. Changes in muscle morphology, electromyographic activity, and force production characteristics during progressive strength training in young and older men. The Journals of Gerontology. Series A, Biological Sciences and Medical Sciences. 1998;53:B415–B423. doi: 10.1093/gerona/53a.6.b415. [DOI] [PubMed] [Google Scholar]
- Harridge SD, Kryger A, Stensgaard A. Knee extensor strength, activation, and size in very elderly people following strength training. Muscle & Nerve. 1999;22:831–839. doi: 10.1002/(sici)1097-4598(199907)22:7<831::aid-mus4>3.0.co;2-3. [DOI] [PubMed] [Google Scholar]
- Henwood TR, Riek S, Taaffe DR. Strength versus muscle power-specific resistance training in community-dwelling older adults. The Journals of Gerontology. Series A, Biological Sciences and Medical Sciences. 2008;63:83–91. doi: 10.1093/gerona/63.1.83. [DOI] [PubMed] [Google Scholar]
- Henwood TR, Taaffe DR. Improved physical performance in older adults undertaking a short-term programme of high-velocity resistance training. Gerontology. 2005;51:108–115. doi: 10.1159/000082195. [DOI] [PubMed] [Google Scholar]
- Henwood TR, Taaffe DR. Short-term resistance training and the older adult: The effect of varied programmes for the enhancement of muscle strength and functional performance. Clinical Physiology and Functional Imaging. 2006;26:305–313. doi: 10.1111/j.1475-097X.2006.00695.x. [DOI] [PubMed] [Google Scholar]
- Hruda KV, Hicks AL, McCartney N. Training for muscle power in older adults: Effects on functional abilities. Canadian Journal of Applied Physiology. 2003;28:178–189. doi: 10.1139/h03-014. [DOI] [PubMed] [Google Scholar]
- Hughes VA, Frontera WR, Wood M, Evans WJ, Dallal GE, Roubenoff R, et al. Longitudinal muscle strength changes in older adults: Influence of muscle mass, physical activity, and health. The Journals of Gerontology. Series A, Biological Sciences and Medical Sciences. 2001;56:B209–B217. doi: 10.1093/gerona/56.5.b209. [DOI] [PubMed] [Google Scholar]
- Hunter GR, McCarthy JP, Bamman MM. Effects of resistance training on older adults. Sports Medicine (Auckland, NZ) 2004;34:329–348. doi: 10.2165/00007256-200434050-00005. [DOI] [PubMed] [Google Scholar]
- Izquierdo M, Aguado X, Gonzalez R, Lopez JL, Hakkinen K. Maximal and explosive force production capacity and balance performance in men of different ages. European Journal of Applied Physiology. 1999;79:260–267. doi: 10.1007/s004210050504. [DOI] [PubMed] [Google Scholar]
- Izquierdo M, Hakkinen K, Ibanez J, Garrues M, Anton A, Zuniga A, et al. Effects of strength training on muscle power and serum hormones in middle-aged and older men. Journal of Applied Physiology. 2001;90:1497–1507. doi: 10.1152/jappl.2001.90.4.1497. [DOI] [PubMed] [Google Scholar]
- Kallman DA, Plato CC, Tobin JD. The role of muscle loss in the age-related decline of grip strength: Cross-sectional and longitudinal perspectives. Journal of Gerontology. 1990;45:M82–M88. doi: 10.1093/geronj/45.3.m82. [DOI] [PubMed] [Google Scholar]
- Katula JA, Rejeski WJ, Marsh AP. Enhancing quality of life in older adults: A comparison of muscular strength and power training. Health and Quality of Life Outcomes. 2008;6:45. doi: 10.1186/1477-7525-6-45. [DOI] [PMC free article] [PubMed] [Google Scholar]
- Keen DA, Yue GH, Enoka RM. Training-related enhancement in the control of motor output in elderly humans. Journal of Applied Physiology. 1994;77:2648–2658. doi: 10.1152/jappl.1994.77.6.2648. [DOI] [PubMed] [Google Scholar]
- Komi PV. Training of muscle strength and power: interaction of neuromotoric, hypertrophic, and mechanical factors. International Journal of Sports Medicine. 1986;7(Suppl. 1):10–15. doi: 10.1055/s-2008-1025796. [DOI] [PubMed] [Google Scholar]
- Kraemer WJ, Adams K, Cafarelli E, Dudley GA, Dooly C, Feigenbaum MS, et al. American College of Sports Medicine position stand. Progression models in resistance training for healthy adults. Medicine and Science in Sports and Exercise. 2002;34:364–380. doi: 10.1097/00005768-200202000-00027. [DOI] [PubMed] [Google Scholar]
- Lamberts SW, van den Beld AW, van der Lely AJ. The endocrinology of aging. Science. 1997;278:419–424. doi: 10.1126/science.278.5337.419. [DOI] [PubMed] [Google Scholar]
- Larsson L, Grimby G, Karlsson J. Muscle strength and speed of movement in relation to age and muscle morphology. Journal of Applied Physiology. 1979;46:451–456. doi: 10.1152/jappl.1979.46.3.451. [DOI] [PubMed] [Google Scholar]
- Larsson L, Li X, Frontera WR. Effects of aging on shortening velocity and myosin isoform composition in single human skeletal muscle cells. The American Journal of Physiology. 1997;272:C638–C649. doi: 10.1152/ajpcell.1997.272.2.C638. [DOI] [PubMed] [Google Scholar]
- Larsson L, Sjodin B, Karlsson J. Histochemical and biochemical changes in human skeletal muscle with age in sedentary males, age 22–65 years. Acta Physiologica Scandinavica. 1978;103:31–39. doi: 10.1111/j.1748-1716.1978.tb06187.x. [DOI] [PubMed] [Google Scholar]
- Lee SJ, Janssen I, Heymsfield SB, Ross R. Relation between whole-body and regional measures of human skeletal muscle. The American Journal of Clinical Nutrition. 2004;80:1215–1221. doi: 10.1093/ajcn/80.5.1215. [DOI] [PubMed] [Google Scholar]
- Levine JA, Abboud L, Barry M, Reed JE, Sheedy PF, Jensen MD. Measuring leg muscle and fat mass in humans: Comparison of CT and dual-energy X-ray absorptiometry. Journal of Applied Physiology. 2000;88:452–456. doi: 10.1152/jappl.2000.88.2.452. [DOI] [PubMed] [Google Scholar]
- Lexell J, Taylor CC, Sjostrom M. What is the cause of the ageing atrophy? Total number, size and proportion of different fiber types studied in whole vastus lateralis muscle from 15- to 83-year-old men. Journal of the Neurological Sciences. 1988;84:275–294. doi: 10.1016/0022-510x(88)90132-3. [DOI] [PubMed] [Google Scholar]
- The LIFE Study Investigators. Effects of a physical activity intervention on measures of physical performance: Results of the Lifestyle Interventions and Independence for Elders Pilot (LIFE-P) Study. The Journals of Gerontology. Series A, Biological Sciences and Medical Sciences. 2006;61:1157–1165. doi: 10.1093/gerona/61.11.1157. [DOI] [PubMed] [Google Scholar]
- Lindle RS, Metter EJ, Lynch NA, Fleg JL, Fozard JL, Tobin J, et al. Age and gender comparisons of muscle strength in 654 women and men aged 20–93 yr. Journal of Applied Physiology. 1997;83:1581–1587. doi: 10.1152/jappl.1997.83.5.1581. [DOI] [PubMed] [Google Scholar]
- Macaluso A, De Vito G. Muscle strength, power and adaptations to resistance training in older people. European Journal of Applied Physiology. 2004;91:450–472. doi: 10.1007/s00421-003-0991-3. [DOI] [PubMed] [Google Scholar]
- Macaluso A, Young A, Gibb KS, Rowe DA, De Vito G. Cycling as a novel approach to resistance training increases muscle strength, power, and selected functional abilities in healthy older women. Journal of Applied Physiology. 2003;95:2544–2553. doi: 10.1152/japplphysiol.00416.2003. [DOI] [PubMed] [Google Scholar]
- Marsh AP, Miller ME, Saikin AM, Rejeski WJ, Hu N, Lauretani F, et al. Lower extremity strength and power are associated with 400-meter walk time in older adults: The InCHIANTI study. The Journals of Gerontology. Series A, Biological Sciences and Medical Sciences. 2006;61:1186–1193. doi: 10.1093/gerona/61.11.1186. [DOI] [PMC free article] [PubMed] [Google Scholar]
- Marsh AP, Rejeski WJ, Hutton SL, Brown CL, Ip E, Guralnik JM. Development of a lateral mobility task to identify individuals at risk for mobility disability and functional decline. Journal of Aging and Physical Activity. 2005;13:363–381. doi: 10.1123/japa.13.4.363. [DOI] [PubMed] [Google Scholar]
- Messier SP, Loeser RF, Miller GD, Morgan TM, Rejeski WJ, Sevick MA, et al. Exercise and dietary weight loss in overweight and obese older adults with knee osteoarthritis: The Arthritis, Diet, and Activity Promotion Trial. Arthritis and Rheumatism. 2004;50:1501–1510. doi: 10.1002/art.20256. [DOI] [PubMed] [Google Scholar]
- Metter EJ, Conwit R, Tobin J, Fozard JL. Age-associated loss of power and strength in the upper extremities in women and men. The Journals of Gerontology. Series A, Biological Sciences and Medical Sciences. 1997;52:B267–B276. doi: 10.1093/gerona/52a.5.b267. [DOI] [PubMed] [Google Scholar]
- Miszko TA, Cress ME, Slade JM, Covey CJ, Agrawal SK, Doerr CE. Effect of strength and power training on physical function in community-dwelling older adults. The Journals of Gerontology. Series A, Biological Sciences and Medical Sciences. 2003;58:171–175. doi: 10.1093/gerona/58.2.m171. [DOI] [PubMed] [Google Scholar]
- Moritani T, deVries HA. Neural factors versus hypertrophy in the time course of muscle strength gain. American Journal of Physical Medicine. 1979;58:115–130. [PubMed] [Google Scholar]
- Moritani T, deVries HA. Potential for gross muscle hypertrophy in older men. Journal of Gerontology. 1980;35:672–682. doi: 10.1093/geronj/35.5.672. [DOI] [PubMed] [Google Scholar]
- Morse CI, Thom JM, Reeves ND, Birch KM, Narici MV. In vivo physiological cross-sectional area and specific force are reduced in the gastrocnemius of elderly men. Journal of Applied Physiology. 2005;99:1050–1055. doi: 10.1152/japplphysiol.01186.2004. [DOI] [PubMed] [Google Scholar]
- Narici MV, Roi GS, Landoni L, Minetti AE, Cerretelli P. Changes in force, cross-sectional area and neural activation during strength training and detraining of the human quadriceps. European Journal of Applied Physiology and Occupational Physiology. 1989;59:310–319. doi: 10.1007/BF02388334. [DOI] [PubMed] [Google Scholar]
- Nelson ME, Rejeski WJ, Blair SN, Duncan PW, Judge JO, King AC, et al. Physical activity and public health in older adults: Recommendation from the American College of Sports Medicine and the American Heart Association. Medicine and Science in Sports and Exercise. 2007;39:1435–1445. doi: 10.1249/mss.0b013e3180616aa2. [DOI] [PubMed] [Google Scholar]
- Orr R, de Vos NJ, Singh NA, Ross DA, Stavrinos TM, Fiatarone-Singh MA. Power training improves balance in healthy older adults. The Journals of Gerontology. Series A, Biological Sciences and Medical Sciences. 2006;61:78–85. doi: 10.1093/gerona/61.1.78. [DOI] [PubMed] [Google Scholar]
- Ostir GV, Volpato S, Fried LP, Chaves P, Guralnik JM. Reliability and sensitivity to change assessed for a summary measure of lower body function: results from the Women’s Health and Aging Study. Journal of Clinical Epidemiology. 2002;55:916–921. doi: 10.1016/s0895-4356(02)00436-5. [DOI] [PubMed] [Google Scholar]
- Perera S, Mody SH, Woodman RC, Studenski SA. Meaningful change and responsiveness in common physical performance measures in older adults. Journal of the American Geriatrics Society. 2006;54:743–749. doi: 10.1111/j.1532-5415.2006.00701.x. [DOI] [PubMed] [Google Scholar]
- Phillips SM. Short-term training: When do repeated bouts of resistance exercise become training? Canadian Journal of Applied Physiology. 2000;25:185–193. doi: 10.1139/h00-014. [DOI] [PubMed] [Google Scholar]
- Rantanen T, Masaki K, Foley D, Izmirlian G, White L, Guralnik JM. Grip strength changes over 27 yr in Japanese-American men. Journal of Applied Physiology. 1998;85:2047–2053. doi: 10.1152/jappl.1998.85.6.2047. [DOI] [PubMed] [Google Scholar]
- Rausch JR, Maxwell SE, Kelley K. Analytic methods for questions pertaining to a randomized pretest, posttest, follow-up design. Journal of Clinical Child and Adolescent Psychology. 2003;32:467–486. doi: 10.1207/S15374424JCCP3203_15. [DOI] [PubMed] [Google Scholar]
- Reeves ND, Narici MV, Maganaris CN. Musculoskeletal adaptations to resistance training in old age. Manual Therapy. 2006;11:192–196. doi: 10.1016/j.math.2006.04.004. [DOI] [PubMed] [Google Scholar]
- Rejeski WJ, Ettinger WH, Jr, Schumaker S, James P, Burns R, Elam JT. Assessing performance-related disability in patients with knee osteoarthritis. Osteoarthritis and Cartilage. 1995;3:157–167. doi: 10.1016/s1063-4584(05)80050-0. [DOI] [PubMed] [Google Scholar]
- Rosenberg IH. Summary comments. The American Journal of Clinical Nutrition. 1989;50:1231–1233. [Google Scholar]
- Sale DG. Neural adaptation to resistance training. Medicine and Science in Sports and Exercise. 1988;20:S135–S145. doi: 10.1249/00005768-198810001-00009. [DOI] [PubMed] [Google Scholar]
- Salem GJ, Wang MY, Young JT, Marion M, Greendale GA. Knee strength and lower- and higher-intensity functional performance in older adults. Medicine and Science in Sports and Exercise. 2000;32:1679–1684. doi: 10.1097/00005768-200010000-00003. [DOI] [PubMed] [Google Scholar]
- Sayers SP, Bean J, Cuoco A, LeBrasseur NK, Jette A, Fielding RA. Changes in function and disability after resistance training: Does velocity matter? A pilot study. American Journal of Physical Medicine & Rehabilitation. 2003;82:605–613. doi: 10.1097/01.PHM.0000078225.71442.B6. [DOI] [PubMed] [Google Scholar]
- Short KR, Nair KS. Mechanisms of sarcopenia of aging. Journal of Endocrinological Investigation. 1999;22:95–105. [PubMed] [Google Scholar]
- Skelton DA, Greig CA, Davies JM, Young A. Strength, power and related functional ability of healthy people aged 65–89 years. Age and Ageing. 1994;23:371–377. doi: 10.1093/ageing/23.5.371. [DOI] [PubMed] [Google Scholar]
- Skelton DA, Kennedy J, Rutherford OM. Explosive power and asymmetry in leg muscle function in frequent fallers and non-fallers aged over 65. Age and Ageing. 2002;31:119–125. doi: 10.1093/ageing/31.2.119. [DOI] [PubMed] [Google Scholar]
- Skelton DA, Young A, Greig CA, Malbut KE. Effects of resistance training on strength, power, and selected functional abilities of women aged 75 and older. Journal of the American Geriatrics Society. 1995;43:1081–1087. doi: 10.1111/j.1532-5415.1995.tb07004.x. [DOI] [PubMed] [Google Scholar]
- Suzuki T, Bean JF, Fielding RA. Muscle power of the ankle flexors predicts functional performance in community-dwelling older women. Journal of the American Geriatrics Society. 2001;49:1161–1167. doi: 10.1046/j.1532-5415.2001.49232.x. [DOI] [PubMed] [Google Scholar]
- Thomas M, Fiatarone MA, Fielding RA. Leg power in young women: Relationship to body composition, strength, and function. Medicine and Science in Sports and Exercise. 1996;28:1321–1326. doi: 10.1097/00005768-199610000-00017. [DOI] [PubMed] [Google Scholar]
- Tracy BL, Ivey FM, Hurlbut D, Martel GF, Lemmer JT, Siegel EL, et al. Muscle quality. II. Effects of strength training in 65- to 75-yr-old men and women. Journal of Applied Physiology. 1999;86:195–201. doi: 10.1152/jappl.1999.86.1.195. [DOI] [PubMed] [Google Scholar]
- Tracy BL, Ivey FM, Jeffrey ME, Fleg JL, Siegel EL, Hurley BF. A more efficient magnetic resonance imaging-based strategy for measuring quadriceps muscle volume. Medicine and Science in Sports and Exercise. 2003;35:425–433. doi: 10.1249/01.MSS.0000053722.53302.D6. [DOI] [PubMed] [Google Scholar]
- U.S. Department of Health and Human Services. Physical activity and health: A report from the Surgeon General. Atlanta, GA: National Center for Disease Prevention and Health and Promotion; 1996. [Google Scholar]
- Vandervoort AA, McComas AJ. Contractile changes in opposing muscles of the human ankle joint with aging. Journal of Applied Physiology. 1986;61:361–367. doi: 10.1152/jappl.1986.61.1.361. [DOI] [PubMed] [Google Scholar]
- Visser M, Fuerst T, Lang T, Salamone L, Harris TB. Validity of fan-beam dual-energy X-ray absorptiometry for measuring fat-free mass and leg muscle mass. Health, Aging, and Body Composition Study—Dual-Energy X-ray Absorptiometry and Body Composition Working Group. Journal of Applied Physiology. 1999;87:1513–1520. doi: 10.1152/jappl.1999.87.4.1513. [DOI] [PubMed] [Google Scholar]
- Winegard KJ, Hicks AL, Sale DG, Vandervoort AA. A 12-year follow-up study of ankle muscle function in older adults. The Journals of Gerontology. Series A, Biological Sciences and Medical Sciences. 1996;51:B202–B207. doi: 10.1093/gerona/51a.3.b202. [DOI] [PubMed] [Google Scholar]
- Woolstenhulme MT, Conlee RK, Drummond MJ, Stites AW, Parcell AC. Temporal response of desmin and dystrophin proteins to progressive resistance exercise in human skeletal muscle. Journal of Applied Physiology. 2006;100:1876–1882. doi: 10.1152/japplphysiol.01592.2005. [DOI] [PubMed] [Google Scholar]
- Young A. Ageing and physiological functions. Philosophical Transactions of the Royal Society of London. Series B, Biological Sciences. 1997;352:1837–1843. doi: 10.1098/rstb.1997.0169. [DOI] [PMC free article] [PubMed] [Google Scholar]
- Young A, Skelton DA. Applied physiology of strength and power in old age. International Journal of Sports Medicine. 1994;15:149–151. doi: 10.1055/s-2007-1021037. [DOI] [PubMed] [Google Scholar]
- Young A, Stokes M, Crowe M. Size and strength of the quadriceps muscles of old and young women. European Journal of Clinical Investigation. 1984;14:282–287. doi: 10.1111/j.1365-2362.1984.tb01182.x. [DOI] [PubMed] [Google Scholar]
- Young A, Stokes M, Crowe M. The size and strength of the quadriceps muscles of old and young men. Clinical Physiology (Oxford, England) 1985;5:145–154. doi: 10.1111/j.1475-097x.1985.tb00590.x. [DOI] [PubMed] [Google Scholar]