

Abstract
Pancreatic cancer cell lines with mutated ras underwent an alternative form of cell death (aponecrosis) when treated concomitantly with clinically achievable concentrations of arsenic trioxide, ascorbic acid and disulfiram (Antabuse™) (AAA). AAA's major effects are mediated through generation of intracellular reactive oxygen species (ROS) and over 50% decline in intracellular ATP. N-acetyl cysteine and a superoxide dismutase mimetic, prevented aponecrosis and restored intracellular ATP levels. DIDS, the pan- Voltage-Dependent Anion Channel (VDAC), -1, 2, 3 inhibitor and shRNA to VDAC-1 blocked cell death and ROS accumulation. In vivo exposure of AAA led to a 61% reduction in mean tumor size and eliminated tumors in 30% of nude mice with PANC-1 xenografts. We concluded that early caspase-independent apoptosis was shifted to VDAC-mediated “targeted” aponecrosis by the addition of disulfiram to arsenic trioxide and ascorbic acid. Conceptually, this work represents a paradigm shift where switching from apoptosis to aponecrosis death pathways, a.k.a. targeted aponecrosis, could be utilized to selectively kill pancreatic cancer cells resistant to apoptosis.
Keywords: apoptosis, aponecrosis, reactive oxygen species, pancreatic cancer, disulfiram
Introduction
The five year survival with pancreatic cancer (PC) is < 5%, irrespective of initial stage and PC is responsible for approximately 41,000 deaths per year in the USA (1). Standard chemotherapeutic treatment, gemcitabine, for advanced PC, increases median overall survival in patients with metastatic disease by 5-7 weeks over no treatment or 5-FU (2). In the search for more effective therapies, we investigated shifting classical apoptosis toward alternate death pathways, such as necrosis, which are rarely activated by classic chemotherapy drugs and have the potential to overcome resistance to apoptosis (3). Although necrosis may invoke a non-specific inflammatory response, and non-specific cell death, we hypothesized that specificity to cancer cells may be maintained and a non-specific inflammatory response avoided, if cell death is initiated through apoptosis first then redirected into necrosis (a.k.a. aponecrosis). The high levels of reactive oxygen species (ROS) in PC cells is partially due to mutated K-ras, found in 95% of human PC tumors (4), and the reduced levels of free radical scavengers in PC cells (5) may be an ideal milieu for regimens that exploit this difference to switch apoptosis to necrosis. Mitochondrial generated ROS activate a variety of cell signaling and death pathways including apoptosis and necrosis (6).
We present a hypothesis driven model of a switch from apoptosis to aponecrosis, or as we previously termed, targeted necrosis (7), which is dependent on increased generation of ROS in PC cells. This paper utilizes a regimen (AAA) we have developed that has synergistic activity which kills PC cells in vitro and in vivo using the aponecrotic pathway and may be dependent on the Voltage-Dependent Anion Channel (VDAC). Major mitochondrial proteins, including VDAC, the Adenine Nucleotide Transporter (ANT), and cyclophilin D (Cyp-D) interact through critical cysteine residues (8) to form the permeability transition pore complex (PTPC). The PTPC provides a pathway for ATP/ADP exchange and is considered to be key for determining whether a cell enters mitochondrial-mediated apoptosis or necrosis. AAA was much less toxic to human marrow pluripotent stem cells and non-malignant cells and had activity in mouse pancreatic tumor xenografts. We view AAA as a prototype regimen for the induction of aponecrosis.
Each component of AAA has been used in patients: Arsenic trioxide (ATO) (2 μM maximal serum concentrations) has been successfully and safely used for the treatment of acute promyelocytic leukemia (APL) (9). However, 2 μM ATO alone has not demonstrated anti-tumor activity against solid tumors (10), and > 6 μM ATO was required to kill solid tumor and PC cell lines (10). Six μM ATO alone in vivo was toxic in humans, but required to induce in vitro apoptosis in PC cells (10, 11). Ascorbic acid (AA) works synergistically with ATO in non-APL myeloid leukemia cells (12) and 100 μM AA and 2 μM ATO serum concentrations are an effective in vitro/in vivo regimen for human multiple myeloma (13) and APL (9).
However, in order to have an antitumor effect in PC, which is highly resistant to apoptosis, we wanted to induce necrosis to bypass mechanisms of apoptotic resistance. Pathways for induction of necrosis include caspase inhibition and lowered ATP levels (14). Antabuse (Disulfiram, DSF) has been clinically used as an alcohol deterrent, through inhibition of aldehyde dehydrogenase (15), but also inhibits caspase 3 and 7, at 5 μM which are vital to pathways of apoptosis (16). As shown later, DSF at 0.25 μM provided maximal synergy for induction of aponecrosis when added to ATO/AA (AAA) by decreasing intracellular ATP levels by >50% and increasing ROS levels. Normally, DSF is generally used at a clinical dose of 500 mg/day, which achieved serum concentrations of > 1.4 μM (17). Thus, all components of AAA are easily achievable and safe in humans.
The AAA therapy exploits intrinsically high levels of ROS generated by mutant Ras and intrinsically low levels of detoxification enzymes such as superoxide dismutase (SOD) and glutathione peroxidase in PC. This overwhelms the PC cell with O2.— radicals along with specific inhibition of VDAC function, which lowers ATP levels, thereby forcing the PC cell into a completed aponecrotic cell death. AAA promotes in vitro and in vivo killing in human PC cells/tumors at non-toxic ATO concentrations (2 μM), and promotes initial apoptosis, which gives specificity to PC cancer cells, with a delayed necrotic mechanism, thus completing cell death in intrinsically resistant PC cells.
Materials and Methods
Materials
DSF, ATO, AA, and N-Acetyl cysteine (NAC): Sigma-Aldrich Company (St. Louis, MO). Paclitaxel (PAC) Mayne Pharma (Paramus, NJ). DHE and DCFDA were from Molecular Probes (Eugene, OR).
Cell Culture
The human PC cell lines PANC-1, AsPC-1, BxPC-3, MIA PaCa-2, and non-malignant cell lines MCF-10F (breast epithelial), and CCD-27sk (skin fibroblast) were from ATCC (Rockville, MD). Cell lines were passaged no more than 10 times from liquid nitrogen before being discarded. Monolayer cultures, except MCF-10F, were maintained in RPMI 1640 medium (Life Technologies, Grand Island, NY) supplemented with 10% heat-inactivated FBS (Atlanta Biologicals, Norcross, GA), 100 U/ml penicillin G, 100 μg/ml streptomycin and 2 mM glutamine (Life Technologies, Grand Island, NY). MCF 10F cells, a human breast non-malignant cell line, were maintained in DMEM/F12 (1:1) supplemented with 5% horse serum, 2 mM L-glutamine, 100 μg/mL penicillin/streptomycin, 20 mM HEPES, 10 μg/mL insulin, 0.5 μg/mL hydrocortisone, 100 ng/mL cholera toxin, and 20 ng/mL EGF. For all experiments, cells were trypsinized and allowed to adhere overnight and achieve exponential growth prior to drug treatments.
Stem cell toxicity assay for CFU-GEMM
Normal adult volunteers, who signed consent forms approved by our IRB, underwent leukopheresis of peripheral blood for stem cell harvesting. Peripheral blood CD34+ stem cell progenitors for granulocytes, erythroid, monocytes and macrophages (CFU-GEMM) were exposed to various drug combinations for 48h. After exposure, the cells were washed in PBS, added to methycellulose H4434 (Stem Cell Technology), with the necessary growth factors for CFU-GEMM. Cells were plated at 1×10⁵ cells/well and incubated for 14 days at 37°. The total number of colonies (> 50 cells) were scored by a blinded observer.
TUNEL, Annexin V/PI, Trypan Blue, Vybrant Cytotoxicity Assays and Microscopy
Cells were exposed to drug treatments as indicated, trypsinized and pooled with floating cells. TUNEL was performed as previously described (7). For Anx V/PI analysis, cells were incubated with Alexa Fluor 488 (Molecular Probes, Eugene OR) for 15 min followed by 0.33 μg/ml PI and analyzed immediately by FACS (channels FL-1 for Anx V and FL-3 for PI). For trypan blue analysis, cells were resuspended in 100 mL PBS and trypan blue (final concentration 0.04%), incubated at room temp 5 min. and at least 200 cells scored/sample by a blinded reader. The Vybrant cytotoxicity assay (In Vitrogen, Grand Island, NY) was carried out according to the manufacturer's instructions. Confocal and electron microscopy was performed as described in our previous experiments (7).
Intracellular glutathione, LDH and ATP
After various treatments, cells were collected (including floating cells), and washed with PBS. Reduced GSH was analyzed using the ApoGSH Glutathione Colorimetric Kit (Biovision Research Products, Mountain View, CA). Intracellular ATP levels and LDH were determined as described (7).
VDAC-1 shRNA adenovirus and stable cell line
shRNA constructs pAd/U6/VDAC-1-shRNA and control pAd/U6/shuffled-VDAC-1-shRNA were synthesized in our lab using the human VDAC-1 target sequence 157-AAAGTGACGGGCAGTCTGGAA-177 and inserted into an E1/E3-deleted adenovirus vector 5 (18), and propagated in 293A cells according to the manufacturer's instructions (Invitrogen, Carlsbad, CA). The virus particle titer after filtration-based concentration (Adeno-X Virus Purification Kit, Clonetech Laboratories, Inc.) was 1 × 10⁹ pu/ml as determined by plaque titration assay in 293A cells. PC cells in log phase were infected over a 24h period with pAd/U6/VDAC-1-shRNA or control pAd/U6/shuffled-VDAC-1-shRNA at 20 or 30 MOI, and exposed to drug combinations and assayed.
Doxycycline-regulated expression pSingle-tTS-shRNA against hVDAC1 was stably expressed in PANC-1 cell line. Specific silencing of the endogenous hVDAC-1 was achieved by using a shRNA-expressing vector. Nucleotides 159–177 of the hVDAC-1 coding sequence were chosen as the target for shRNA. This sequence is homologous to sequences of hVDAC-1. The hVDAC-1-shRNA-encoding sequence was created by using the two complimentary oligonucleotides indicated below, each containing the 19 nucleotide target sequence of hVDAC-1 (159–177), followed by a short spacer and an antisense sequence of the target: oligonucleotide 1, AGCTTAAAAAAGTGACGGGCAGTCTGGAATCTCTTGAATTCCAGACTGCCCGTCACTG and oligonucleotide 2, GATCCAGTGACGGGCAGTCTGGAATTCAAGAGATTCCAGACTGCCCGTCACTTTTTT A. The hVDAC-1-shRNA-encoding sequence was cloned into the XhoI and HindIII sites of the pSUPERretro plasmid (Oligo- Engine, Seattle, WA), containing a G418-resistance gene. Transcription of this sequence by RNA-polymerase III produced a hairpin shRNA (hVDAC-1-shRNA). Cells were transfected, treated with G418, colonies selected and tested for low expression of VDAC-1. The colony (p10), which exhibited the lowest VDAC-1 expression was chosen for the experiment.
ROS analysis
Following treatment, floating and adherent cells were harvested, and intracellular ROS assessed using cytofluorometry with the following 7 probes added in the final 30 min of incubation at the following final concentrations: 1) 2′, 7′-dichlorodihydrofluorescein diacetate (19) (DCFDA, 10 μM), 2) dihydroethidium (DHE, 10 μM), 3) singlet oxygen sensor green (SOSG, 5 μM), 4) MitoSOX red mitochondrial superoxide indicator (MitoSOX, 5 μM), 5) aminophenyl fluorescein (20) (APF, 5 μM), 6) hydroxylphenyl fluorescein (HPF, 5 μM) and 7) Amplex Red, (AMP, 200 μM) (21). For ROS dyes #1-6, cells were collected, washed, centrifuged, resuspended in PBS, and fluorescent intensity of 5000 cells analyzed on a FACSCalibur flow cytometer (Becton Dickinson, San Jose, CA) for ROS, and for #7, according to the manufacturer's directions (Invitrogen, Eugene OR). These probes mainly measured the following ROS according to the number above 1) H2O2, COO-, ONOO-; 2) O2-; 3) O-; 4) O-, O2-; 5) OH-, ONOO-, -OCl; 6) OH-, ONOO-; 7) H2O2. DHE detects general ROS, but especially O2.— (22). SOSG (23) and MitoSOX (24) are relatively selective for singlet oxygen radicals and superoxide radicals (O2.—), respectively. The names of these ROS abbreviations are listed in the Supplementary Methods.
Nude Mouse Xenografts
Five to six week old homozygous Nu/Nu (Crl:NU-Foxn1nu) male mice (Charles River Laboratories, Wilmington, MA), were injected at two sites on the dorsal flank with 1 × 10⁶ PANC-1 cells in 1:1 Matrigel:RPMI media (final Matrigel concentration 5 g/ml). After 7 days, visible tumors developed and treatment began three times per week when average tumor volume was 50 mm3 at the following doses: ATO (6.0 μg/g, i.p.) (25), AA (0.75 mg/g/day p.o.) (26) and DSF (4.0 μg/g/day p.o.) (27). ATO was dissolved in 1.65 M NaOH, neutralized with HCl and diluted in PBS. Fresh AA and DSF were replenished in the drinking water at each ATO I.P. injection, 3 times/week. (calculated for mice weighing 25 g and drinking 5 ml water/day). An equal number of control mice received PBS i.p. injections and normal drinking water. Tumor size was measured weekly for four weeks and volume (mm3) determined by the following formula: π/6 xLxWxH.
Results
PC cell death induced by ATO+AA+DSF (AAA)
ATO alone at 2 μM did not induce significant death of human PC cell lines in vitro (≤ 5%). However, when 2 μM ATO was combined with 100 μM AA there was 22% apoptosis after 48h (Fig 1A). Since DSF (Antabuse) is a potent oxidizer of GSH and a potent caspase 3 inhibitor (IC50= 5 μM) (16), we hypothesized that DSF would synergize with ATO+AA to induce cell death, and could preferentially shift early apoptotic cells to a necrotic cell death pathway. After 48h incubation of PANC-1 cells with ATO (2 μM), AA (100 μM) and DSF (0.25 μM) (AAA), the TUNEL+ cells (fractured DNA) were: 59% in AAA, 32% in AA+DSF, 22% in the ATO+AA and 12% in ATO+DSF-treated groups (Fig. 1A). None of the drugs alone produced a significant number of TUNEL+ cells (≤7%). Addition of DSF to ATO+AA group synergistically increased cell death from 22% to 59%. Trypan blue analysis confirmed that AA+DSF substantially lowered the cell death IC50 of ATO in PANC-1 from 6 μM to 2 μM (Fig. 1B). At 2 μM ATO, DSF addition resulted in an increase in cell death from 10.0 +/- 2.25 to 59.2 +/- 4.63, as in the TUNEL results and in MIA PaCa-2 cells from 15.1 +/- 2.1 to 74.5 +/- 5.3%. Similar results were obtained with AsPC-1 and BxPC-3 cells lines (Supp. Fig. S1A).
Figure 1.
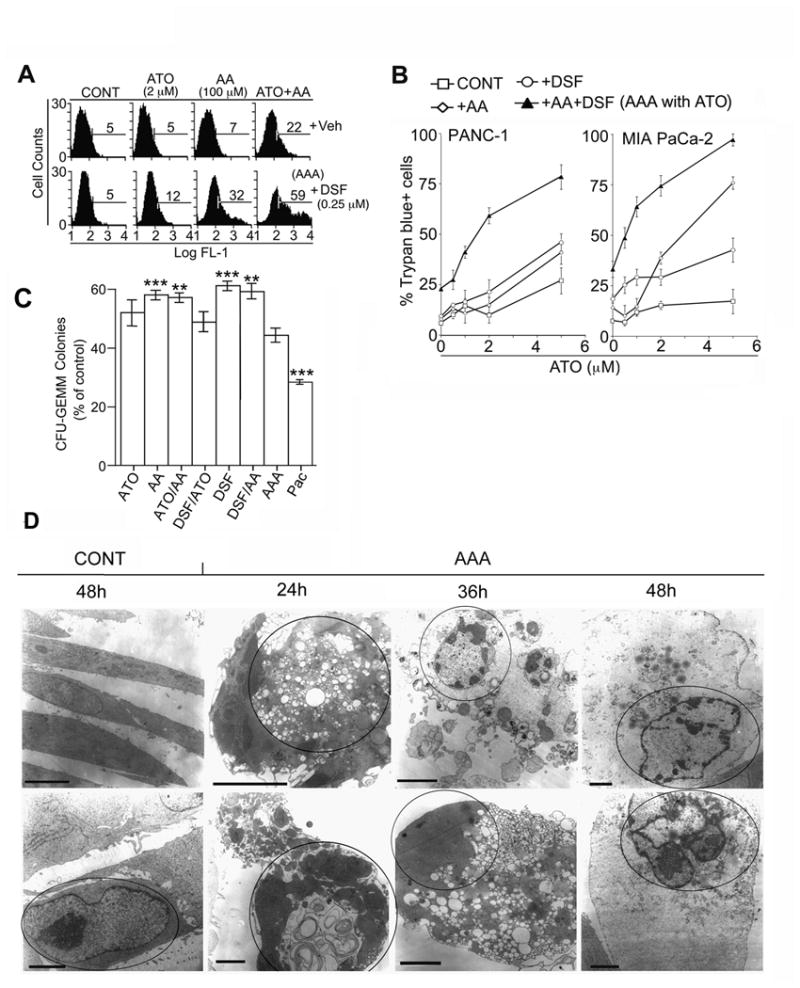
Effect of AAA on pancreatic cancer cell lines and normal cells. A. Cells were treated +/- ATO (2 μM), AA (100 μM) or DSF (0.25 μM) and DNA fragmentation determined by TUNEL after 48h. %TdT+ cells are indicated by Cell Quest software. Veh =vehicle. B. % Trypan-blue (TPB)+ cells determined after 48h in PANC-1 or MIA PaCa-2 cells with increasing concentrations of ATO, +/-AA, DSF, or (AA+DSF). For all experiments, the concentration of ATO, AA, and DSF were 2 μM, 100 μM and 0.25 μM, respectively, unless otherwise indicated (See Fig 4D for determination of minimal effective DSF concentration). AAA= ATO+AA+DSF. For TPB analysis, at least 200 cells were scored/sample and performed in triplicate. All controls contained vehicle additions: DMSO <0.1% and NaOH <66 μM. Veh= vehicle control. p < .0124 for PANC-1 and p< 0.0002 for MIA PaCa-2 over all ATO concentrations with addition of AA/DSF compared to all other drug combinations. Similar cytotoxicity results were obtained in human PC cell lines MIA PaCa-2 (73.0 ±5.6%), BxPC-3 (83 ± 3.2%) and AsPC-1 (73 ± 5.6%). C. Effect of AAA on normal human peripheral blood CD34+ stem cell progenitors for CFU-GEMM +/- ATO, AA or DSF for 48h. PAC=paclitaxel at 50 nM, a common clinical concentration. Results represents percentage of control colonies +/- SD, n=3. *, **, ***, ****, = p values <0.05, <0.01, <0.001, <0.0001, respectively, compared to AAA treatment group. D, Electron microscopy of PANC-1 cell +/- AAA. After 24h incubation with AAA, the cell morphology was primarily apoptotic with apoptotic bodies, condensed DNA, and a dense cytoplasm. By 36h, cells with perforated plasma membranes, dispersed hypodense cytoplasm (consistent with necrosis) appeared. By 48h, cells displayed a condensed apoptotic-like nucleus and a dispersed necrotic hypodense cytoplasm. Representative photomicrographs are shown for the indicated times, and the nuclei of each cell are circled. Bars = 2.5 microns. All experiments done 3 times in triplicate.
Effect of AAA on CFU-GEMM and non-malignant cell lines
The effects of all combinations of AAA drugs were assessed for toxicity to rapidly proliferating normal human peripheral blood CD34+ stem cell progenitors for CFU-GEMM. The cytotoxicity to CFU-GEMM colonies were: ATO- 48% ± 4; AA- 42%; DSF- 38.6 ± 3.3 %; AAA- 56 ± 3%; and Paclitaxel (PAC)- 72 ± 2.9% compared to untreated control. PAC at 50 nM, an average clinically relevant serum concentration in humans, was nearly 2-fold more toxic than any combination of the AAA drugs (Fig 1C). The cytotoxic effect of AAA on the human non-malignant breast cell line MCF-10F and the fibroblast line 27sk was also minimal compared to PC cell lines cytotoxicity: (59.2 +/- 4.63 -PANC-1, 74.5 +/- 5.3% -MIA PaCa-2, 83 +/- 3.2% -BxPC-3, and 73 +/- 5.6% -AsPC-1) (Fig. 1B and Supp. Fig. S1B).
Morphology of AAA-treated cells
PANC-1 cells were examined using phase contrast (Supp. Fig. S1C) and electron microscopy (Fig. 1D). As early as 16h after AAA addition, approximately 50% of PANC-1 cells began to round up and detach from the plate and by 48h, >90% of PANC-1 cells were floating trypan blue positive (data not shown). The DNA was pyknotic on DAPI staining. Similar to TUNEL analysis (Fig. 1A), minor death (<10%) was noted after each single drug treatment, and there was approximately 20% death in the AA+DSF-treated group and approximately 90% death from exposure to AAA as detected by phase contrast microscopy (Supp. Fig. S1C). AAA-treated PANC-1 cells were examined by electron microscopy (Fig. 1D). These microscopic studies suggested that the cells initially entered apoptosis (nuclear features of apoptosis of chromatin along the nuclear membrane; crescent shapes and chromatin bodies), which transformed into aponecrosis (nucleus apoptotic and cytoplasm necrotic) between 24 and 36 hrs. The cytoplasm has swelled and numerous breaks in the cell and nuclear membrane were observable, which is a characteristic of necrosis.
Characterization of AAA induced death
AAA-induced cell death began by 4h, and similar to the death curve with pharmacologically high concentrations of PAC (25 μM) (Fig. 2A), shown to induce necrosis in other cell types (28). After 4h, death from AAA followed a temporal course that was intermediate between apoptosis and necrosis. This was also confirmed in a glucose-6-phosphate dehydrogenase (G-6-PD) assay (Supp. Fig. S2A). G-6-PD catalizes the first and rate-limiting step of the pentose phosphate pathway critical for maintaining NADPH levels, therefore it can be indicative of necrosis. AAA treatment resulted in a 4.25 fold decline in intracellular ATP at 4h in PANC-1 cells and a 50% decrease in MIA PaCa-2 (Supp. Fig. S2B). The release of LDH, indicative of plasma membrane perforations, was not observed at this time (4h) suggesting that the loss of ATP by 4h preceded the formation of membrane perforations (occurred at >24h) (Supp. Fig. S2C). Paclitaxel, at 25 μM, but not AAA, induced mainly necrosis at 4 and 8h. This is consistent with the electron microscopy data showing the appearance of necrotic cells after 24h.
Figure 2. Necrotic markers in AAA-treated PANC-1 cells.
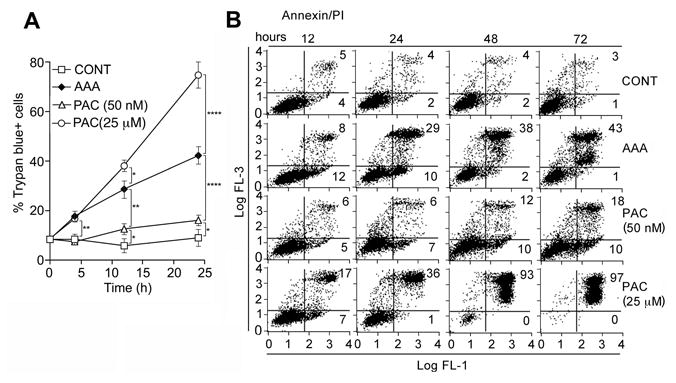
A. Temporal course of cell death determined by trypan blue (TB). Cells were treated +/- AAA or Paclitaxel (PAC) (25 μM or 50 nM). PAC at 50 nM induces apoptosis and at 25 μM induces necrosis. PAC at 25 μM induced the maximal number of TB+ cells (necrotic), while PAC at 50 nM induced the least number of TB cells (apoptotic). AAA induced an increasing percentage of necrotic cells (TB+) over time, while at earlier time points, TB+ cells were less, which is consistent with apoptosis. See Fig. 1C for values. B. Flow cytometric analysis for apoptosis/necrosis. PANC-1 cells +/- AAA, or PAC (25 μM or 50 nM) for the indicated times, and stained with Anx V/PI, and analyzed by flow cytometry. Percentages of apoptosis and necrosis were determined by Cell Quest software and expressed as a time course plot. Apoptosis = Anx+/PI- (Lower right panel); Necrosis= Anx+/PI+ cells (upper right panel). All experiments done 3 times in triplicate.
A time course investigation of cells treated with AAA was demonstrated at various time points: 12h- 12% apoptotic and 8% necrotic cells; 24h- 10% apoptotic and 29% necrotic cells; 48h- 2% apoptotic cells and 38% necrotic cells (Fig. 2B). Therefore, cells that had been in apoptosis may have been shifted to necrosis. There was also extensive necrosis in AAA-treated MIA PaCa-2 cells similar to PAC at 25 μM after 24h (Supp. Fig. S3A). PC cells from the above time course studies demonstrated no PARP cleavage (Fig. 3A) or no increase in caspase-3, or 9 activity in AAA-treated cells as an explanation for the decline in ATP at the same time point (Fig. 3B). In addition, no increase in caspase-8 activity could be detected, and AAA did not result in cleavage of caspase-3, 8 or 9 until 24h unlike PAC treatment, which resulted in caspase cleavage starting at 6 h (Fig. 3C). The data suggested that AAA-induced cell death followed some of the features of the intrinsic pathway of apoptosis in the early stages such as cytochrome c release (Supp. Fig. S3B), increased Bak, decreased Bcl-2 (Fig. 3D), but lacked some of the critical features of classical apoptosis such as caspase 3, 8, and 9 activation (Fig. 3B,C) and later demonstrated signs of necrosis such as increased G-6-PD release, phase contrast and electron microscopy. These changes were accompanied by decreased ATP levels (>50%), which have been shown to shunt apoptosis into necrosis. Necrosis can occur with low levels of ATP while apoptosis requires higher levels of ATP and apoptosis is shunted into necrosis when > 50% of a cell's ATP stores are lost (29).
Figure 3. Apoptotic Markers in AAA-treated PANC-1 cells.
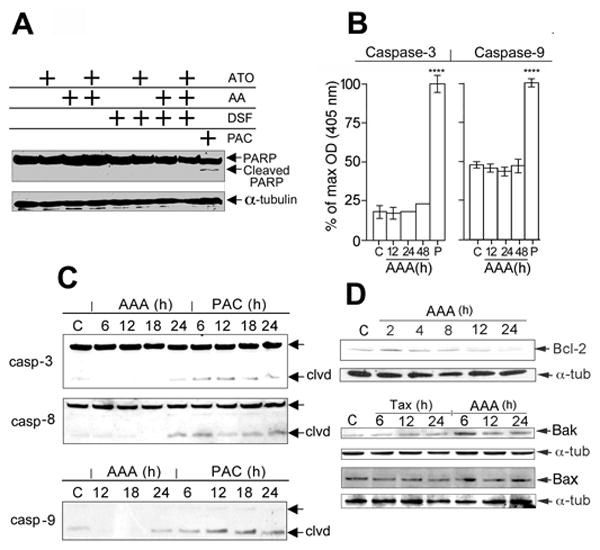
A, PARP cleavage. PANC-1 cells were untreated or exposed to AAA for 48h. Fifty μg total cell lysate was analyzed on Westerns by anti-PARP antibody. Paclitaxel treatment (50 nM, 48h) represents a positive control for apoptosis to show the PARP 85kDa cleavage product, as indicated by an arrow. B, Caspase-3 activity. PANC-1 cells were untreated, or treated with AAA for indicated times. Caspase-3 protease activity in cell lysates was assayed by spectrophotometric detection of the chromophore pNA after cleavage from the labeled substrate DEVD-pNA. Results represent mean absorbance ± SD, n = 3. Paclitaxel treatment (50 nM, 48h) represents a positive control for caspase-3 and 9 protease activity. **** = p values <0.0001. C, Westerns of caspase-3, 8 and 9. Time course of cells treated with AAA or PAC (50 nM) for 6, 12, 18 or 24h. D, Westerns of Bcl-2, Bak and Bax. Time course of cells treated with AAA or PAC (50 nM) for 2, 4, 8 12, or 24h. All Westerns were done in triplicate.
Mechanism of AAA-induced cell death
N-acetyl cysteine (NAC) abrogated the AAA-induced cell death as measured by trypan blue. NAC alone had no effect on cell death, but completely reversed AAA-induced cell death (Fig. 4A) and addition of NAC to AAA increased the intracellular ATP 2.9 fold over the AAA group (Fig 4B). Since NAC may be a ROS scavenger (O2.—, H2O2), and a critical component in the formation of GSH, we measured ROS and GSH levels after AAA treatment. Intracellular ATP and GSH decline after 4h correlated with addition of DSF to ATO+AA in Panc-1 cells (Fig. 4C) and at 0.25 μM DSF, declined by 56% as early as 4h after exposure to AAA in MIA PaCa-2 cell line (Supp Fig. S3C). Cell death maximized at 0.25 μM DSF (Fig. 4D). Cell death as measured by trypan blue increased approximately 4 fold over this concentration range of DSF (0.01 to 0.25 μM) (Fig 4D). A 6.2-fold increase in the number of cells with low NADH correlated with the low mitochondrial membrane potential caused from AAA exposure (Supp. Fig. S4A,B). To further study the relationship between DSF and lowered ATP levels we assessed the drugs of AAA in various combinations. ATP concentrations fell by 70.7% in PANC-1 and 56% in MIA PaCa-2 cells from AAA exposure, and all other single and binary combinations of AAA had less effect on intracellular ATP concentrations (Fig. 4E and Supp Fig. S2B). Only when DSF was added did ATP levels fall below 50%, a level that we showed earlier to cause apoptosis to transform into necrosis.
Figure 4. Relationship between ATP, GSH and cell death in AAA-treated PANC-1.
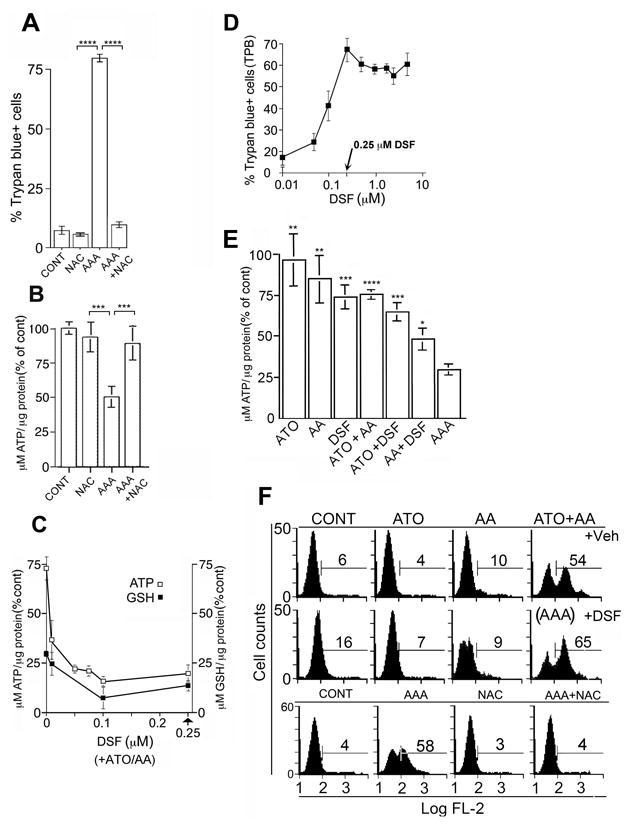
A. Effect of 3.5 mM NAC on AAA-induced death after 48h. **** = p values < 0.0001. B. Effect of 3.5 mM NAC on AAA-induced ATP decline after 4h. Intracellular ATP levels were determined by luminometer at 560nm. Results expressed as % of untreated controls and represent mean luminosity +/- SD, n=3. *** = p values < 0.001. C Intracellular ATP and GSH after 4h with ATP/AA and increasing concentrations of DSF. For ATP and GSH, p= < 0.006 for all points with DSF compared to 0 μM DSF. D. Cell death with 2 μM ATO and 100 μM AA after 48h with increasing concentrations of DSF. E. Intracellular ATP concentrations in PANC-1 exposed to ATO/AA/DSF/ATO+AA/ATP+DSF/AA+DSF or AAA for 4h (details Fig 4B). All experiments done 3 times in triplicate. p values relative to AAA are indicated. See Fig. 1C for values. F. Intracellular accumulation of O2.— radical in PANC-1 cell lines +/-ATO, AA, or DSF, or AAA +/- NAC. Cells were analyzed by flow cytometry using Mitosox Red dye. All experiments done 3 times in triplicate.
ROS were analyzed by seven semi-specific probes: MitoSOX Red and DHE (superoxide, O2.—), SOSG (singlet oxygen), APF (hydroxyl radical), HPF (hypochlorite anion), Amplex Red (H2O2) and DCFDA (general ROS). Superoxide radicals appeared as early as 2.5h after the addition of AAA in PANC-1 as determined by DHE and MitoSOX Red. After 6h, MitoSOX Red showed 54% O2.— with ATO+AA treatment and it further increased to 65% O2.— levels when PANC-1 cells were treated with AAA as compared to 6% baseline (Fig 4F). NAC totally abrogated the AAA-induced cell death, ATP decline and ROS (O2.—) levels (Fig. 4A,B,F). These findings were similarly demonstrated in MIA PaCa-2 with some of the above ROS probes (Supp. Fig. S5). The O2.— scavenger, MnTMPyP completely abrogated the AAA-induced O2.—, which was paralleled by a nearly total block of subsequent cell death (Supp. Fig. S6A). Potassium Cyanide (KCN), which blocks the electron transport chain, reduced O2.— levels and cell death (Supp. Fig. S6B). The ROS forms of singlet oxygen free radical (1O2), hydroxyl radical (OH. —), and hydrogen peroxide (H2O2) were also generated but to a much lesser degree than O2.— free radicals from AAA exposure in these 4 PC cell lines.
The direct relationship between the action of AAA and its induction of aponecrosis is positively correlated either casually or associatively to the mechanism(s) of ATP synthesis. Therefore, we studied the effects of specific inhibitors of the voltage dependent anion channel (VDAC), an integral part of the mitochondrial permeability transition pore complex (PTPC). We found that specific inhibitors of VDAC -1, -2, -3, such as DIDS (4,4′-Diisothiocyanatostilbene-2,2′ disulfonic acid) and dextran sulfate (DEX), which alters the voltage dependence of VDAC (30) also potently inhibited cell death induced by AAA (Fig. 5A), and superoxide (O2.—) accumulation (Supp. Fig. S6C). Since the VDAC inhibitors reversed cell death, we tested the involvement of VDAC-1 more directly by using shRNA adenovirus directed against VDAC-1 made in our lab. The VDAC-1 shRNA substantially decreased VDAC-1 expression on Western blots (Fig. 5B), and was directly associated with inhibition of AAA-induced O2.— levels, and reduced cell death in the PC cell lines MIA PaCa-2 (39% to 18%), AsPC-1 (23 to 12%) and BxPC-3 (73 to 46%) (Fig. 5C). In addition, a VDAC-1 shRNA, doxycycline (DOX)-inducible PANC-1 stable cell line expressed lowed VDAC-1 levels than the control cell line and with DOX (Fig. 5D), and showed reduced cell death in the presence of DOX (40-29%) (Fig. 5E). Viral constructs over expressing VDAC-1 in PANC-1 cells increased sensitivity to low, non-cytotoxic concentrations of AAA by 5-fold (Fig. 5F). In this experiment, low dose AAA was used at half the concentration (1 μM ATO, 50 μM AA and 0.125 μM DSF) so that the effect of increase in sensitivity could be observed more quantitatively. These results suggested that VDAC-1 was involved in AAA-induced O2.— release, ATP decline and aponecrotic cell death and could be a direct target of AAA in vitro.
Figure 5. Effect of VDAC inhibitors and VDAC-1 shRNA on cell death by AAA.
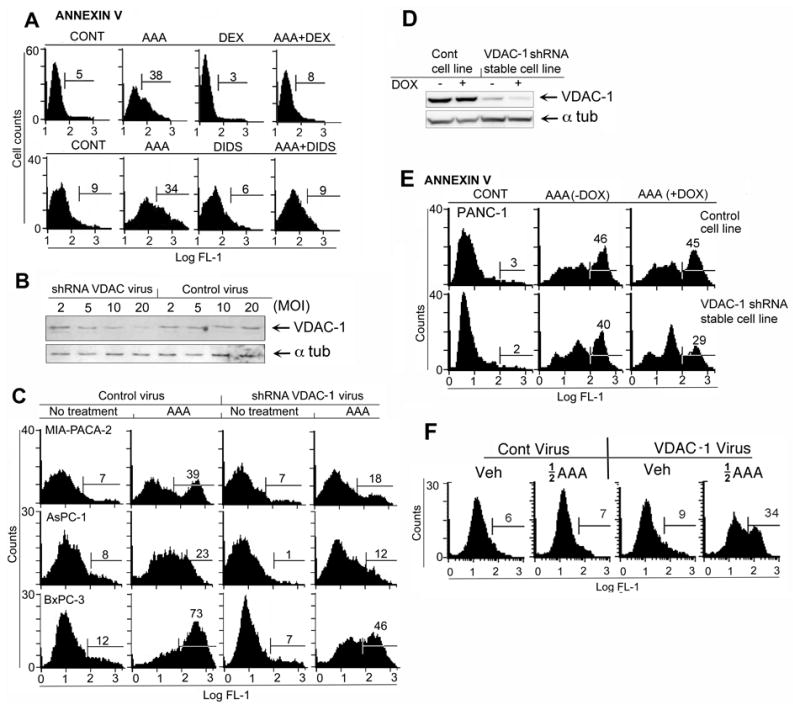
A. Effect of 300 mM DEX or 300 mM DIDS on cell death as measured by Annexin V. Experiment done 3 times in triplicate. B. Western blot of VDAC-1 in shRNA adenovirus-treated MIA PaCa-2 cells. C. Effect of VDAC-1 shRNA- expressing adenovirus on AAA-induced cell death as assessed by Annexin V. D. Western blot of VDAC-1 in a control PANC-1 cell line containing vector only, and a doxycycline (DOX)-inducible VDAC-1 shRNA-expressing, PANC-1 stable cell line +/- 2 μg/ml DOX. E. Cell death as assessed by annexin V in PANC-1 control vector cells or in VDAC-1 shRNA-expressing PANC-1 stable cell line +/- 2 μg/ml DOX (See Fig. 5D). F. Effect of VDAC-1 over-expression by CMV promoter-VDAC-1 adenovirus on AAA-induced cell death (AAA assessed at non-toxic, half of standard concentrations of AAA to maximize effect of VDAC-1 over-expression). Experiment was repeated three times.
In vivo efficacy of AAA
AAA was tested in homozygous Nu/Nu (Crl:NU-Foxn1nu) mice, after injection with PANC-1 cells, and tumor size monitored in AAA-treated and control mice (Fig. 6A-B). A significant difference in tumor size between control and AAA-treated mice was noted within one week (3 AAA treatments) and continued over the next two weeks (Fig. 6A, and Supp. Table 1). There were rapid growth rates of control tumor by weeks 1 through 3 and potent cytotoxicity of AAA on PANC-1 tumors. By weeks 1 through 3 the control tumors had grown 50-200% over the starting point. In the same time frame, AAA had shrunk the tumor by 50-75% in comparison to the original tumor size. By week 3 the tumors in the control group compared to the AAA group was nearly 3 fold larger in size (p=0.001). This implied that the AAA effect was cytotoxic and not just cytostatic upon the PANC-1 tumor xenografts. AAA treatment also increased the percentage of tumor free mouse xenografts over the 3 week period. (Fig. 6B). By week 3, 30% of AAA-treated mice were tumor free as compared to 5% of the control group by physical exam (p=0.005) (n= 21 animals/group). There were no physically discernable changes or adverse effects from AAA treatment in the mice.
Figure 6. Effect of AAA on PANC-1 tumor xenografts in nude mice.
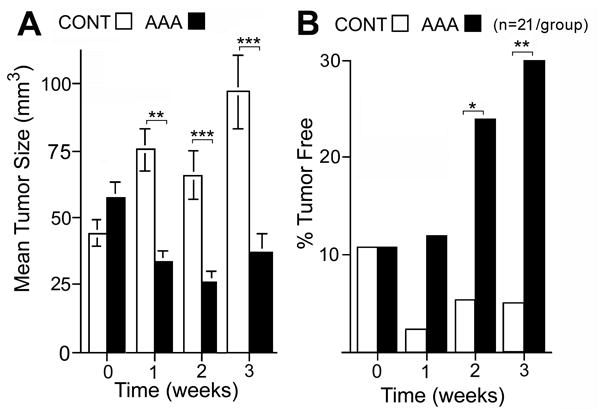
A. Mean tumor volume over time +/- SEM (n= 42 total with 21 animals/group). B. The percentage of tumors that became undetectable by visualization and palpation over time (n= 21 animals/group). *, **, *** = p values are less than < 0.05, <0.01, <0.001 respectively.
Discussion
AAA induced an alternative cell death pathway with low, clinically achievable concentrations of readily available drugs that produced synergistic cytotoxicity in PC cells. Initial cell death displayed features of incomplete apoptosis, and later exhibited necrotic features, which suggested necrosis occurred within the same cell (aponecrosis). AAA did not demonstrate synergistic toxicity to normal human marrow CD 34+ stem cells or non-malignant breast epithelial or fibroblast cells, and reduced or eliminated human xenograft PC tumors in nude mice with no discernable toxic effects.
AAA cell death and ROS (mainly superoxide, O2.—) were significantly decreased upon prior or concomitant treatment with NAC, MnTMPyP, (superoxide dismutase mimetic), Dextran and KCN, (inhibitor of mitochondrial-produced O2.—). The primary ROS species involved in AAA-induced cell death was O2.— and was necessary in the mechanism of cell death from AAA. However, other factors contributing to cell death are possible since ROS was also high in the ATO+AA treated cells, which showed less cell death than AAA (O2.— in AAA-65% vs ATO/AA-54%). The ROS formed, mostly O2.—, is most likely involved in the rapid decline of intracellular ATP levels and reduced NADH levels, triggering a shift to aponecrosis. ATP levels fell rapidly (>50%) only when DSF (0.25 μM) was added to ATO/AA (Fig. 4E). In a mechanism not yet understood; the addition of DSF to ATO/AA decreased ATP levels to initiate aponecrosis. Ample levels of ATP are needed to complete apoptosis and if the ATP levels fall below a critical level the cell diverts into a necrotic death pathway (29). However, although intracellular ATP declined early (≤ 4h), electron microscopic signs of aponecrosis were not observed until after 24h. First, cells showed an apoptotic-like nuclear chromatin condensation accompanied by TUNEL+, as well as Anx V+/PI– cells (apoptotic). After 24h, membrane perforations (Anx V+/PI+ cells) appeared, indicative of necrosis. The time between the initial ATP decline and development of aponecrotic features suggests that there may be a biochemical program leading to the development of aponecrosis. In summary, evidence for early but incomplete apoptosis included: 1-Annexin V+/PI- cells; 2-cytochrome C release by confocal microscopy; 3-apoptotic nuclei by electron microscopy; 4-increased Bak and decreased Bcl-2 expression and 5- no LDH release. However, we did not observe caspase 3,8, or 9 or PARP cleavage. Evidence for later necrosis included: 1-reduction of intracellular ATP by > 50%; 2- increased Ann+/PI+ cells; 3- massive increase in ROS; 4- markedly reduced GSH and; 5-a necrotic cytoplasmic morphology by electron microscopy.
VDAC inhibitors reversed AAA-induced O2.— accumulation and annexin V+ cells suggesting AAA may disrupt the permeability transition pore complex (PTPC), which is central to both ATP/ADP exchange between the outer mitochondrial membrane (OMM) and cytoplasm, as well as a key modulator of apoptotic/necrotic cell death (31). Other studies have observed a similar switch of apoptosis to necrosis eliciting a VDAC-dependent permeabilization of the OMM and release of cytochrome C (31). ATO has been shown to target VDAC possibly through cross-linking of transmembrane cysteine residues or homodimerization of VDAC molecules which may disrupt its function (32). AAA exposure may oxidize critical thiol groups involved with the PTPC (8, 33). Importantly, DSF can also directly lower GSH (16), reducing the ability of cells to quench O2.— . Decreased GSH could lead to an increase in intracellular arsenic concentrations, since GSH is vital to the primary mechanism by which the cell eliminate heavy metals, including arsenic, via GSH-metal linkage by GST-pi and efflux via MRP (34). Consistent with this model, we found an approximate 2- fold increase in intracellular arsenic by atomic absorption studies after AAA treatment in PANC-1 cells (data not shown).
AAA's cancer cell specificity, particularly to mutant K-Ras cells, might be at least partially explained by three mechanisms: 1) PC cells with mutant K-Ras generate higher intracellular levels of ROS than cells without mutant K-Ras (4); 2) PC cells have decreased levels of ROS-reducing proteins such as SOD and glutathione peroxidase(5); and 3) the possible role of VDAC in the Warburg effect, that may be targeted by AAA (32). For this latter mechanism, we plan to do additional experiments to examine the relationship between AAA and it's potential activation of the Warburg effect to produce PC cancer cell death.
An alternative and non-exclusive explanation may be that AAA-treated cells are redirected into the aponecrotic pathway by blocking caspase activation and/or decreased ATP levels. Blocking activation of specific caspases or inducing inactivation of active caspases leads to uninhibited PARP activity, which can deplete ATP stores. PARP activity is modulated by caspases, specifically caspases 3 and 7. A seminal study by the lab of S. Snyder found that blocking caspase activity redirected apoptosis to necrosis causing a depletion of energy stores (ADP/ATP) through continual activation of PARP (14). However, we did not find PARP activation from AAA or PARP mediated loss of ATP (data not shown), nor membrane perforations (no LDH loss) (Supp. Fig. S2C), which could cause loss of ATP. However, activated caspase activity could also be inhibited from the high levels of O2.— generated by AAA (35). In other studies, drastic falls in ATP stores immediately preceded and perhaps initiated the switch to necrosis (36).
There may be a therapeutic window for the clinical application of AAA therapy. First, the concentrations of all three drugs are clinically achievable as in the use of ATO/AA for APL and myeloma. In addition, there was only a minor additional cytotoxic effect of AAA to human pluripotent CD 34+ stem cells as compared to ATO alone (8% increase) or to AA alone (14% increase), yet a large increase of cytotoxicity to PC lines (>83% increase). Our studies in nude mice has shown a promising reduction in tumor size with no observable toxic side effects. However, we plan to use an orthotopic imageable model of pancreatic cancer and a PC GEMM model to further strengthen support for the effect of AAA in pancreatic cancer (37-40).
The complete abrogation of AAA's aponecrotic effect by NAC suggests a fail-safe to the clinical translation of this therapy where amelioration of AAA-induced clinical toxicity could be mediated by NAC, as it is used for acetaminophen overdose.
Conceptually, the AAA model represents a shift in therapeutic and mechanistic paradigms where alternate death pathways such as aponecrosis, could be utilized to selectively kill mutant ras cancer cells resistant to apoptosis by classical chemotherapeutic agents. Targeted aponecrosis by AAA has an advantage over necrosis because it retains the specificity of apoptosis for mutant Ras PC cells but allows completion of cell death through the necrotic pathway while relatively sparing normal cells. We have previously termed this “targeted necrosis”(7). The AAA therapy exploits in PC cells their intrinsically high levels of ROS generated by mutant Ras and their intrinsically low levels of detoxification enzymes in PC and overwhelms the PC cell with O2.— radicals along with inhibiting the VDAC machinery which lowers ATP levels, thereby forcing the PC cell into a completed aponecrotic cell death.
Supplementary Material
Acknowledgments
This paper is dedicated to the courage and memory of Linda Berg Goodman and Susan Grant Kaplansky who both died from pancreatic cancer at young ages.
This work was supported by NIH R01 82528, NCI-RC2-CA-148346 ARRA, Berg Family Foundation, The Och Family Foundation, Manelski Family Foundation, R.C. Hayes Pancreatic Cancer Foundation, WAR Award, Herbert Irving Clinical Scholar Award, and Herbert Pardes Scholar Award to R.L. Fine. Grants P42-ES10349 and P30-ES09089 to P. Brandt-Rauf and DOD Prostate Cancer Award PC081075 and Susan Grant Kaplansky Fellowship in Pancreatic Cancer to R.D. Dinnen and R.L. Fine. Grant NIH-RO1CA109525 to G.H. Su.
Footnotes
Running title: Re-directing apoptosis to aponecrosis
Disclosure of Potential Conflicts of Interest: No potential conflicts of interest were disclosed.
References
- 1.Willett CG, Clark JW. Update on combined-modality treatment options for pancreatic cancer. Oncol (Huntington) 2003;17:29–36. [PubMed] [Google Scholar]
- 2.Ishii H, Furuse J, Nagase M, Yoshino M. Impact of gemcitabine on the treatment of metastatic pancreatic cancer. J Gastroenterol Hepatol. 2005;20:62–6. doi: 10.1111/j.1440-1746.2004.03487.x. [DOI] [PubMed] [Google Scholar]
- 3.Finkel E. Does cancer therapy trigger cell suicide? Science. 1999;286:2256–8. doi: 10.1126/science.286.5448.2256. [DOI] [PubMed] [Google Scholar]
- 4.Hileman EO, Liu J, Albitar M, Keating MJ, Huang P. Intrinsic oxidative stress in cancer cells: a biochemical basis for therapeutic selectivity. Cancer Chemother Pharmacol. 2004;53:209–19. doi: 10.1007/s00280-003-0726-5. [DOI] [PubMed] [Google Scholar]
- 5.Cullen JJ, Weydert C, Hinkhouse MM, Ritchie J, Domann FE, Spitz D, et al. The role of manganese superoxide dismutase in the growth of pancreatic adenocarcinoma. Cancer Res. 2003;63:1297–303. [PubMed] [Google Scholar]
- 6.Raha S, Robinson BH. Mitochondria, oxygen free radicals, and apoptosis. Am J Med Genet. 2001;106:62–70. doi: 10.1002/ajmg.1398. [DOI] [PubMed] [Google Scholar]
- 7.Dinnen RD, Drew L, Petrylak DP, Mao Y, Cassai N, Szmulewicz J, et al. Activation of targeted necrosis by a p53 peptide: a novel death pathway that circumvents apoptotic resistance. J Biol Chem. 2007;282:26675–86. doi: 10.1074/jbc.M701864200. [DOI] [PubMed] [Google Scholar]
- 8.Temkin V, Huang Q, Liu H, Osada H, Pope RM. Inhibition of ADP/ATP exchange in receptor-interacting protein-mediated necrosis. Mol Cell Biol. 2006;26:2215–25. doi: 10.1128/MCB.26.6.2215-2225.2006. [DOI] [PMC free article] [PubMed] [Google Scholar]
- 9.Soignet SL, Maslak P, Wang ZG, Jhanwar S, Calleja E, Dardashti LJ, et al. Complete remission after treatment of acute promyelocytic leukemia with arsenic trioxide. N Engl J Med. 1998;339:1341–8. doi: 10.1056/NEJM199811053391901. see comment. [DOI] [PubMed] [Google Scholar]
- 10.Li X, Ding X, Adrian TE. Arsenic trioxide induces apoptosis in pancreatic cancer cells via changes in cell cycle, caspase activation, and GADD expression. Pancreas. 2003;27:174–9. doi: 10.1097/00006676-200308000-00011. [DOI] [PubMed] [Google Scholar]
- 11.Westervelt P, Brown RA, Adkins DR, Khoury H, Curtin P, Hurd D, et al. Sudden death among patients with acute promyelocytic leukemia treated with arsenic trioxide. Blood. 2001;98:266–71. doi: 10.1182/blood.v98.2.266. [DOI] [PubMed] [Google Scholar]
- 12.Bachleitner-Hofmann T, Gisslinger B, Grumbeck E, Gisslinger H. Arsenic trioxide and ascorbic acid: synergy with potential implications for the treatment of acute myeloid leukaemia? Br J Haematol. 2001;112:783–6. doi: 10.1046/j.1365-2141.2001.02608.x. [DOI] [PubMed] [Google Scholar]
- 13.Amadori S, Fenaux P, Ludwig H, O'Dwyer M, Sanz M. Use of arsenic trioxide in haematological malignancies: insight into the clinical development of a novel agent. Curr Med Res Opin. 2005;21:403–11. doi: 10.1185/030079904X20349. [DOI] [PubMed] [Google Scholar]
- 14.Ha HC, Snyder SH. Poly(ADP-ribose) polymerase is a mediator of necrotic cell death by ATP depletion. Proc Nat Acad Sci USA. 1999;96:13978–82. doi: 10.1073/pnas.96.24.13978. [DOI] [PMC free article] [PubMed] [Google Scholar]
- 15.Petersen EN. The pharmacology and toxicology of disulfiram and its metabolites. Acta Psych Scan, Supp. 1992;369:7–13. doi: 10.1111/j.1600-0447.1992.tb03309.x. [DOI] [PubMed] [Google Scholar]
- 16.Nobel CS, Kimland M, Nicholson DW, Orrenius S, Slater AF. Disulfiram is a potent inhibitor of proteases of the caspase family. Chem Res Toxicol. 1997;10:1319–24. doi: 10.1021/tx970131m. [DOI] [PubMed] [Google Scholar]
- 17.Cen D, Gonzalez RI, Buckmeier JA, Kahlon RS, Tohidian NB, Meyskens FL., Jr Disulfiram induces apoptosis in human melanoma cells: a redox-related process. Mol Cancer Thera. 2002;1:197–204. [PubMed] [Google Scholar]
- 18.Abu-Hamad S, Sivan S, Shoshan-Barmatz V. The expression level of the voltage-dependent anion channel controls life and death of the cell. Proc Nat Acad Sci USA. 2006;103:5787–92. doi: 10.1073/pnas.0600103103. [DOI] [PMC free article] [PubMed] [Google Scholar]
- 19.Jakubowski W, Bartosz G. 2,7-dichlorofluorescin oxidation and reactive oxygen species: what does it measure? Cell Biol Int. 2000;24:757–60. doi: 10.1006/cbir.2000.0556. [DOI] [PubMed] [Google Scholar]
- 20.Setsukinai K, Urano Y, Kakinuma K, Majima HJ, Nagano T. Development of novel fluorescence probes that can reliably detect reactive oxygen species and distinguish specific species. J Biol Chem. 2003;278:3170–5. doi: 10.1074/jbc.M209264200. [DOI] [PubMed] [Google Scholar]
- 21.Zhou M, Diwu Z, Panchuk-Voloshina N, Haugland RP. 1. A stable nonfluorescent derivative of resorufin for the fluorometric determination of trace hydrogen peroxide: applications in detecting the activity of phagocyte NADPH oxidase and other oxidases. Anal Biochem. 1997;253:162–8. doi: 10.1006/abio.1997.2391. [DOI] [PubMed] [Google Scholar]
- 22.Halliwell B, Whiteman M. Measuring reactive species and oxidative damage in vivo and in cell culture: how should you do it and what do the results mean? Br J Pharmacol. 2004;142:231–55. doi: 10.1038/sj.bjp.0705776. [DOI] [PMC free article] [PubMed] [Google Scholar]
- 23.Flors C, Fryer MJ, Waring J, Reeder B, Bechtold U, Mullineaux PM, et al. Imaging the production of singlet oxygen in vivo using a new fluorescent sensor, Singlet Oxygen Sensor Green. J Exp Bot. 2006;57:1725–34. doi: 10.1093/jxb/erj181. [DOI] [PubMed] [Google Scholar]
- 24.Mukhopadhyay P, Rajesh M, Yoshihiro K, Hasko G, Pacher P. Simple quantitative detection of mitochondrial superoxide production in live cells. Biochem Biophys Res Commun. 2007;358:203–8. doi: 10.1016/j.bbrc.2007.04.106. [DOI] [PMC free article] [PubMed] [Google Scholar]
- 25.Li Y, Sun X, Wang L, Zhou Z, Kang YJ. Myocardial toxicity of arsenic trioxide in a mouse model. Cardiovasc Toxicol. 2002;2:63–73. doi: 10.1385/ct:2:1:63. [DOI] [PubMed] [Google Scholar]
- 26.Verrax J, Stockis J, Tison A, Taper HS, Calderon PB. Oxidative stress by ascorbate/menadione association kills K562 human chronic myelogenous leukaemia cells and inhibits its tumour growth in nude mice. Biochem Pharmacol. 2006;72:671–80. doi: 10.1016/j.bcp.2006.05.025. [DOI] [PubMed] [Google Scholar]
- 27.Bhadhprasit W, Kodama H, Fujisawa C, Hiroki T, Ogawa E. Effect of copper and disulfiram combination therapy on the macular mouse, a model of Menkes disease. J Trace Elem Med Biol. 2012;26:105–8. doi: 10.1016/j.jtemb.2012.05.002. [DOI] [PubMed] [Google Scholar]
- 28.Yeung TK, Germond C, Chen X, Wang Z. The mode of action of taxol: apoptosis at low concentration and necrosis at high concentration. Biochem Biophys Res Commun. 1999;263:398–404. doi: 10.1006/bbrc.1999.1375. [DOI] [PubMed] [Google Scholar]
- 29.Leist M, Single B, Castoldi AF, Kuhnle S, Nicotera P. Intracellular adenosine triphosphate (ATP) concentration: a switch in the decision between apoptosis and necrosis. J Exp Med. 1997;185:1481–6. doi: 10.1084/jem.185.8.1481. [DOI] [PMC free article] [PubMed] [Google Scholar]
- 30.Mangan PS, Colombini M. Ultrasteep voltage dependence in a membrane channel. Proc Nat Acad Sci USA. 1987;84:4896–4900. doi: 10.1073/pnas.84.14.4896. [DOI] [PMC free article] [PubMed] [Google Scholar]
- 31.Madesh M, Hajnoczky G. VDAC-dependent permeabilization of the outer mitochondrial membrane by superoxide induces rapid and massive cytochrome c release. J Cell Biol. 2001;155:1003–15. doi: 10.1083/jcb.200105057. [DOI] [PMC free article] [PubMed] [Google Scholar]
- 32.Zheng Y, Shi Y, Tian C, Jiang C, Jin H, Chen J, et al. Essential role of the voltage-dependent anion channel (VDAC) in mitochondrial permeability transition pore opening and cytochrome c release induced by arsenic trioxide. Oncogene. 2004;23:1239–47. doi: 10.1038/sj.onc.1207205. [DOI] [PMC free article] [PubMed] [Google Scholar]
- 33.Rossi R, Giustarini D, Dalle-Donne I, Milzani A. Protein S-glutathionylation and platelet anti-aggregating activity of disulfiram. Biochem Pharmacol. 2006;72:608–15. doi: 10.1016/j.bcp.2006.05.021. [DOI] [PubMed] [Google Scholar]
- 34.Leslie EM, Haimeur A, Waalkes MP. Arsenic transport by the human multidrug resistance protein 1 (MRP1/ABCC1). Evidence that a tri-glutathione conjugate is required. J Biol Chem. 2004;279:32700–8. doi: 10.1074/jbc.M404912200. [DOI] [PubMed] [Google Scholar]
- 35.Curtin JF, Donovan M, Cotter TG. Regulation and measurement of oxidative stress in apoptosis. J Immunol Methods. 2002;265:49–72. doi: 10.1016/s0022-1759(02)00070-4. [DOI] [PubMed] [Google Scholar]
- 36.Formigli L, Papucci L, Tani A, Schiavone N, Tempestini A, Orlandini GE, et al. Aponecrosis: morphological and biochemical exploration of a syncretic process of cell death sharing apoptosis and necrosis. J Cell Physiol. 2000;182:41–9. doi: 10.1002/(SICI)1097-4652(200001)182:1<41::AID-JCP5>3.0.CO;2-7. [DOI] [PubMed] [Google Scholar]
- 37.Fu X, Guadagni F, Hoffman RM. A metastatic nude-mouse model of human pancreatic cancer constructed orthotopically with histologically intact patient specimens. Proc Nat Acad Sci USA. 1992;89:5645–9. doi: 10.1073/pnas.89.12.5645. [DOI] [PMC free article] [PubMed] [Google Scholar]
- 38.Bouvet M, Wang J, Nardin SR, Nassirpour R, Yang M, Baranov E, et al. Real-time optical imaging of primary tumor growth and multiple metastatic events in a pancreatic cancer orthotopic model. Cancer Res. 2002;62:1534–40. [PubMed] [Google Scholar]
- 39.Hoffman RM. Orthotopic metastatic mouse models for anticancer drug discovery and evaluation: a bridge to the clinic. Invest New Drugs. 1999;17:343–59. doi: 10.1023/a:1006326203858. [DOI] [PubMed] [Google Scholar]
- 40.Hoffman RM. The multiple uses of fluorescent proteins to visualize cancer in vivo. Nat Rev Cancer. 2005;5:796–806. doi: 10.1038/nrc1717. [DOI] [PubMed] [Google Scholar]
Associated Data
This section collects any data citations, data availability statements, or supplementary materials included in this article.