

Abstract

The muscarinic M3 receptor (M3R) is a Gq-coupled receptor and is known to interact with many intracellular regulatory proteins. One of these molecules is Gβ5-RGS7, the permanently associated heterodimer of G protein β-subunit Gβ5 and RGS7, a regulator of G protein signaling. Gβ5-RGS7 can attenuate M3R-stimulated release of Ca2+ from intracellular stores or enhance the influx of Ca2+ across the plasma membrane. Here we show that deletion of amino acids 304–345 from the central portion of the i3 loop renders M3R insensitive to regulation by Gβ5-RGS7. In addition to the i3 loop, interaction of M3R with Gβ5-RGS7 requires helix 8. According to circular dichroism spectroscopy, the peptide corresponding to amino acids 548–567 in the C-terminus of M3R assumes an α-helical conformation. Substitution of Thr553 and Leu558 with Pro residues disrupts this α-helix and abolished binding to Gβ5-RGS7. Introduction of the double Pro substitution into full-length M3R (M3RTP/LP) prevents trafficking of the receptor to the cell surface. Using atropine or other antagonists as pharmacologic chaperones, we were able to increase the level of surface expression of the TP/LP mutant to levels comparable to that of wild-type M3R. However, M3R-stimulated calcium signaling is still severely compromised. These results show that the interaction of M3R with Gβ5-RGS7 requires helix 8 and the central portion of the i3 loop.
The G protein-coupled receptors (GPCRs) respond to a large variety of extracellular signals and make up the largest receptor gene family. The canonical mechanism of signal transduction initiated by GPCRs involves activation of heterotrimeric G proteins, passing the signal onto effector enzymes and ion channels, which in turn regulate the intracellular concentration of second messengers, i.e., cAMP and Ca2+.1 In addition to G proteins, GPCRs interact with a plethora of molecules, including arrestins, protein kinases, adaptor proteins, PDZ domain-containing proteins, and regulators of G protein signaling (RGS).2 While interactions with G proteins and arrestins are characteristic of essentially all GPCRs, these other accessory proteins interact with only some GPCRs.
Among the known binding partners of GPCRs are regulators of G protein signaling (RGS) proteins, which are GTPase-activating proteins (GAPs) for G proteins, classically serving as negative regulators of GPCR signaling.3,4 Approximately 30 mammalian RGS proteins have been identified and are divided among eight subfamilies on the basis of structural similarities.5 The R7 subfamily of RGS proteins, RGS6, -7, -9, and -11, uniquely form an obligate heterodimer with the G protein β-subunit β5 (Gβ5). All R7 RGS proteins contain an N-terminal DEP (Disheveled, Egl10, and Plekstrin homology) domain, followed by DHEX (DEP Helical EXtension), GGL (G-Gamma-Like), and C-terminal RGS domains. Association of Gβ5 with the R7-RGS GGL domain stabilizes the heterodimer protecting each protein from degradation.6,7 The RGS domain harbors its GAP activity, and the DEP domain facilitates membrane targeting and is involved in protein–protein interactions and possibly selectivity.8−10
Gβ5-RGS7 and Gβ5-RGS9 complexes can interact with some GPCRs, specifically the dopamine D2 receptor (D2R),11 an orphan receptor GPR158,12 and the muscarinic M3 receptor (M3R).6,13−16 There are five muscarinic receptors: in physiological settings, the paradigm is one in which M1, M3, and M5 are coupled to Gαq whereas M2 and M4 are coupled to Gαi.17,18 The Gβ5-RGS7 complex selectively attenuates M3R-stimulated Ca2+ signaling and has no effect on the other muscarinic receptors.15 Accordingly, the unique third intracellular (i3) loop and cytoplasmic tail (c-tail) of M3R selectively bind to the Gβ5-RGS7 complex.15 The i3 loop of M3R is an important region involved in receptor dimerization, G protein recognition, and coupling and interaction with several other proteins.19−23
The proximal portion of the carboxyl terminus of M3R contains an α-helix, which is commonly termed helix 8.24 To date, structural and biophysical evidence suggests that helix 8 is a common feature that plays an important role in GPCR localization and signal transduction.25−30 The conformational dynamics of helix 8 has been shown to be dependent on the ligand and binding partner.29,31 In this study, we used protein interaction analysis, spectroscopy, and signaling assays to delineate the structural basis of M3R signal transduction regulation by the Gβ5-RGS7 complex.
Experimental Procedures
Reagents and Antibodies
Fluo-8 and fura2-AM were from Abcam and Life Techologies, respectively. All other reagents were purchased from Sigma-Aldrich, unless otherwise stated. Rabbit antibody for Gβ5 (1:1000 WB and 1:300 IF) was described previously (REF). Mouse anti-GFP antibody JL-8 was from Clontech (1:3000 WB and 1:1000 IF), and anti-rabbit (1:5000) and anti-mouse (1:3000) secondary antibodies conjugated to horseradish peroxidase were from Jackson Laboratories. Anti-rabbit fluorescein-labeled antibodies (1:400) were from Amersham Biosciences, and the anti-mouse Cy3-labeled antibody (1:400) was from Sigma-Aldrich.
Cloning and Purification of GST-M3R Constructs
All constructs were cloned into the pGEX-2T vector (GE Healthcare) at BamHI and EcoRI sites. The GST fusions (GST-M3CT-K → A, GST-M3CT-CT, GST-M3CT-NT, and GST-M3CT-TP/LP) were made by polymerase chain reaction (PCR) mutagenesis and verified by sequencing. GST fusion proteins were expressed in Escherichia coli and purified on glutathione beads using a standard protocol described previously.16 Briefly, 1 L bacterial cultures were grown to an OD600 of 1.0 at 37 °C. Protein expression was induced with the addition of 0.4 mM IPTG for 1.5–2 h at 30 °C. Cells were pelleted and stored at −80 °C until they were used further. Pellets were resuspended in BugBuster Master Mix lysis buffer (Novagen) supplemented with protease inhibitors (Complete, Roche). Protein solubilization was achieved by adding the ionic detergent N-lauroylsarcosine to a concentration of 1.5% for 10 min at room temperature. N-Lauroylsarcosine was sequestered by Triton X-100 (final concentration of 2%), and the lysate was centrifuged at 19000 rpm and 4 °C for 30 min. Glutathione-Sepharose 4B beads (GE) were incubated with lysate for 2 h and washed with PBS. Bound GST fusion proteins were eluted with 20 mM glutathione, desalted on Sephadex G-25 pre-equilibrated with buffer containing 100 mM Tris-HCl (pH 8.0), 150 mM NaCl, and 15% glycerol, and stored frozen in aliquots at −80 °C. The protein concentration was determined using the Bio-Rad protein assay kit according to the manufacturer’s recommendations with bovine serum albumin as a standard. The concentration of the frozen GST-M3R protein stock was 2.5 mg/mL (∼65 μM). The purity of GST was >90% as determined by sodium dodecyl sulfate–polyacrylamide gel electrophoresis.
Constructs for Expression in Mammalian Cells
Constructs encoding Gβ5 and RGS7 genes were previously described.16 The constructs encoding the human muscarinic M3 receptor gene (M3R) and an N-terminal HA-tagged M3R (HA-M3R) in a pcDNA3.1 vector were purchased from cDNA.org. These constructs were used for subsequent cloning of M3R and HA-M3R mutants [M3RΔ304–390, M3RΔ304–325, M3RΔ324–345, M3RΔ370–390, and M3RTP/LP (see the text)] utilizing PCR mutagenesis techniques.
Cell Culture and Transfection
Chinese hamster ovary (CHO-K1) cells were cultured in F-12K medium with 10% fetal bovine serum and penicillin/streptomycin. Twenty-four hours prior to transfection, cells were seeded on 12 mm glass coverslips, 10 cm plates, or 6-well plates, as required by the experiment, to achieve 50–75% confluency at the time of transfection. Lipofectamine2000 transfection reagent (Life Technologies) was used according to the manufacturer’s guidelines at a 2:1 reagent:DNA ratio. The total amount of DNA for 12 mm coverslip transfections was 0.5 μg and was scaled up according to the relative surface for transfection in larger vessels. The ratio of Gβ5 to RGS7 was always 1:3, and for cotransfection with M3R and Gβ5-RGS7, the DNA ratio was 1:1:3. Empty pcDNA3.1 or LacZ plasmid DNA was used to ensure constant DNA loading in cotransfections. Forty-eight hours after transfection, cells were used for Ca2+ imaging or immunofluorescence studies. For GST pull-down assays, cells were washed in ice-cold PBS and scraped in a hypotonic lysis buffer containing 20 mM Tris-HCl, 5 mM NaCl2, 1 mM MgCl2, 2 mM CaCl2, 1 mM DTT, 1 mM EDTA, 1 mM EGTA, and protease inhibitors, followed by two freeze–thaw cycles at −80 °C and centrifugation for 45 min at 4 °C and 20000g. The resulting supernatant was collected and used in the GST pull-down assay. Fresh lysate was prepared for each experiment.
GST Pull-Down Assay
As previously described,16 Glutathione-Sepharose 4B beads were prewashed with PBS and 0.1% CHAPS, incubated at 4 °C with purified recombinant GST or the GST fusion proteins for 1 h, and washed three times with PBS and 0.1% CHAPS to remove excess protein. The slurry was incubated for 1–2 h at 4 °C on a rotary shaker with the various lysates as determined by the experiment. At the end of the incubation, the beads settled because of gravity, and the supernatant was collected as the unbound fraction. The resin was extensively washed and subsequently eluted with the addition of sodium dodecyl sulfate (SDS)-containing sample loading buffer. In a typical assay, the packed volume of the GST resin was 30 μL, the amount of loaded GST fusion protein was 10 μg, and the volume of the protein lysate was 300 μL. The total protein concentration in transfected cell lysates was 2.5–5.0 mg/mL. The beads were washed three times with 600 μL of PBS and 0.1% CHAPS buffer and eluted with 30 μL of 2× SDS sample loading buffer. The unbound and eluted fractions were resolved by gel electrophoresis and analyzed by Western blotting with chemiluminescent detection. Films were scanned, and densitometric measurements of the bands were calculated using ImageJ.
Immunofluorescence
Transfected CHO-K1 cells grown on glass coverslips were fixed with 4% paraformaldehyde and incubated for 30 min a blocking buffer containing 1% BSA in PBS with or without 0.1% Triton X-100, as determined by the experiment. Antibodies were diluted in blocking buffer and incubated with fixed cells for 30 min each with three washes with PBS between and after antibody incubations. Coverslips were affixed to glass slides using ProLong Gold Antifade with DAPI (Life Technologies). After drying overnight, slides were ready for imaging.
Flow Cytometry
For the analysis of M3R surface expression, transfected CHO-K1 cells were rinsed with PBS and detached by incubation with 1 mM EGTA and 5 mM EDTA in PBS. After cells were washed once in 1 mL of staining buffer [PBS (pH 7.2), 0.5% BSA, and 2 mM EDTA], they were resuspended in 100 μL of staining buffer with 10 μL of mouse anti-HA phycoerythrin-conjugated antibody (130-092-257, Miltenyi Biotec GmbH) and incubated for 10 min in the dark (8 °C). Cells were washed in 2 mL of staining buffer by centrifugation at 300g for 5 min and resuspended in 1 mL of 0.5% formaldehyde in PBS. Flow cytometry was performed using a Becton Dickinson LSR II instrument with 10000 events acquired per sample.
Ca2+ Imaging Microscopy
As previously described,13 transiently transfected CHO-K1 cells grown on 12 mm glass coverslips were washed with culture medium and then incubated at 37 °C in culture medium containing 2 μM fura2-AM for 25 min. After fura2-AM loading, the cells were kept at ambient temperature for no longer than 1.5 h before being imaged. Coverslips were secured in a flow chamber and mounted on the stage of a Nikon TE2000 inverted fluorescence microscope. The cells were continuously superfused by gravity flow with HBSS either with or without CaCl2 and MgCl2 (Life Technologies). As required by the experiment, the flow was switched to agonist-containing HBSS for a specified time and then changed back to agonist-free buffer. Images were collected in real time every 3 s using a 20× UV objective lens and recorded using Metafluor software. The excitation wavelengths were 340 nm (Ca2+-bound) and 380 nm (Ca2+-free), and the emission was set to 510 nm. The 340 nm:380 nm ratio is representative of the intracellular free Ca2+ concentration. The entire field of view was selected as a region of interest (ROI). A typical ROI contained 50–70 cells, of which 30–50 were YFP-positive. The number of cells responding to muscarinic agents varied with agonist concentration but was typically 25–35 in a particular ROI. Traces shown here are averages of two to four independent experiments with three replicate coverslips per experiment.
FLIPR Ca2+ Imaging
Cells were transfected in 10 cm dishes. At 24 h post-transfection, cells were seeded in a black-walled 384-well plate at a density of 10000 cells/well. The Fluo-8 No Wash Calcium Assay kit (Abcam, ab112129) was used according to the manufacturer’s recommendations. With this system, there is no washing step after incubation with the Ca2+ indicator as there is a quenching dye that is not membrane permeant, thus reducing the signal of the extracellular dye. Briefly, growth medium was removed, and cells were washed with Ca2+-free HHBSS (20 mM Hepes in Hanks balanced salt solution). A 2× solution of the Fluo-8 dye was prepared in Ca2+-free HHBSS and 1% plurionic acid. Equal volumes of HHBSS and Fluo-8 were added to the cells and placed in the 37 °C incubator for 30 min. The plate was then allowed to equilibrate to atmospheric conditions for 20 min before being analyzed with the FLIPR Tetra system. A baseline read of plate fluorescence of 10 s was performed prior to the addition of agonist. After agonist application, the fluorescence intensity was recorded every second for at least 3 min.
[3H]NMS Binding Assay
The muscarinic receptor density was determined by the ligand binding assay using the muscarinic antagonist N-methyl scopolamine chloride ([3H]NMS, 84.1 Ci/mmol, PerkinElmer) essentially as previously described.15 Briefly, CHO-K1 cells were transfected in 10 cm dishes with wild-type or mutant M3R. Twenty-four hours after transfection, cells were detached and seeded in 24-well plates at a density of 100000 cells/well, at which time atropine was added where required by the experiment. One day after, cells were washed and incubated with 1 mL of [3H]NMS in HBSS for 30 min at room temperature. The [3H]NMS concentration was 50 nM. Following the incubation, cells were rapidly washed twice with 1 mL of ice-cold buffer and then lysed with 0.25 mL of 0.1 M NaOH added to the wells. This lysate was neutralized with 0.25 mL of 0.1 M HCl; 0.5 mL of 50 mM Hepes (pH 7.2) was added, and the mixture was transferred to the vials for liquid scintillation counting. Triplicate wells were used for each experimental condition. Nonspecific binding was assessed using mock-transfected cells.
cAMP Assay
We used the LANCE Ultra cAMP competitive immunoassay kit (PerkinElmer); 5000 cells were seeded in 10 μL of cell buffer (HBSS, 25 mM Hepes, and 0.1% BSA) onto 384-well microtiter plates. Then, 5 μL of test compound prepared in assay buffer (0.1% BSA, 25 mM Hepes, and 500 μM 3-isobutyl-1-methylxanthine) or buffer alone was added to the appropriate wells, and plates were incubated at room temperature for 30 min. After this incubation, 5 μL of Eu-cAMP (prepared in lysis buffer according to the manufacturer’s protocol) followed by 5 μL of ULight-labeled anti-cAMP in the same buffer was added to each well and incubated for 1 h at room temperature. FRET measurements were performed using the Envision microplate reader (PerkinElmer) at the following wavelengths: 340 nm (with a 30 nm bandwidth) excitation and 671 nm (with a 4 nm bandwidth) emission.
Peptide Synthesis
20-mer wild-type (WT) and mutant (TP/LP) peptides corresponding to the C-terminal tail (residues 548–567) of M3R were commercially obtained from GenScript Corp. The amino acid sequences of these peptides were 548-NKTFRTTFKMLLLCQCDKKK-567 (WT) and 548-NKTFRPTFKMPLLCQCDKKK-567 (TP/LP). Note that residues T553 and L558 and their proline counterparts are depicted in bold font. The peptide concentrations were measured gravimetrically.
Circular Dichroism
Far-UV circular dichroism (CD) measurements were conducted on a Jasco J-815 spectropolarimeter thermostatically controlled at 25 °C. Briefly, 20-mer WT and TP/LP peptides were dialyzed in 10 mM sodium phosphate (pH 7.0), and experiments were conducted on a 50 μM sample of each peptide alone in solution or in the presence of 5 mM n-dodecylphosphocholine (DPC) bicelles (Avanti Polar Lipids). The DPC bicelles were prepared at a stock concentration of 10 mM in 10 mM sodium phosphate (pH 7.0) by being stirred for 2h at 37 °C. Data were collected using a quartz cuvette with a 2 mm path length in the 185–255 nm wavelength range and with a slit bandwidth of 2 nm at a scan rate of 10 nm/min. All data were normalized against reference spectra to remove the contribution of buffer. Each data set represents an average of four scans acquired at 0.1 nm intervals. Data were converted to mean ellipticity, [θ], as a function of wavelength (λ) of electromagnetic radiation using the following equation:
where Δε is the observed ellipticity in millidegrees, c is the peptide concentration in micromolar, and l is the cuvette path length in centimeters.
Molecular Modeling
Structural models of WT and TP/LP peptides (residues 548–567) were built using the MODELER software based on homology modeling.32 In each case, the crystal structure of the CHRM3 receptor (Protein Data Bank entry 4DAJ) harboring helix H8 (residues 548–556) was used as a template.24 For each peptide, a total of 100 atomic models were calculated, and the structure with the lowest energy, as judged by the MODELER Objective Function, was selected for further analysis. The structural models were rendered using RIBBONS.33
Molecular Dynamics
Molecular dynamics (MD) simulations were performed with GROMACS34 using the integrated AMBER99SB-ILDN force field.35,36 Briefly, the structural models of WT and TP/LP peptides (residues 548–567) were each centered in a cubic box and explicitly hydrated with a water layer that extended 10 Å (box size) from the protein surface along each orthogonal direction using the extended simple point charge (SPC/E) water model.37,38 The ionic strength of the solution was set to 100 mM with NaCl, and the hydrated structures were energy-minimized with the steepest descent algorithm prior to equilibration under the NPT ensemble conditions, wherein the number of atoms (N), pressure (P), and temperature (T) within the system were kept constant. The particle mesh Ewald (PME) method39 was employed to compute long-range electrostatic interactions with a spherical cutoff of 10 Å and a grid space of 1.6 Å with a fourth-order interpolation. The linear constraint solver (LINCS) algorithm was used to restrain bond lengths.40 All MD simulations were performed at 300 K under periodic boundary conditions (PBC), to mimic the bulk solvent effect, using the standard “md” leapfrog integrator to solve Newton’s equations of motion with a time step of 2 fs. For the final MD production runs, data were collected every nanosecond over a time scale of 1 μs. All MD simulations were performed on a Linux workstation using parallel processors at the High Performance Computing (HPC) facility within the Center for Computational Science (CCS) of the University of Miami.
Results
Residues 304–345 of the i3 Loop of M3R Are Required for Its Regulation by Gβ5-RGS7
To extend our earlier finding that the M3R i3 loop is required for the interaction with Gβ5-RGS7,15 we created and analyzed several deletion mutants in this region (Figure 1). First, we studied deletion of amino acids 304–390, which were previously identified by a GST pull-down assay as the region involved in the interaction with Gβ5-RGS7.15 Deletion of this region within the full-length receptor (M3RΔ304–390) was tested for sensitivity to Gβ5-RGS7 in the CCh-stimulated Ca2+ signaling assay. Consistent with previous findings,13,15,41 Gβ5-RGS7 reduced the Emax of the M3R-stimulated Ca2+ response to 65% of that of M3R alone (Figure 1A), with little effect on EC50 (Table 1). In contrast, Gβ5-RGS7 could not attenuate CCh-stimulated Ca2+ responses from the M3RΔ304–390 mutant (Figure 1B). Compared to that of WT M3R, the Emax from M3RΔ304–390 was reduced by ∼30%; however, the EC50 remained unchanged. These results indicate that deletion of residues 304–390 did not alter the affinity of CCh for M3R (no change in EC50) but reduced the level of surface expression and/or coupling to Gq (reduced Emax) and abolished attenuation by Gβ5-RGS7. Indeed, quantification of [3H]NMS binding on intact cells overexpressing M3RΔ304–390 showed that its level was lower than that of WT by 60% (Figure 1C). Nevertheless, the dynamic range of Ca2+ responses elicited by M3RΔ304–390 is sufficient to detect inhibition, so our results clearly show that residues 304–390 of the i3 loop are required for the negative effect of Gβ5-RGS7.
Figure 1.

M3R i3 loop deletions abolish its sensitivity to Gβ5-RGS7 regulation. CHO-K1 cells were transiently transfected with WT M3R or the i3 loop deletion mutants (M3RΔ304–325, M3RΔ325–345, M3RΔ370–390, and M3RΔ304–390) in the presence or absence of Gβ5-RGS7 and prepared for Ca2+ imaging using FLIPR as described in Experimental Procedures. Concentration dependencies of the maximal change in Fluo-8 fluorescence from cells expressing WT M3R (A), M3RΔ304–390 (B), M3RΔ304–325 (D), M3RΔ325–345 (E), and M3RΔ370–390 (F) in the absence (black) and presence (blue) of Gβ5-RGS7 stimulated by CCh. Each data point is the mean ± the standard error of the mean of four replicate wells from two independent experiments. Curves were fit using the GraphPad Prism 5 sigmoidal dose–response equation with a variable slope and normalized to the maximal response from cells expressing WT M3R in the absence of Gβ5-RGS7. (C) [3H]NMS binding to WT M3R and M3RΔ304–390 performed on live cells as described in Experimental Procedures. Bar graphs show means ± SD (n = 2).
Table 1. Effects of i3 Loop Deletions on the Sensitivity of M3R to Gβ5-RGS7a.
| M3R |
M3R with Gβ5-RGS7 |
|||||
|---|---|---|---|---|---|---|
| nb | Emaxc,d | –log EC50d,e | nb | Emaxc,d | –log EC50d,e | |
| WT | 80 | 100 ± 3.94 | 6.35 ± 0.13 | 86 | 64 ± 3.15 | 6.00 ± 0.16 |
| M3RΔ304–325 | 60 | 101 ± 3.66 | 6.57 ± 0.14 | 67 | 82 ± 3.11 | 6.56 ± 0.13 |
| M3RΔ325–345 | 63 | 70 ± 2.78 | 6.82 ± 0.13 | 67 | 73 ± 2.37 | 6.24 ± 0.11 |
| M3RΔ370–390 | 64 | 106 ± 2.62 | 6.95 ± 0.08 | 67 | 56 ± 1.60 | 6.66 ± 0.10 |
| M3RΔ304–390 | 36 | 61 ± 4.05 | 5.61 ± 0.23 | 36 | 68 ± 10.33 | 4.90 ± 0.43 |
CCh-induced Ca2+ signaling was measured by FLIPR in cells transfected with different M3R i3 loop deletion mutants as described in the legend of Figure 1 and Experimental Procedures.
n is the number of points analyzed (two independent experiments).
Emax is the maximal change in well fluorescence expressed as a percentage of that of WT M3R (=100%).
Mean ± the standard error of the mean.
–Log EC50 (in molar) is the negative logarithm of the agonist concentration that produces the half-maximal effect.
Recently, we found that the Gβ5-RGS7 complex has a dual effect on M3R-stimulated Ca2+ signaling: while it inhibits the release of Ca2+ from intracellular stores, it can also augment the influx of Ca2+ across the plasma membrane.13 Here, we found that both Ca2+ release and influx components were insensitive to Gβ5-RGS7 regulation in the M3RΔ304–390 mutant (data not shown), indicating that the region of residues 304–390 of M3R is required for Gβ5-RGS7-mediated modulation of both Ca2+ entry pathways.
Analysis of three shorter deletions, M3RΔ304–325, M3RΔ325–345, and M3RΔ370–390, showed that removal of amino acids 304–325 or 325–345 reduced the sensitivity of M3R to the Gβ5-RGS7 complex by 18 or 27%, respectively (Figure 1D–F and Table 1). The deletion of residues 370–390 did not reduce the sensitivity to Gβ5-RGS7 but, interestingly, slightly enhanced attenuation of the Ca2+ response by Gβ5-RGS7. The three smaller i3 loop deletions did not appear to affect receptor surface expression, as the Emax was similar to that of WT M3R (Table 1). Altogether, these experiments have narrowed down the Gβ5-RGS7-sensitizing region of the i3 loop of M3R to residues 304–345.
Integrity of M3R C-Terminal Secondary Structure Is Required for Its Interaction with Gβ5-RGS7
Previous studies in our laboratory revealed that along with the i3 loop, regulation by Gβ5-RGS7 involves the C-terminus of M3R, with both Gβ5 and DEP moieties binding to the recombinant M3R C-tail in vitro.14 To gain insights into the structural features of the C-tail required in this interaction, we generated four GST fusions of the C-tail and tested them in a pull-down assay with the Gβ5-RGS7 complex (Figure 2). First, we first focused on a unique polybasic sequence, 565-KKKRRKK-570 in the middle of the C-tail, which was identified as a region necessary for anti-apoptotic effects of the M3R42 and a site of Gq heterotrimer preassembly.43 In the GST-M3CT K → A construct, the first three Lys residues were replaced with Ala (Figure 2A). We also made two smaller fragments, GST-M3CT NT, which contained the polybasic region, and M3CT CT, which contained the remaining C-tail (Figure 2A). As previously described,15,16 we used lysates from CHO-K1 cells overexpressing YFP-DEP or Gβ5 complex with the RGS7R249 construct missing the DEP and DHEX domains, to probe for interaction of DEP or Gβ5 with the GST fusions, respectively. YFP-DEP exhibited a reduced level of binding to all three GST fusions as compared to that of the full-length C-tail (Figure 2B). For Gβ5 interaction, both the NT and CT fragments exhibited reduced levels of binding (Figure 2C). Thus, the entire C-tail including the polybasic stretch is essential for interaction with the Gβ5-RGS7 complex. Next, we explored whether the secondary structure of the C-tail could be important for its interaction with the Gβ5-RGS7 complex.
Figure 2.

M3R helix 8 is essential for interaction with Gβ5-RGS7. Four GST fusion proteins of the M3R CT were purified from bacteria and tested for interaction with Gβ5-RGS7 in a pull-down assay as described in Experimental Procedures. (A) Amino acid sequences of M3R C-tail GST fusion proteins. The polybasic region is underlined; the substituted Lys-to-Ala residues are shown in bold (K → A), and the truncated fusions are designated as NT and CT. The positions of the two residues, T553 and L558, substituted with Pro are colored red. Purified GST fusions were immobilized on glutathione-Sepharose 4B beads. To analyze the interaction with the DEP domain, lysates from CHO-K1 cells expressing YFP-DEP were applied to protein-coated beads. For Gβ5, constructs encoding Gβ5 and RGS7R249, RGS7 without the DEP domain, were cotransfected to stabilize the Gβ5 protein. The total (T), unbound (U), and eluted (E) material was analyzed by Western blotting using antibodies against YFP or Gβ5 for DEP or Gβ5 detection, respectively. Resulting blots were scanned, and the band density was quantified using ImageJ. (B and D) Average relative density ± SD (n = 3) of DEP detected in each sample normalized to the relative density of DEP in the eluted fraction in the pull down using the WT C-tail. (C and E) Quantification of the average relative density ± SD (n = 3) of eluted Gβ5 in each sample normalized to the relative density of the Gβ5 band in the WT sample.
Crystallographic analysis of M3R confirms that the proximal region of its C-tail adopts an α-helical conformation, commonly termed helix 8.24 To test the idea that Gβ5-RGS7 binding is dependent on the secondary structure of helix 8, we introduced two Pro residues in place of Thr and Leu at positions 553 and 558, respectively. We then expressed this mutant, TP/LP, as a GST fusion protein. We found that the TP/LP mutation nearly abolished binding of the recombinant M3R C-tail to both DEP (Figure 2D) and Gβ5 (Figure 2E).
Biophysical Analysis of Pro-Substituted M3R Helix 8
To understand if the TP/LP mutation indeed affects secondary structure, we conducted far-UV CD analysis on 20-mer wild-type and mutant (TP/LP) peptides spanning helix 8 (Figure 3B,C). Our analysis reveals that the spectra of both WT and TP/LP peptides in aqueous solution are characterized by a negative band centered around 200 nm (Figure 3B), characteristic of peptides predominantly harboring random coil conformation.44,45 However, in the membrane-like environment of DPC bicelles, the WT peptide spectrum exhibits a positive band centered around 190 nm and two negative bands around 208 and 222 nm (Figure 3C, red line). Such a spectral signature is a hallmark of α-helical peptides, which strongly suggests that the WT peptide adopts an α-helical conformation in an apolar membrane-like environment. In sharp contrast, the addition of DPC bicelles to the TP/LP peptide does not alter its spectrum (Figure 3C, black line), implying that double Pro substitution disrupts the α-helix.
Figure 3.

In silico and biophysical analysis of M3R helix 8. (A) Ribbon representation of the structural models of helix 8 of WT (left) and TP/LP peptides (right). For each structural model, helix 8 is colored green, the terminal loops are colored gray, and the side chain moieties of T553/L558 residues and their proline counterparts are colored red. (B) Far-UV spectra of the WT peptide (40 μM) in the absence (black) and presence (red) of 5 mM DPC. (C) Far-UV spectra of the TP/LP peptide (40 μM) in the absence (black) and presence (red) of 5 mM DPC. (D and E) Molecular dynamics simulations for each peptide. Root-mean-square deviations (rmsd) of backbone atoms (N, Cα, and C) within each simulated structure relative to the initial modeled structure of helix 8 of M3R WT (D) and TP/LP (E) as a function of simulation time are shown.
We modeled the structures of WT and TP/LP peptides and conducted molecular dynamics simulations in water solvent (Figure 3D,E). Interestingly, our MD analysis reveals that the WT peptide reaches structural equilibrium with a root-mean-square deviation (rmsd) of ∼7 Å (Figure 3D), implying that it is extremely unstable in water because of its intrinsic structural flexibility. This observation is consistent with our CD data showing that the WT peptide adopts a random coil conformation in aqueous solution and becomes α-helical only in the presence of an apolar membrane. Likewise, the stability of the TP/LP peptide in water is comparable to that of the WT peptide (Figure 3E).
Helix 8 Is Required for M3R Trafficking, Signaling, and Gβ5-RGS7 Interaction
Next, we introduced the TP/LP mutation into the full-length M3R (M3RTP/LP) and tested its sensitivity to Gβ5-RGS7 in the Ca2+ signaling assay (Figure 4). Ca2+ responses to CCh were nearly undetectable in cells transfected with the M3RTP/LP mutant. Because helix 8 is necessary for GPCR trafficking,46−48 we compared the subcellular localization of M3RTP/LP to that of WT M3R. Radioligand binding studies (Figure 5A) and immunological detection of the HA-tagged receptor (Figure 6) revealed that surface expression of M3RTP/LP was severely compromised.
Figure 4.

CCh-stimulated Ca2+ signaling is severely impaired by the M3RTP/LP mutation. Concentration dependencies of the maximal Ca2+ response of WT M3R (black) or M3RTP/LP (red) in the absence (dashed lines) or presence (solid lines) of Gβ5-RGS7 stimulated by CCh using fura2, as described in Experimental Procedures. Each data point is the average ± SD of three coverslips from two independent experiments (n = 6). Curves were fit using the GraphPad Prism 5 sigmoidal dose–response equation with variable slope.
Figure 5.
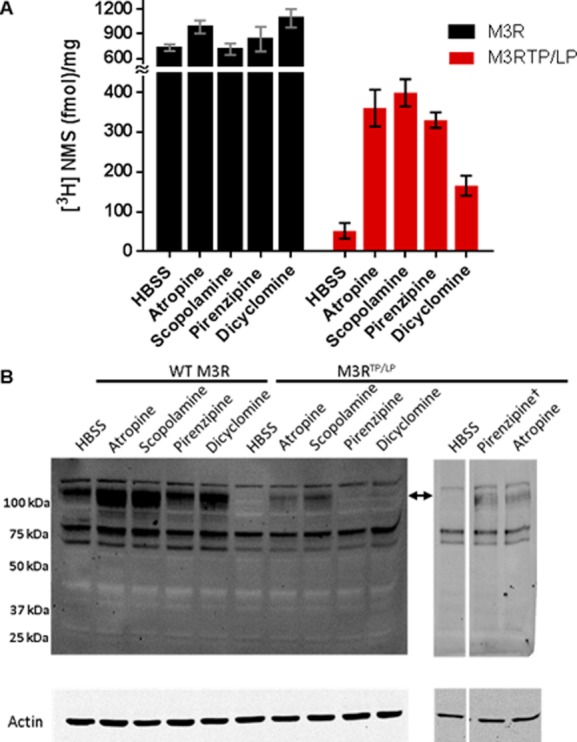
Muscarinic antagonists act as pharmacological chaperones for the M3RTP/LP mutant. (A) [3H]NMS binding to WT M3R (black bars) and M3RTP/LP (red bars) was performed on live cells as described in Experimental Procedures. Antagonists were added to cells for 18 h and washed away prior to incubation with [3H]NMS. All antagonists were used at the final medium concentration of 100 nM, except for pirenzepine, which was used at a concentration of 200 μM. Bar graphs show means ± SD (n = 2). (B) Representative Western blots of cells treated with the indicated antagonists at a concentration of 100 nM. The separate right panel shows cells treated with 200 μM pirenzepine. WT M3R or M3RTP/LP was detected using the anti-HA antibody; the arrow indicates the presumably glycosylated M3R species. The position of the molecular weight standards is indicated to the left. Shown in the bottom panel is a Western blot of the same samples probed for actin as a loading control.
Figure 6.

Atropine treatment greatly enhances M3RTP/LP surface expression. (A) CHO-K1 cells were transfected with M3R or M3RTP/LP tagged with the HA epitope at its N-terminus. Forty-eight hours post-transfection, cells were fixed, immunostained under nonpermeabilizing conditions, and analyzed by fluorescence microscopy using a 60× objective lens. Prior to fixation, cells were incubated with 100 nM atropine for 18 h (right panels). Shown are representative images from two independent transfection experiments. (B–D) Cells were detached, labeled with the phycoerythrine-conjugated anti-HA antibody under nonpermeabilizing conditions, and analyzed by flow cytometry as described in Experimental Procedures. Representative histograms for cells transfected with WT M3R (B) or M3RTP/LP (C), with or without atropine treatment. The X-axis shows the fluorescence intensity of phycoerythrine and the Y-axis the number of cells. The dark gray peak overlaid on each histogram shows staining of nontransfected CHO-K1 cells used as the negative control. The light gray histogram shows HA-positive transfected cells. Vertical blue lines denote the gate for HA-positive cells. (D) Percent of HA-positive cells in the total counted events. Cells transfected with WT M3R are denoted with black bars and those with the M3RTP/LP mutant with red bars [means ± SD (n = 2)]. (E) Median fluorescence intensity (MFI) of HA-positive cells [means ± SD (n = 2)].
It is known that membrane-permeable antagonists can act as pharmacological chaperones, improving surface expression of helix 8 mutants of muscarinic M149 and vasopressin V250 receptors. This effect involves stabilization of the mutant receptor in the endoplasmic reticulum, allowing it to pass quality control of the secretory pathway.51 Here, to facilitate trafficking of M3RTP/LP, we applied the pharmacological chaperone approach pretreating cells with the membrane-permeable muscarinic antagonist atropine. We found that atropine treatment greatly enhanced [3H]NMS binding in cells expressing M3RTP/LP from <2 to ∼50% of WT (Figure 5). Similarly, quantification of cell surface expression of HA-M3R using flow cytometry showed that pharmacological chaperone treatment led to a dramatic increase in the level of M3RTP/LP trafficking (Figure 6). It is worth mentioning that atropine also increased the level of [3H]NMS binding in cells expressing i3 loop mutant M3RΔ304–390 by approximately 2-fold (data not shown).
We also tested if other structurally diverse muscarinic antagonists such as scopolamine, dicyclomine, and pirenzipine were capable of acting as a pharmacological chaperone (Figure 5). We found that cell surface expression of M3RTP/LP, as detected by [3H]NMS binding (Figure 5A), was enhanced by incubation with each antagonist utilized in this study. It is worth mentioning that the pharmacological chaperone effect of pirenzipine was observed only when it was applied above 20 μM. Western blot analysis showed that cells transfected with M3RTP/LP did not display a high-molecular mass species (∼120 kDa) present in cells expressing WT M3R (Figure 5B). Treatment with antagonists caused the emergence of this ∼120 kDa band in M3RTP/LP-expressing cells. This band had a fuzzy appearance, which is characteristic of glycosylated proteins. It was shown earlier for other GPCRs that treatment with pharmacological chaperones results in enhanced glycosylation and trafficking of GPCR mutants.50 Despite the remarkable rescue of M3RTP/LP surface expression by atropine, signaling of the mutant remained severely impaired, and it did not respond to CCh (Figure 7) or six other muscarinic agonists (data not shown).
Figure 7.

Pharmacological chaperoning of M3RTP/LP does not restore CCh-stimulated Ca2+ signaling. Concentration dependency curves of the maximal Ca2+ release response in atropine-pretreated cells to CCh measured by Fluo-8 fluorescence using FLIPR Tetra in the absence of extracellular Ca2+, as described in Experimental Procedures. Cells were transfected with WT M3R (solid black), M3R and Gβ5-RGS7 (dashed black), M3RTP/LP (solid red), or M3RTP/LP and Gβ5-RGS7 (dashed red). The maximal change in fluorescence intensity of four replicate wells was averaged (means ± SD) and plotted for each concentration of CCh. Curves were fit using the GraphPad Prism 5 sigmoidal dose–response equation with variable slope.
Earlier studies have demonstrated that the abnormally high receptor density in overexpression systems allows M3R to couple to other G proteins, including Gs.52 To test whether M3RTP/LP could activate Gs in transfected CHO-K1 cells, we measured cAMP after cells were treated with atropine to enhance its membrane expression. Forskolin-stimulated cAMP accumulation was similar in cells expressing WT or mutant M3R, regardless of the presence of Gβ5-RGS7 (Figure 8A). For WT M3R, CCh-elicited cAMP accumulation had an Emax that was 85% of the forskolin-stimulated response (Figure 8B). Gβ5-RGS7 had no effect on Emax or EC50, approximately 10 μM, which were similar to those obtained in the Ca2+ imaging assay, indicating that the cAMP response was M3R-specific. However, the Emax for M3RTP/LP reached only 10% of that of the WT receptor (Figure 8B). Collectively, our data show that atropine enhances membrane expression of M3RTP/LP, and this mutant is capable of binding ligand; however, coupling to both Gq and Gs is nearly abolished.
Figure 8.

Helix 8 mutant of M3R cannot activate Gs. Cells were transfected and treated with atropine as described in the legends of Figures 6 and 7. Forty-eight hours post-transfection, cells were dissociated, seeded, and analyzed for cAMP accumulation using the ULight competitive cAMP immunoassay kit (PerkinElmer) as described in Experimental Procedures. Cells expressing WT M3R (black) or M3RTP/LP (red) in the absence (solid) or presence (dashed) of Gβ5-RGS7 were stimulated with increasing concentrations of forskolin (A) or CCh (B). Data are presented as the percent response elicited by 10 μM forskolin-treated cells as 100% control and buffer-treated cells as 0% control according to the formula % response = 100[(negative control) – sample]/[(negative control) – (positive control)]. Each point represents the mean ± SD of four replicate wells, and curves were fit using the sigmoidal nonlinear regression equation with variable slope (GraphPad Prism 5.0).
Discussion
Understanding how GPCRs interact with accessory proteins is an important area of signal transduction, cell biology, and pharmacology. In this paper, we extend our previous studies investigating the structural basis of the interaction between the Gβ5-RGS7 complex and M3R. Using a GST pull-down approach, we showed that recombinant fragments of M3R could bind to the Gβ5-RGS7 complex.14 Specifically, a central region of the i3 loop spanning amino acids 304–390 bound the recombinant DEP domain of RGS7 with an affinity similar to that of the full-length i3 loop (residues 253–492). Here, we analyzed four i3 loop deletion mutations in the context of the full-length receptor and found that two deletions in the region of residues 304–345 rendered M3R-stimulated Ca2+ signaling nearly insensitive to Gβ5-RGS7 regulation (Figure 1). Earlier work showed that the i3 loop of M3R interacts with several proteins, including Gq, Gβγ, calmodulin, and SET, and contains a number of phosphorylation sites.19,53−56 Our analyses of the region of residues 304–345 did not reveal homology to other proteins or particular structural features, but Gβγ docking and GRK phosphorylation have been mapped to this region.20 These results suggest that the Gβ5-RGS7 complex may attenuate M3R-stimulated Ca2+ signaling by hindering Gβγ docking.
In addition to the i3 loop, our previous studies indicated that the carboxyl terminus of the receptor (M3R CT) is required for interaction with Gβ5-RGS7. We investigated the importance of two features of M3R CT, the central polybasic stretch, 565-KKKRRK-570, and helix 8. The polybasic region was implicated in inactivate-state preassembly of Gq heterotrimers.43 Therefore, we hypothesized that Gβ5-RGS7 could obstruct this mechanism by competing with Gq for this binding site. However, our pull-down data suggest that there may be a complex interaction at this region as Lys-to-Ala substitution weakens DEP but not Gβ5 interaction (Figure 2). In contrast, we found that amino acid substitutions in helix 8 abolished the interaction with both DEP and Gβ5 (Figure 2D,E). Helix 8 is a common structural motif present in many GPCRs, which is involved in several processes, including membrane trafficking and G protein recognition and activation.57−60 Our circular dichroism spectroscopic experiments and molecular dynamics simulations (Figure 3) support our hypothesis that substitution of two helix 8 residues with Pro destabilizes its α-helical fold. Given that Pro is known to disrupt α-helices, because of its inability to participate in backbone hydrogen bonding, this result may not be surprising. However, the destabilization of helix 8 with the double Pro substitution became apparent only in a phospholipid environment (Figure 3). The dependence of helix 8 folding on the presence of membrane mimetics was previously observed for peptides from cannabinoid and β2 adrenergic receptors61−64 and thus appears to be a common motif among rhodopsin-like GPCRs. Taken together, our results indicate that residues 548–567 of the carboxyl terminus of M3R form an α-helix and suggest that its structural integrity is necessary for interaction with Gβ5-RGS7.
In the course of this study, we found that membrane expression of full-length M3RTP/LP was severely impaired (Figures 5 and 6). This observation is consistent with previous work on helix 8 mutants of V2R and M1R.49−51 To improve surface expression, we applied the pharmacological chaperone approach by treating cells with atropine or other antagonists. Despite the dramatic improvement of M3RTP/LP membrane expression levels (Figures 5 and 6), its Ca2+ signaling remained impaired, with the Emax for CCh reaching only 10% of that of WT in the millimolar range of CCh (Figure 7). These functional studies of M3RTP/LP did not allow us to probe Gβ5-RGS7 regulation without interfering with G protein coupling. Thus, at the moment, our model in which helix 8 plays a role in sensitizing M3R to Gβ5-RGS7 is based on the GST pull-down studies (Figure 2).
Helix 8 is known to participate in conformational changes that occur upon receptor activation.29 Recently, we reported that intrinsic properties of muscarinic agonists can determine the sensitivity of M3R to Gβ5-RGS7 regulation.13 This finding implied that some compounds might stabilize a M3R conformation that is more conducive to Gβ5-RGS7 interaction. Thus, we hypothesized that an agonist other than CCh may overcome the structural instability introduced by the Pro substitutions. However, none of the tested agonists were able to elicit a signal above the CCh response (Figure 7). We also found that the M3RTP/LP mutant was incapable of activating another G protein, Gs (Figure 8). These results indicate that the integrity of helix 8 is essential for G protein coupling.
It is worth noting that in the course of our analyses we found that Gβ5-RGS7 does not inhibit the activation of Gs by the overexpressed WT M3R (Figure 8). This overexpression experiment, although superficial, implies that Gβ5-RGS7 selectively inhibits the Gq/PLC pathway. Consistent with our findings, previous biochemical studies revealed that the complex had no effect on AC activity but reduced PLC-β2 activity.65 Thus, we can speculate that regulation of M3R signaling by Gβ5-RGS7 involves two mechanisms: selective interaction of the complex with M3R and competitive inhibition of PLC-β.
In conclusion, we have demonstrated that the 40 central amino acids in the i3 loop of M3R are necessary for its regulation by the Gβ5-RGS7 complex and found that helix 8 likely plays a role in this interaction. As is the case with other investigated GPCRs, the structural integrity and conformational dynamics of M3R helix 8 are crucial for membrane expression and G protein coupling.
Acknowledgments
We thank Qiang Wang and Alexey Pronin for technical advice and helpful suggestions; Deborah Mash, Chun Wu, and Xiaobin Xie for critical assistance with radioligand analysis; and Shaun Brothers and Claes Wahlestedt for providing access to the FLIPR tetra system.
Glossary
Abbreviations
- ACh
acetylcholine
- CCh
carbachol
- CD
circular dichroism
- D2R
dopamine D2 receptor
- DEP
Disheveled, Egl10, and Pleckstrin homology
- DHEX
DEP helical extension
- DPC
n-dodecylphosphocholine
- GAP
GTPase accelerating protein
- GGL
Gγ-like
- GPCR
G protein-coupled receptor
- GST
glutathione S-transferase
- IPTG
isopropyl β-d-1-thiogalactopyranoside
- LINCS
linear constraint solver
- M2R
muscarinic M2 recpetor
- M3R
muscarinic M3 receptor
- MD
molecular dynamics
- Oxo-M
oxotremorine methiodode
- PME
particle-mesh Ewald
- PBS
phosphate-buffered saline
- RGS
regulator of G protein signaling
- SD
standard deviation
- V2R
vasopressin V2 receptor
- WT
wild type
- YFP
yellow fluorescent protein.
This work was supported by the National Institutes of Health (Grant GM 060019 to V.Z.S. and Grant GM 083897 to A.F.) and American Heart Association Predoctoral Fellowship 10PRE3600004 to D.K.-S.
The authors declare no competing financial interest.
Funding Statement
National Institutes of Health, United States
References
- Rosenbaum D. M.; Rasmussen S. G.; Kobilka B. K. (2009) The structure and function of G-protein-coupled receptors. Nature 459, 356–363. [DOI] [PMC free article] [PubMed] [Google Scholar]
- Bockaert J.; Perroy J.; Becamel C.; Marin P.; Fagni L. (2010) GPCR interacting proteins (GIPs) in the nervous system: Roles in physiology and pathologies. Annu. Rev. Pharmacol. Toxicol. 50, 89–109. [DOI] [PubMed] [Google Scholar]
- Willars G. B. (2006) Mammalian RGS proteins: Multifunctional regulators of cellular signalling. Semin. Cell Dev. Biol. 17, 363–376. [DOI] [PubMed] [Google Scholar]
- Abramow-Newerly M.; Roy A. A.; Nunn C.; Chidiac P. (2006) RGS proteins have a signalling complex: Interactions between RGS proteins and GPCRs, effectors, and auxiliary proteins. Cell. Signalling 18, 579–591. [DOI] [PubMed] [Google Scholar]
- Hollinger S.; Hepler J. R. (2002) Cellular regulation of RGS proteins: Modulators and integrators of G protein signaling. Pharmacol. Rev. 54, 527–559. [DOI] [PubMed] [Google Scholar]
- Witherow D. S.; Wang Q.; Levay K.; Cabrera J. L.; Chen J.; Willars G. B.; Slepak V. Z. (2000) Complexes of the G protein subunit gβ5 with the regulators of G protein signaling RGS7 and RGS9. Characterization in native tissues and in transfected cells. J. Biol. Chem. 275, 24872–24880. [DOI] [PubMed] [Google Scholar]
- Chen C. K.; Eversole-Cire P.; Zhang H.; Mancino V.; Chen Y. J.; He W.; Wensel T. G.; Simon M. I. (2003) Instability of GGL domain-containing RGS proteins in mice lacking the G protein β-subunit Gβ5. Proc. Natl. Acad. Sci. U.S.A. 100, 6604–6609. [DOI] [PMC free article] [PubMed] [Google Scholar]
- Jayaraman M.; Zhou H.; Jia L.; Cain M. D.; Blumer K. J. (2009) R9AP and R7BP: Traffic cops for the RGS7 family in phototransduction and neuronal GPCR signaling. Trends Pharmacol. Sci. 30, 17–24. [DOI] [PMC free article] [PubMed] [Google Scholar]
- Slepak V. Z. (2009) Structure, function, and localization of Gβ5-RGS complexes. Prog. Mol. Biol. Transl. Sci. 86, 157–203. [DOI] [PMC free article] [PubMed] [Google Scholar]
- Anderson G. R.; Posokhova E.; Martemyanov K. A. (2009) The R7 RGS protein family: Multi-subunit regulators of neuronal G protein signaling. Cell Biochem. Biophys. 54, 33–46. [DOI] [PMC free article] [PubMed] [Google Scholar]
- Celver J.; Sharma M.; Kovoor A. (2010) RGS9-2 mediates specific inhibition of agonist-induced internalization of D2-dopamine receptors. J. Neurochem. 114, 739–749. [DOI] [PubMed] [Google Scholar]
- Orlandi C.; Posokhova E.; Masuho I.; Ray T. A.; Hasan N.; Gregg R. G.; Martemyanov K. A. (2012) GPR158/179 regulate G protein signaling by controlling localization and activity of the RGS7 complexes. J. Cell Biol. 197, 711–719. [DOI] [PMC free article] [PubMed] [Google Scholar]
- Karpinsky-Semper D.; Volmar C. H.; Brothers S. P.; Slepak V. Z. (2014) Differential Effects of the Gβ5-RGS7 Complex on Muscarinic M3 Receptor-Induced Ca2+ Influx and Release. Mol. Pharmacol. 85, 758–768. [DOI] [PMC free article] [PubMed] [Google Scholar]
- Sandiford S. L.; Wang Q.; Levay K.; Buchwald P.; Slepak V. Z. (2010) Molecular organization of the complex between the muscarinic M3 receptor and the regulator of G protein signaling, Gβ(5)-RGS7. Biochemistry 49, 4998–5006. [DOI] [PMC free article] [PubMed] [Google Scholar]
- Sandiford S. L.; Slepak V. Z. (2009) The Gβ5-RGS7 complex selectively inhibits muscarinic M3 receptor signaling via the interaction between the third intracellular loop of the receptor and the DEP domain of RGS7. Biochemistry 48, 2282–2289. [DOI] [PMC free article] [PubMed] [Google Scholar]
- Narayanan V.; Sandiford S. L.; Wang Q.; Keren-Raifman T.; Levay K.; Slepak V. Z. (2007) Intramolecular interaction between the DEP domain of RGS7 and the Gβ5 subunit. Biochemistry 46, 6859–6870. [DOI] [PubMed] [Google Scholar]
- Wess J. (1996) Molecular biology of muscarinic acetylcholine receptors. Crit. Rev. Neurobiol. 10, 69–99. [DOI] [PubMed] [Google Scholar]
- Caulfield M. P. (1993) Muscarinic receptors: Characterization, coupling and function. Pharmacol. Ther. 58, 319–379. [DOI] [PubMed] [Google Scholar]
- Simon V.; Guidry J.; Gettys T. W.; Tobin A. B.; Lanier S. M. (2006) The proto-oncogene SET interacts with muscarinic receptors and attenuates receptor signaling. J. Biol. Chem. 281, 40310–40320. [DOI] [PMC free article] [PubMed] [Google Scholar]
- Wu G.; Bogatkevich G. S.; Mukhin Y. V.; Benovic J. L.; Hildebrandt J. D.; Lanier S. M. (2000) Identification of Gβγ binding sites in the third intracellular loop of the M(3)-muscarinic receptor and their role in receptor regulation. J. Biol. Chem. 275, 9026–9034. [DOI] [PubMed] [Google Scholar]
- Wess J.; Liu J.; Blin N.; Yun J.; Lerche C.; Kostenis E. (1997) Structural basis of receptor/G protein coupling selectivity studied with muscarinic receptors as model systems. Life Sci. 60, 1007–1014. [DOI] [PubMed] [Google Scholar]
- Maggio R.; Barbier P.; Fornai F.; Corsini G. U. (1996) Functional role of the third cytoplasmic loop in muscarinic receptor dimerization. J. Biol. Chem. 271, 31055–31060. [DOI] [PubMed] [Google Scholar]
- Hu J.; Thor D.; Zhou Y.; Liu T.; Wang Y.; McMillin S. M.; Mistry R.; Challiss R. A.; Costanzi S.; Wess J. (2012) Structural aspects of M(3) muscarinic acetylcholine receptor dimer formation and activation. FASEB J. 26, 604–616. [DOI] [PMC free article] [PubMed] [Google Scholar]
- Kruse A. C.; Hu J.; Pan A. C.; Arlow D. H.; Rosenbaum D. M.; Rosemond E.; Green H. F.; Liu T.; Chae P. S.; Dror R. O.; Shaw D. E.; Weis W. I.; Wess J.; Kobilka B. K. (2012) Structure and dynamics of the M3 muscarinic acetylcholine receptor. Nature 482, 552–556. [DOI] [PMC free article] [PubMed] [Google Scholar]
- Choi G.; Landin J.; Xie X. Q. (2002) The cytoplasmic helix of cannabinoid receptor CB2, a conformational study by circular dichroism and 1H NMR spectroscopy in aqueous and membrane-like environments. J. Pept. Res. 60, 169–177. [DOI] [PubMed] [Google Scholar]
- Katragadda M.; MacIejewski M. W.; Yeagle P. L. (2004) Structural studies of the putative helix 8 in the human β2 adrenergic receptor: An NMR study. Biochim. Biophys. Acta 1663, 74–81. [DOI] [PubMed] [Google Scholar]
- Choi G.; Guo J.; Makriyannis A. (2005) The conformation of the cytoplasmic helix 8 of the CB1 cannabinoid receptor using NMR and circular dichroism. Biochim. Biophys. Acta 1668, 1–9. [DOI] [PubMed] [Google Scholar]
- O’Dowd B. F.; Alijaniaram M.; Ji X.; Nguyen T.; Eglen R. M.; George S. R. (2007) Using ligand-induced conformational change to screen for compounds targeting G-protein-coupled receptors. J. Biomol. Screening 12, 175–185. [DOI] [PubMed] [Google Scholar]
- Wess J.; Han S. J.; Kim S. K.; Jacobson K. A.; Li J. H. (2008) Conformational changes involved in G-protein-coupled-receptor activation. Trends Pharmacol. Sci. 29, 616–625. [DOI] [PMC free article] [PubMed] [Google Scholar]
- Kuwasako K.; Hay D. L.; Nagata S.; Murakami M.; Kitamura K.; Kato J. (2013) Functions of third extracellular loop and helix 8 of family B GPCRs complexed with RAMPs and characteristics of their receptor trafficking. Curr. Protein Pept. Sci. 14, 416–428. [DOI] [PubMed] [Google Scholar]
- Kirchberg K.; Kim T. Y.; Mol̈ler M.; Skegro D.; Raju G. D.; Granzin J.; Bul̈dt G.; Schlesinger R.; Alexiev U. (2011) Conformational dynamics of helix 8 in the GPCR rhodopsin controls arrestin activation in the desensitization process. Proc. Natl. Acad. Sci. U.S.A. 108, 18690–18695. [DOI] [PMC free article] [PubMed] [Google Scholar]
- Marti-Renom M. A.; Stuart A. C.; Fiser A.; Sanchez R.; Melo F.; Sali A. (2000) Comparative Protein Structure Modeling of Genes and Genomes. Annu. Rev. Biophys. Biomol. Struct. 29, 291–325. [DOI] [PubMed] [Google Scholar]
- Carson M. (1991) Ribbons 2.0. J. Appl. Crystallogr. 24, 958–961. [Google Scholar]
- Van Der Spoel D.; Lindahl E.; Hess B.; Groenhof G.; Mark A. E.; Berendsen H. J. (2005) GROMACS: Fast, flexible, and free. J. Comput. Chem. 26, 1701–1718. [DOI] [PubMed] [Google Scholar]
- Lindorff-Larsen K.; Piana S.; Palmo K.; Maragakis P.; Klepeis J. L.; Dror R. O.; Shaw D. E. (2010) Improved side-chain torsion potentials for the Amber ff99SB protein force field. Proteins 78, 1950–1958. [DOI] [PMC free article] [PubMed] [Google Scholar]
- Hornak V.; Abel R.; Okur A.; Strockbine B.; Roitberg A.; Simmerling C. (2006) Comparison of multiple Amber force fields and development of improved protein backbone parameters. Proteins 65, 712–725. [DOI] [PMC free article] [PubMed] [Google Scholar]
- Toukan K.; Rahman A. (1985) Molecular-dynamics study of atomic motions in water. Phys. Rev. B 31, 2643–2648. [DOI] [PubMed] [Google Scholar]
- Berendsen H. J. C.; Grigera J. R.; Straatsma T. P. (1987) The Missing Term in Effective Pair Potentials. J. Phys. Chem. 91, 6269–6271. [Google Scholar]
- Darden T. A.; York D.; Pedersen L. (1993) Particle mesh Ewald: An N.log(N) method for Ewald sums in large systems. J. Chem. Phys. 98, 10089–10092. [Google Scholar]
- Hess B.; Bekker H.; Berendsen H. J. C.; Fraaije J. G. E. M. (1997) LINCS: A linear constraint solver for molecular simulations. J. Comput. Chem. 18, 1463–1472. [Google Scholar]
- Witherow D. S.; Tovey S. C.; Wang Q.; Willars G. B.; Slepak V. Z. (2003) Gβ5·RGS7 inhibits Gαq-mediated signaling via a direct protein-protein interaction. J. Biol. Chem. 278, 21307–21313. [DOI] [PubMed] [Google Scholar]
- Budd D. C.; Spragg E. J.; Ridd K.; Tobin A. B. (2004) Signalling of the M3-muscarinic receptor to the anti-apoptotic pathway. Biochem. J. 381, 43–49. [DOI] [PMC free article] [PubMed] [Google Scholar]
- Qin K.; Dong C. M.; Wu G. Y.; Lambert N. A. (2011) Inactive-state preassembly of G(q)-coupled receptors and G(q) heterotrimers. Nat. Chem. Biol. 7, 740–747. [DOI] [PMC free article] [PubMed] [Google Scholar]
- Woody R. W. (2009) Circular dichroism spectrum of peptides in the poly(Pro)II conformation. J. Am. Chem. Soc. 131, 8234–8245. [DOI] [PubMed] [Google Scholar]
- Rabanal F.; Ludevid M. D.; Pons M.; Giralt E. (1993) CD of proline-rich polypeptides: Application to the study of the repetitive domain of maize glutelin-2. Biopolymers 33, 1019–1028. [DOI] [PubMed] [Google Scholar]
- Spomer L.; Gertzen C. G.; Schmitz B.; Haussinger D.; Gohlke H.; Keitel V. (2014) A membrane-proximal, C-terminal α-helix is required for plasma membrane localization and function of the G protein-coupled receptor (GPCR) TGR5. J. Biol. Chem. 289, 3689–3702. [DOI] [PMC free article] [PubMed] [Google Scholar]
- Feierler J.; Wirth M.; Welte B.; Schussler S.; Jochum M.; Faussner A. (2011) Helix 8 plays a crucial role in bradykinin B(2) receptor trafficking and signaling. J. Biol. Chem. 286, 43282–43293. [DOI] [PMC free article] [PubMed] [Google Scholar]
- Thielen A.; Oueslati M.; Hermosilla R.; Krause G.; Oksche A.; Rosenthal W.; Schulein R. (2005) The hydrophobic amino acid residues in the membrane-proximal C tail of the G protein-coupled vasopressin V2 receptor are necessary for transport-competent receptor folding. FEBS Lett. 579, 5227–5235. [DOI] [PubMed] [Google Scholar]
- Kaye R. G.; Saldanha J. W.; Lu Z. L.; Hulme E. C. (2011) Helix 8 of the M1 muscarinic acetylcholine receptor: Scanning mutagenesis delineates a G protein recognition site. Mol. Pharmacol. 79, 701–709. [DOI] [PMC free article] [PubMed] [Google Scholar]
- Morello J. P.; Salahpour A.; Laperriere A.; Bernier V.; Arthus M. F.; Lonergan M.; Petaja-Repo U.; Angers S.; Morin D.; Bichet D. G.; Bouvier M. (2000) Pharmacological chaperones rescue cell-surface expression and function of misfolded V2 vasopressin receptor mutants. J. Clin. Invest. 105, 887–895. [DOI] [PMC free article] [PubMed] [Google Scholar]
- Wuller S.; Wiesner B.; Loffler A.; Furkert J.; Krause G.; Hermosilla R.; Schaefer M.; Schulein R.; Rosenthal W.; Oksche A. (2004) Pharmacochaperones post-translationally enhance cell surface expression by increasing conformational stability of wild-type and mutant vasopressin V2 receptors. J. Biol. Chem. 279, 47254–47263. [DOI] [PubMed] [Google Scholar]
- Burford N. T.; Tobin A. B.; Nahorski S. R. (1995) Coupling of muscarinic m1, m2 and m3 acetylcholine receptors, expressed in Chinese hamster ovary cells, to pertussis toxin-sensitive/insensitive guanine nucleotide-binding proteins. Eur. J. Pharmacol. 289, 343–351. [DOI] [PubMed] [Google Scholar]
- Lucas J. L.; Wang D.; Sadee W. (2006) Calmodulin binding to peptides derived from the i3 loop of muscarinic receptors. Pharm. Res. 23, 647–653. [DOI] [PubMed] [Google Scholar]
- Wess J.; Blin N.; Mutschler E.; Bluml K. (1995) Muscarinic acetylcholine receptors: Structural basis of ligand binding and G protein coupling. Life Sci. 56, 915–922. [DOI] [PubMed] [Google Scholar]
- Wu G.; Benovic J. L.; Hildebrandt J. D.; Lanier S. M. (1998) Receptor docking sites for G-protein βγ subunits. Implications for signal regulation. J. Biol. Chem. 273, 7197–7200. [DOI] [PubMed] [Google Scholar]
- Simon V.; Oner S. S.; Cohen-Tannoudji J.; Tobin A. B.; Lanier S. M. (2012) Influence of the accessory protein SET on M3 muscarinic receptor phosphorylation and G protein coupling. Mol. Pharmacol. 82, 17–26. [DOI] [PMC free article] [PubMed] [Google Scholar]
- Aratake Y.; Okuno T.; Matsunobu T.; Saek K.; Takayanagi R.; Furuya S.; Yokomizo T. (2012) Helix 8 of leukotriene B4 receptor 1 inhibits ligand-induced internalization. FASEB J. 26, 4068–4078. [DOI] [PubMed] [Google Scholar]
- Huynh J.; Thomas W. G.; Aguilar M. I.; Pattenden L. K. (2009) Role of helix 8 in G protein-coupled receptors based on structure-function studies on the type 1 angiotensin receptor. Mol. Cell. Endocrinol. 302, 118–127. [DOI] [PubMed] [Google Scholar]
- Tetsuka M.; Saito Y.; Imai K.; Doi H.; Maruyama K. (2004) The basic residues in the membrane-proximal C-terminal tail of the rat melanin-concentrating hormone receptor 1 are required for receptor function. Endocrinology 145, 3712–3723. [DOI] [PubMed] [Google Scholar]
- Kirchberg K.; Kim T. Y.; Møller M.; Skegro D.; Raju G. D.; Granzin J.; Buldt G.; Schlesinger R.; Alexiev U. (2011) Conformational dynamics of helix 8 in the GPCR rhodopsin controls arrestin activation in the desensitization process. Proc. Natl. Acad. Sci. U.S.A. 108, 18690–18695. [DOI] [PMC free article] [PubMed] [Google Scholar]
- Tiburu E. K.; Bowman A. L.; Struppe J. O.; Janero D. R.; Avraham H. K.; Makriyannis A. (2009) Solid-state NMR and molecular dynamics characterization of cannabinoid receptor-1 (CB1) helix 7 conformational plasticity in model membranes. Biochim. Biophys. Acta 1788, 1159–1167. [DOI] [PMC free article] [PubMed] [Google Scholar]
- Choi G.; Guo J.; Makriyannis A. (2005) The conformation of the cytoplasmic helix 8 of the CB1 cannabinoid receptor using NMR and circular dichroism. Biochim. Biophys. Acta 1668, 1–9. [DOI] [PubMed] [Google Scholar]
- Katragadda M.; Maciejewski M. W.; Yeagle P. L. (2004) Structural studies of the putative helix 8 in the human β(2) adrenergic receptor: An NMR study. Biochim. Biophys. Acta 1663, 74–81. [DOI] [PubMed] [Google Scholar]
- Choi G.; Landin J.; Xie X. Q. (2002) The cytoplasmic helix of cannabinoid receptor CB2, a conformational study by circular dichroism and 1H NMR spectroscopy in aqueous and membrane-like environments. J. Pept. Res. 60, 169–177. [DOI] [PubMed] [Google Scholar]
- Posner B. A.; Gilman A. G.; Harris B. A. (1999) Regulators of g protein signaling 6 and 7: Purification of complexes with Gβ5 and assessment of their effects on G protein-mediated signaling pathways. J. Biol. Chem. 274, 31087–31093. [DOI] [PubMed] [Google Scholar]