

Abstract
Antibody CDR H3 loops are critical for adaptive immunological functions. Although the other five CDR loops adopt predictable canonical structures, H3 conformations have proven unclassifiable, other than an unusual C-terminal “kink” present in most antibodies. To determine why the majority of H3 loops are kinked and to learn whether non-antibody proteins have loop structures similar to H3, we searched a set of 15,679 high-quality non-antibody structures for regions geometrically similar to the residues immediately surrounding the loop. By incorporating the kink into our search, we identified 1,030 H3-like loops from 632 protein families. Some protein families, including PDZ domains, appear to use the identified region for recognition and binding. Our results suggest the kink is conserved in the immunoglobulin heavy chain fold because it disrupts the β-strand pairing at the base of the loop. Thus, the kink is a critical driver of the observed structural diversity in CDR H3.
Keywords: Immunoglobulin, CDR H3, Antibody Structure, Protein Structure Prediciton, Protein Design
Introduction
Structural diversity of antibodies is achieved through a highly coordinated, intricate process of genetic recombination and hypermutation through which a relatively small number of genes are able to produce antibodies against an immense array of pathogens. Antibodies consist of two pairs of heavy and light chains linked by disulfide bonds. The N-terminal domains of each chain compose the variable fragment (FV). The FV differs from antibody to antibody and contains the antigen-binding site, which is composed of three complementarity determining region (CDR) loops connecting β-strands from each of the two variable domains on a conserved framework (Alzari et al., 1988; Davies et al., 1990; Jones et al., 1986; Padlan, 1994). Five of the CDR loops (L1–3, H1–2) form a limited number of distinct conformations, while the third CDR loop on the heavy chain (H3) has remained unclassifiable (Al-Lazikani et al., 1997; Chothia and Lesk, 1987; Chothia et al., 1989; North et al., 2011). High structural conservation among antibodies makes it possible to model the framework and the five CDR loops that adopt canonical conformations, but the exceptionally diverse CDR H3 loop evades current methods, thus making structure prediction of the antigen binding region difficult (Almagro et al., 2011; Almagro et al., 2014).
Because the FV is highly conserved, antibodies are an ideal system for both library-based protein engineering techniques and computational protein structure prediction methods (Almagro et al., 2011; Almagro et al., 2014; Barbas et al., 1992; Fellouse et al., 2007; Sidhu and Fellouse, 2006). Library screening and directed evolution techniques have enabled the successful production of engineered antibodies used for sensors and assays as well as novel therapeutics (Buss et al., 2012; Lequin, 2005; Lu et al., 2002; Xu et al., 2013). However, discovery and development of such antibodies remains challenging. Because the CDR H3 loop is largely responsible for the diversity among antibody structures, it is typically critical to antigen binding. Indeed, studies analyzing antibody–antigen complexes noted that CDR H3 was responsible for one third of the antigen–binding contacts and binding energy (Alzari et al., 1988; Kunik and Ofran, 2013). Increased understanding of the factors that govern CDR H3 conformations is vital to the continued development of engineered antibodies.
Because of their high-throughput and low cost, computational methods hold promise to decipher recently developed antibody sequence libraries obtained by high-throughput sequencing techniques (DeKosky et al., 2013; Georgiou et al., 2014; Weinstein et al., 2009) and usher in an era of rationally designed antibodies, but these methods require accurate antibody structure prediction, especially for CDR H3. To date, there have been several antibody structure prediction methods developed to begin to address this issue (Marcatili et al., 2008; Sivasubramanian et al., 2009; Whitelegg and Rees, 2000). Most of these algorithms consist of three major steps: (1) identification of reasonable structural templates for the framework region and the five CDR loops that form canonical conformations; (2) assembly of these templates; and (3) de novo prediction of the H3 loop. The major source of error is the final step (Almagro et al., 2011; Almagro et al., 2014).
The failure of de novo CDR H3 loop modeling is surprising in many cases because of the modest loop lengths at which they occur. It remains unclear why CDR H3 is such a challenging target for current loop modeling algorithms, but one possible explanation is that V(D)J recombination (Tonegawa, 1983) can produce loops that access conformations that are extremely rare in existing protein structural databases. An alternate hypothesis is that the environment formed by the VH and VL domains stabilizes CDR H3 loop conformations that existing methods do not detect as favorable. In either scenario, loop modeling algorithms may not have been trained for, or proven capable of, predicting these structures.
The five non-H3 CDR loops can each be clustered into a small number of “canonical” conformations for each loop length (Chothia et al., 1989; North et al., 2011). While CDR H3 loop structures cannot be described by such canonical conformations, the loop’s C-terminus often contains an unusual “kink” or “bulge,” with the remainder of the structures continuing the β-strand pairing into the loop (“extended”). We refer to these broad categories as having a kinked or extended base geometry. Several studies have been conducted to develop a framework to predict this kink’s presence to aid structure prediction methods (Kuroda et al., 2008; Morea et al., 1997, 1998; Oliva et al., 1998; Shirai et al., 1996, 1999). However, it was recently shown that the rules used for this prediction have not held up as the number of solved antibody structures has grown; the majority of structures contain the kink even when the sequence-based rules would classify the CDR H3 loop as extended (North et al., 2011). More generally, rules intended to aid structure prediction of CDR H3 loops developed from structural analyses are complicated by the fact that the set of solved structures is not a representative set of antibodies (Zemlin et al., 2003).
We recently participated in Antibody Modeling Assessment II (AMA II) (Almagro et al., 2014) and found that Rosetta rarely sample kinked CDR H3 conformations unless we exploited a geometric kink constraint based on Shirai et al.’s description (Shirai et al., 1996; Weitzner et al., 2014). Other participants in AMA II (Almagro et al., 2014; Shirai et al., 2014) and the Web Antibody Modeling server (Whitelegg and Rees, 2000) also use constraints to favor the kinked geometry. In contrast to antibodies, the available score functions prefer the extended base geometry.
In this study we investigate the physical and biological reasons for the majority of CDR H3 loops being kinked, and we determine whether or not the underlying genetic mechanism favors loops capable of adopting conformations not typically observed in non-antibody proteins. To accomplish this, we compared the geometry of the CDR H3 loop anchor regions (not including the residues involved in the kink) to all same-length segments in over 15,000 polypeptide chains. We found that a vast majority of the structures we identified adopted an extended strand-turn-strand conformation, but by incorporating the kink into the search criteria, we identified a diverse set of loops across a wide range of lengths. These loops show that the kinked conformation of CDR H3 loops is common and constitute a starting point for training new loop modeling routines or templates for antibody design. Moreover, our results suggest that the kink is a critical part of the immunoglobulin heavy chain fold that serves to disrupt the β-strand pairing at the base of the CDR H3 loop in order to create structural diversity among loops of the same length. Thus, we believe the C-terminal kink is a key component in generating CDR H3 structural diversity.
Results
Description of CDR H3 base geometry using a 3D transformation from the beginning to the end of the loop
We curated a set of 444 high-quality, non-redundant IgG heavy chains and a set of 15,769 high-quality, diverse chains from the Protein Data Bank (PDB) (Berman et al., 2003). For each heavy chain we computed the three-dimensional transformation between the backbone heavy atoms of the residue immediately preceding the conserved tryptophan after the CDR H3 loop (residue 102 using the Chothia numbering scheme (Chothia and Lesk, 1987)) and the residue immediately following the cysteine before the CDR H3 loop (residue number 93), and we stored the six degrees of freedom in a relational database for future analysis. We refer to these six parameters collectively as a Loop Anchor Transform (LAT). Fig. 1A shows a CDR H3 loop with the relevant residues annotated. Similarly, we calculated the three-dimensional transformation for every 5 to 31-residue window in each chain in the non-antibody set (see supporting methods).
Figure 1.
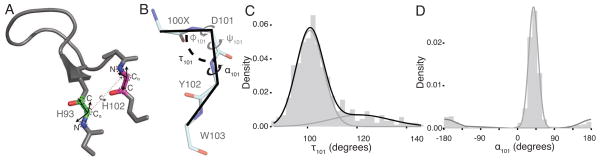
Loop anchor transform and C-terminal kink description. (A) An example CDR H3 loop showing the construction of the loop anchor transform (LAT). Coordinate frames (black) are constructed based on the backbone heavy atom coordinates (black dashed circles) of the N-terminal (green) and C-terminal (magenta) loop anchors. The six degrees of freedom (three translational and three rotational) required to perfectly superimpose the coordinate frames constitute the LAT and are represented as a dashed line connecting the coordinate frames. (B) Annotated antibody kink geometry showing the two angles we defined to describe the kink: (1) τ101, the Cα-Cα-Cα pseudo bond angle for the three C-terminal residues in CDR H3 loops; and (2) α101, the Cα-Cα-Cα-Cα pseudo dihedral angle for the three C-terminal residues in CDR H3 loops and one adjacent residue in the framework. (C) A histogram of τ101 reveals a skewed right distribution. A Gaussian mixture model fitted to the data with an expectation maximization algorithm showed the data can be partitioned into two states with roughly 80% of the data belonging to one distribution, centered at 101°. (D) A histogram of α101 is well represented by a two-state mixture model of von Mises distributions. Approximately 85% of the data lies in the distribution centered at 39°.
The range of structural variation in the CDR H3 LATs is significantly more constrained than that of the non-antibody set from the PDB (Fig. S1 shows 13-residue loops), which is a result of having selected H3 definitions extending to a structurally conserved position of the FV (to facilitate comparisons among such loops). After confirming that the degrees of freedom have a negligible covariance and that the antibody LATs do not vary with length, we fitted a Gaussian distribution to each parameter of the LATs of all of the antibodies across all lengths. We then selected all regions from the PDB set with LAT parameters within 3.0 σ of the mean of each antibody degree of freedom, resulting in 45,940 matches.
Geometric parameters defining the C-terminal kink
We sought a quantitative description of the previously observed C-terminal kink (Kuroda et al., 2008; Morea et al., 1998; North et al., 2011; Shirai et al., 1996, 1999). We first measured the pseudo bond angle of the Cα atoms of the three C-terminal residues (Chothia residue numbers 100x, 101, 102), termed τ101 based on the nomenclature introduced by Levitt in 1976 (Levitt, 1976). Shirai et al. (Shirai et al., 1996) described the kink using θbase, a pseudo dihedral angle of the Cα atoms from Chothia residue numbers 100x, 101, 102 and 103, which we will call α101 (Fig. 1B). Figs. 1C and 1D show the distribution of τ101 and α101 for the antibody set. The τ101 distribution is skewed right and can be accurately modeled as a mixture of two Gaussians, the larger of which encompasses roughly 80% of the data. Structural measurements and visual examination confirmed that the larger distribution is consistent with kinked or bulged structures. The peak of the smaller distribution is consistent with a β-strand or extended conformation. Thus, this parameter is effectively identifying the geometry of the kink.
Because α101 has density near 0° and ± 180°, we modeled it as a mixture of von Mises distributions (Mardia and Jupp, 2000) to account for the periodicity. Similar to the model for τ101, the larger distribution represents about 85% of the structures, but unlike τ101, the distributions constituting α101 have almost no overlap. Thus, these geometric parameters capture somewhat distinct structural features, and we sought to find a combination of the parameters that enables us to classify the base geometry of CDR H3 structures.
Previous sequence-based rules for predicting kinked vs. extended base geometries (Koliasnikov et al., 2006; Kuroda et al., 2008; Morea et al., 1998; Shirai et al., 1996, 1999) posit that these residues’ ability to form hydrogen bonds at key positions is the underlying cause for the formation of the kink. Specifically, the interactions that are considered are: (1) a salt bridge between the side chains of Arg94 and Asp101; (2) a backbone-backbone hydrogen bond between Arg94 and Asp101 that occurs in kinked structures but not in extended structures, where the hydrogen bond is between residues 94 and 102 (typically Tyr102); (3) a hydrogen bond between the Trp103 side-chain and residue 100x (typically Phe100x) carbonyl oxygen; and (4) a second bulge that sometimes occurs further into the loop evidenced by a backbone-backbone hydrogen bond between residues 96 and the fourth residue before the conserved Trp at position 103. We refer to these four interactions as the stabilizing hydrogen bonds, and in Fig. 2, we show a scatterplot of τ101 vs. α101 for the antibody set colored by the number of stabilizing hydrogen bonds. Overall there is a strong correlation between a structure’s τ101 and α101 values and the presence of the stabilizing hydrogen bonds, with the majority of the structures that deviate from the most common values having none of these interactions. However, there is a cluster of structures with τ101 and α101 values of roughly 140° and 30° respectively that form several of the aforementioned hydrogen bonds, demonstrating that these hydrogen bonds alone do not cause the H3 loop to adopt the typical kink formation.
Figure 2.

Scatterplot of τ101 vs. α101 for the antibody set. The gray, shaded regions represent ± 3.0 σ from the mean of the distribution presumed to represent the kinked subpopulation. Each point is colored by number of stabilizing hydrogen bonds in the structure. Although α101 is useful for isolating structures with these hydrogen bonds, there is a small subpopulation of well-hydrogen bonded structures with high values of τ101 (~140°), suggesting that neither τ101 nor α101 alone suffices to describe the kinked conformation. Structures in this region possess a β-bulge at position 101 but resume β-sheet strands C-terminal from the bulge.
Visual inspection of individual antibodies in the kinked, extended, and high-τ101 populations reveals the roles of α101 and τ101. α101 positions the carbonyl group of residue 100x such that it lies in the plane of the base of the loop and points away from it. More generally, this parameter positions the kink relative to the framework of the antibody. τ101 is a measure of the degree to which the loop is kinked; if the loop is not kinked enough (large values), a strand pairing can still occur and if it is too kinked (small values) the stabilizing hydrogen bonds at the base of the loop are not disrupted. Thus, these two parameters describe the kink better when used together, and indicate that 79% of non-redundant antibodies in the PDB contain a kinked H3. Fig. 3 shows the τ101 vs. α101 for the non-antibody loops set and reveals that the kink parameters describe a small subset of these structures.
Figure 3.

Scatterplot of τ101 vs. α101 for the LAT matches. The gray, shaded regions represent ± 3.0 σ from the mean of the τ101 and α101 distributions from antibodies. Unlike the antibody set, there are a considerable number of structures within the range of one of the parameters and not the other.
CDR H3-like regions in non-antibody proteins
We constructed conformation logos – seqLogos made using the DSSP secondary structure assignments (Kabsch and Sander, 1983) – to compare the conformational diversity of sets of structures. Fig 4A and 4B show the conformation logos for all 12-residue H3 loops and all of the 12-residue structures from the PDB set with a LAT consistent with CDR H3 loops. The H3 loops begin and end in an extended conformation, but are very diverse further into the loop, with a majority of structures having loop/coil, turn or 310-helix conformations at each position and very few residues adopting repeating secondary structure conformations (H or E). The set of non-antibody matches identified using the LAT alone does not resemble the CDR H3 loop set structurally, with the set of matches from the PDB consisting almost entirely of strand-turn-strand segments. This is not surprising considering the loop anchor residue locations are in paired β-strands. Because of this, many extended β-strand motifs lacking long coil regions can match the LAT parameters.
Figure 4.

“Conformation Logos” for CDR H3 loops and LAT matches with and without a kink. WebLogo (Crooks et al., 2004) was used with DSSP codes to produce a distribution of secondary structure elements in antibodies and the LAT matches using “E” for extended strand, “G” for 310 helix, “H” for α-helix, “I” for π-helix, “T” for hydrogen bonded turn and “S” for bend, “R” for β-bridge and “L” (loop) for unassignable conformations. Using the LAT parameters alone to select the set of structures results in a set of antibodies with diverse conformations (A) and set of structures from the PDB that are largely consist of strand-turn-strand motifs (B). Including the additional constraint of the τ101 and α101 angles results in a set of LAT matches in the PDB that more closely resembles the distribution in antibodies (D), while the constraint has little effect on the antibody distribution (C).
Since the kink defined by α101 and τ101 is present in a large majority of CDR H3 structures, we restricted the search of the non-antibody structures to include only segments that have a C-terminal kink. The antibodies and the LAT matches from the PDB were filtered to remove structures with τ101 or α101 values beyond 3.0 σ of the mean of the distribution associated with the kink (τ101 = 101° (σ = 5.6°) and α101 = 39° (σ = 11.8°)), which reduced the number of PDB LAT matches by roughly 90% (24,885 LAT matches to 2,207 LAT+kink matches). Figs. 4C and 4D show the result of this filtering process. The conformation logo for the antibodies is nearly unchanged, while the results from the PDB display a very different conformation logo that is now very similar to the antibody set.
Comparison of CDR H3 loops and loop anchor transform matches
Having a similar distribution of secondary structural elements does not mean the LAT matches are necessarily structurally similar to the CDR H3 loops. To illustrate the diversity of the identified PDB segments, Fig. 5 shows structures of 12-residue loops from the antibody H3 set (Fig. 5A) and the 12-residue LAT+kink matches from the PDB (Fig. 5B). The 12-residue segments were chosen for this visual comparison because they are the most common H3 loop length in the dataset. The C-terminal kink can be seen in both sets, and nearly all of the segments identified using the LAT and kink constraint appear to adopt a reasonable H3-like backbone conformation. To assess the degree to which the matches cover the structures of the H3 loops, we computed the root-mean-square deviation (RMSD) of the backbone heavy atom coordinates between the matches and the H3 loops. Fig. 6 shows a cumulative density estimate of the lowest RMSD of a match to each CDR H3 loop. Approximately 10% of CDR H3 loops have a match within 1.0 Å RMSD, and 50% have a match within 2.0 Å RMSD, indicating that the LAT matches do in fact represent CDR H3-like conformations.
Figure 5.

Comparison of CDR H3 and LAT+kink matches. Aligned, superimposed 12-residue CDR H3 loops (A) and 12-residue LAT+kink matches (B) show the similarity between the two sets of structures. The PDZ domain LAT+kink matches across all lengths (C) are included to show the diversity spanned by this particular Pfam alignment. The kink (red-orange) can be clearly seen and both sets occupy similar regions of space. Although some of the outliers may clash with the FV framework, the PDB set could be included in a template-based H3 modeling algorithm.
Figure 6.

Structural similarity of CDR H3 and LAT+kink matches. A cumulative density estimate of the lowest root-mean-square deviation (RMSD) of backbone atomic coordinates of each H3 loop relative to all other H3 loops with a maximum sequence identity of 30% (gray curve), the minimum RMSD of any LAT+kink match relative to each antibody CDR H3 loop (yellow curve) and a random set of LAT matches of the same size and length distribution as the LAT+kink matches (blue curve). The green curve is a cumulative density estimate of the combination of the CDR H3 and LAT+kink sets. Comparisons were limited to H3 loops of 9–20 residues in length (296 H3 loops) to avoid kinematic constraints in loop conformations and to ensure there were a sufficient number of reference CDR H3 structures. Dashed vertical lines at 1.0 and 2.0 Å indicate the frequency of finding a PDB segment that closely matches a known CDR H3 loop conformation. The red dashed line shows that for 50% of H3 loops from length 9–20, there is a structure from the LAT+kink set under 2.1 Å RMSD, and within CDR H3 loops, there is a match within 1.9 Å RMSD in contrast to the 2.8 Å RMSD that would be expected from a set of random loops. Using the combined H3 and LAT+kink set results in the lowest RMSDs overall.
Although there are LAT+kink matches that are structurally similar to CDR H3 loops, it is not clear if they are more similar to CDR H3 loops than other CDR H3 loops. Fig. 6 shows the cumulative density estimate of the minimum RMSD of an H3 loop to another H3 loop, and Fig. S2 shows cumulative density estimates for each loop length being considered. We restricted the loop lengths to 9–20 residues and imposed a maximum sequence identity of 30% to prevent the comparison of different H3 loops that differ only by a small number of point mutations. Fig. 6 shows that roughly 50% of CDR H3 loops are within 1.9 Å RMSD of another CDR H3 loop across all lengths. This may be compared with a figure of 2.1 Å for comparison of H3 structures with LAT+kink matches (Fig. 6). In order to assess the degree to which the kink factors into selecting close structural matches, we constructed a set of random LAT matches of the same size and length distribution as the set of LAT+kink matches. In Fig. 6, the blue curve shows that 50% of CDR H3 loops are within 2.8 Å RMSD of random loops, indicating that requiring the presence of the kink greatly improves the structural similarity to CDR H3 loops. Fig. S2 shows that this relationship is strongly related to the length of the loop being examined. The distribution begins to shift dramatically when the length of the CDR H3 loop exceeds 12 residues. The reasons for this are twofold: (1) longer loops have access to a significantly larger conformational space; and (2) there are fewer solved structures of longer CDR H3 loops. This result shows that a template-based CDR H3 loop modeling routine using only other known CDR H3 loops is unlikely to be successful for long loops. To gain insight on how the LAT+kink matches may lead to improvements in CDR H3 structure prediction, we also include a cumulative density estimate for the combined set of CDR H3 loops and LAT+kink matches (green curve), which shows that identifying templates from non-antibody proteins provides a path to obtaining a set of useful templates for longer CDR H3 loops. The combined set contains more low-RMSD structures than the CDR H3 set or LAT+kink set alone, with 50% of CDR H3 having a match with RMSD ≤ 1.7 A.
Summary of loop anchor transform matches
To assess the degeneracy of the non-antibody LAT matches, we examined the proteins and protein families from which they originate. To determine whether matches originated in similar positions of homologous proteins, we assigned each matching chain a Pfam chain architecture (Finn et al., 2010; Xu and Dunbrack, 2011) and recorded the positions within the Pfam alignments (Xu and Dunbrack, 2012) for each LAT match. Table I compares the number of LAT matches to the number of H3 loops as well as the number of unique Pfam alignments at each length. Whether the LAT matches are broken down by length or taken as a whole, nearly all of the LAT matches originate from a unique match position in a Pfam hidden Markov model. However, when multiple matches originate from the same Pfam, they nearly always align to the same positions in the Pfam, indicating that antibodies are not the only proteins to select for loop structures with the C-terminal kink. There are more than three times as many non-antibody loops as H3 loops with kinked base geometry, with over 200 matches at very long loop lengths (≥ 20 residues). The complete list of matches and their Pfams is available as a downloadable text file (Supplemental File 1). An example of how to use this file to generate a set of coordinates is provided in Supplemental Information.
Table I.
Number of CDR H3 loops, LAT matches and unique Pfam alignments at each loop length. Because we are using alignments to a consensus sequence for each Pfam, matches of different lengths can have the same Pfam description. Note that the total number of unique Pfams is not the sum of the number of unique Pfams broken down by length.
| Length | CDR H3 Loops | LAT+kink Matches | Unique Pfams |
|---|---|---|---|
| 9 | 18 | 27 | 18 |
| 10 | 24 | 221 | 131 |
| 11 | 34 | 143 | 103 |
| 12 | 58 | 123 | 80 |
| 13 | 40 | 25 | 19 |
| 14 | 32 | 72 | 58 |
| 15 | 26 | 49 | 35 |
| 16 | 24 | 57 | 48 |
| 17 | 11 | 34 | 27 |
| 18 | 12 | 26 | 23 |
| 19 | 9 | 22 | 21 |
| 20 | 8 | 32 | 25 |
| >20 | 13 | 199 | 118 |
|
| |||
| Total | 309 | 1030 | 632 |
Seven percent of the matches do not align to any Pfam, indicating that the match does not originate from a structurally conserved region of the protein or that it is beyond the bounds of the Pfam domain definition. Forty percent of the matches align to a Pfam, but this Pfam alignment only occurs once. The remaining 53% come from repeated alignments to the same Pfam, with the most common Pfam alignments being PDZ (23 matches) and peptidase C1 (17 matches). Supplemental File 2 contains a list of all of the Pfams that occur more than once, and lists the number of LAT+kink matches, the number of unique alignment positions as well as the corresponding tags from the Gene Ontology server (Ashburner et al., 2000).
Fig. 5C shows the PDZ LAT+kink matches. The N-terminal strand of the kinked loop forms an anti-parallel β-sheet pairing with the C-terminus of PDZ substrate proteins and, along with a conserved helix, forms the binding region of PDZ domains (Lee and Zheng, 2010). Several structures of PDZ domains in complex with their binding partners confirm that this CDR H3-like region is involved in binding (Fig. 7). In the case of heterodimeric protein substrates (i.e., not peptide substrates or homodimers), residues in the loop region of the kinked H3-like anchor segments are directly involved in domain-domain interactions with the substrates. Interestingly, the matching regions in both PDZ and peptidase C1 domains appear to be involved in recognition and/or binding. Thus, C-terminal kinks are present in a wide variety of non-antibody proteins, and some other protein domain families use this feature for binding and selectivity in the same way as antibodies.
Figure 7.

PDZ domains interacting with substrates through a kinked loop. (A) Superposition of PDZ domains with LAT+kink matches shows that the kink is in a structurally conserved position. The matching region is colored in rainbow with blue at the N-terminus and red at the C-terminus of the loop. The structural diversity of the identified loop is on display. We searched the PDB for PDZ protein substrate heterodimers and found examples of the matching loop being involved in binding: (B) the N-terminal PDZ domain of harmonic in complex with Usher syndrome type-1G protein (3k1r) (Yan et al., 2010) (C) Alpha-1 Syntrophin (PDZ containing) in complex with neuronal nitric oxide synthase (1qav) (Hillier et al., 1999) (D) Periplasmic serine endoprotease DegP (PDZ containing) in complex with lysozyme C (3otp) (Kim et al., 2011). In this view, the substrate is blue with the C-terminal residues shown in spheres and the PDZ containing chain is pale green. The matching loop is shown in orange and all contacts between the substrate and the loop are shown in magenta. Other contacts within 5.0 Å between the PDZ domain and the substrate are colored yellow.
Using our description of the kink, we tested the predictive power of the identity of the base residues at positions 94 and 101, which are frequently Arg and Asp respectively in antibodies. Table S1 shows the percentage of kinked CDR H3 loops with all combinations of the presence or absence of the supposed stabilizing base residues. In agreement with North et al., who used a Ramachandran-based criterion for identifying the kink (Figs. S3 and S4), we find that the majority of CDR H3 loops are kinked even when none of these residues are present. We also applied the rules developed in a study by Kuroda et al. (Kuroda et al., 2008), which constitutes the most detailed analysis of explicit interactions among the H3-base residues, residues within the kink, and tertiary interactions with light chain residues (Table S2). The accuracy of these rules is 88.9%, which agrees with the published value of 89%. However, when one classification dominates a population, balanced accuracy (BACC) is a more meaningful measurement of the performance of a model (Wei and Dunbrack, 2013). While 94.2% of kinked structures are correctly predicted, only 46.2% of extended structures are identified as such, which results in a balanced accuracy of 70.3%. Because the percentage of correctly predicted extended structures is less than 50%, we conclude that the sequence-based rules do not fully explain the presence or absence of the kink.
Additionally, we examined the flanking regions of the LAT and LAT+kink matches and found that the LAT effectively constrains the environment to a β-strand scaffold (Fig. S5). We investigated the CDR H3-like non-antibody loops for the presence of these stabilizing residues and observed neither the Arg Asp combination nor the tryptophan at the equivalent of position 103. In fact, the sequences of the LAT matches and the LAT+kink matches do not show any preferences at the base of the loops that would explain the presence or absence of the kink (Fig. S6).
Local interactions at apex of CDR H3 loops
Extended CDR H3 conformations often consist of a continuation of the β-strands at the base of the loop. As shown in Fig. 4, this extended conformation is much more common than a kinked base geometry in most proteins. It has been established that β-strands are geometrically compatible with the “mirror image” turn types (types I′ and II′) that strongly prefer glycine in central positions (Sibanda et al., 1989; Sibanda and Thornton, 1985). Since all of the loops must change direction to maintain a continuous backbone, nearly all of them contain at least one β-turn, but the position of the β-turn may be restricted by the base geometry. Thus, we hypothesized that glycine in a central position may be indicative of an extended conformation. The effect of glycine position in extended CDR H3 loops has been incorporated into previous CDR H3 classification rules (Kuroda et al., 2008; Shirai et al., 1999), but the predictive significance of glycine in central positions has not been investigated.
Fig. S7 shows density estimates of glycine position within CDR H3 loops and LAT matches split up by base geometry. Within CDR H3 loops, glycine residues are preferred on the N-terminal side of the loop in kinked structures. For structures with an extended or unclear base geometry, they are preferred in more central positions. The PDB LAT matches prefer glycine in more central positions for kinked structures, which is likely a consequence of averaging the result of disparate evolutionary pathways. This result supports our hypothesis, but the dearth of extended CDR H3 structures at various lengths precludes using this result predictively.
Discussion
CDR H3 is the most diverse region in antibodies due to its position relative to the V(D)J recombination sites, junctional diversification at these sites, and somatic hypermutation. Accordingly, the CDR H3 loop often plays a central role in antigen recognition and is a major contributor to binding strength. The success of several therapeutic antibodies and the advent of next-generation sequencing techniques have led to an increased interest in computational antibody structure prediction and design. While there has been progress in these efforts, accurate modeling of CDR H3 has remained challenging, leading us to question whether (1) the diversification of CDR H3 can lead to extremely rare conformations; or (2) there are environmental factors encoded into the FV. Our results indicate that CDR H3-like conformations, while not common, occur with some regularity, occurring in 7.4% of 5,783 Pfams and 6.0% of the 15,769 chains in the non-antibody set. Environmental factors are most likely responsible for kink stabilization.
We identified 1,030 protein segments of at least 9 residues from 632 distinct Pfam alignments that match the same 3D transformation as the anchors of the H3 loop and include the C-terminal kink motif that is common in antibodies. Without the inclusion of the kink in our search criteria, most of the matches are extended strand-turn-strand conformations, suggesting that adopting CDR H3-like conformations is unusual. This is helpful for understanding why de novo loop structure prediction of CDR H3 tends to produce models with extended base geometry and indicates that using constraints for this purpose is likely a wise course of action. In fact, when prediction algorithms use fragment or template-based approaches, the libraries are predominantly composed of structures that do not adopt the kinked base geometry, making it challenging to identify appropriate conformations. The data presented here can be used to enrich fragment or template libraries effectively.
For example, RosettaAntibody accounts for the kink either by using a curated set of fragments or by filtering H3 loops with poor kink geometry (Sivasubramanian et al., 2009; Weitzner et al., 2014). Here we have established a more detailed geometric description of the kink and identified a significantly larger set of structures from which fragments can be selected. Both results can be used as a starting point for improving de novo CDR H3 loop structure prediction.
The set of identified loops with LAT and kink matches contains close structures (≤ 2.0 Å) for roughly 50% of H3 loops 9–20 residues in length, showing that CDR H3 loops do not adopt conformations that are inaccessible to loops in other proteins. In most Pfams, kinked loops appear to arise only in some family members, while in others they are highly conserved structural features. One such protein family, PDZ domains, has evolved a motif for protein recognition and binding that is strikingly similar in structure and function to CDR H3. The appearance of the kink irrespective of the presence of the stabilizing residues indicates that environmental factors are crucial to kink formation.
Furthermore, we have produced a set of H3-like structures of a wide variety of lengths from non-antibody proteins. Across all loop lengths, and especially for long loop lengths, there are more potential template loops from non-antibody structures than from antibody structures. If the quality and homology constraints that were used to cull the PDB were relaxed, it is likely we would identify even more, albeit lower quality, H3-like regions in non-antibody proteins. This set of structures could be incorporated into a database that could be used to assist CDR H3 structure prediction by threading the sequence of interest onto many possible H3-like backbones, analogous to successful database-based methods for loop structure prediction (Choi and Deane, 2010; Holtby et al., 2013; Michalsky et al., 2003; Tramontano and Lesk, 1992; Tyka et al., 2012; van Vlijmen and Karplus, 1997). The green curve in Fig. 6 shows that supplementing known CDR H3 loops with the LAT+kink matches results in a set of template structures that contains more structures with low-RMSDs to CDR H3 loops than either set alone.
Another possible use for this set of structures is in the field of computational antibody design. The extremely large sequence and conformational spaces of long loops often make incorporating backbone motions into design methods infeasible. Effective sampling is further complicated if docking simulations are desired, as may be the case in designing a binding region such as CDR H3. The large number of PDB matches at long loop lengths for which there are few or no H3 loops provides an opportunity to present multiple H3-like scaffolds for fixed and flexible backbone design routines. Using the provided scripts and instructions included in Supplemental Information, a set of all of the backbone coordinates of the LAT+kink matches can be extracted and used for novel design routines. Thus, it is expected that the identified structures will improve antibody design.
Conclusion
This is the first study to our knowledge that uses non-antibody loops to analyze CDR H3 structures, which required developing the most detailed description of the CDR H3 loop to date (LAT+kink). While the kink has been discussed in the past (Kuroda et al., 2008; Morea et al., 1998; North et al., 2011; Shirai et al., 1996, 1999), previous descriptions were more useful for classifying CDR H3 loops than as a rigorous description of the geometry, as demonstrated by various failures in CDR H3 prediction attempts. For example, we observed that the previous kink geometrical description can be satisfied in multiple ways (Weitzner et al., 2014). Our work shows that the residues that had been previously indicated in kink formation are not present in kinked structures from non-antibody proteins (Fig. S6). In fact, no local interactions among the loop residues fully explain the presence of the kink. Instead, we are led to the conclusion that the Ig heavy chain fold stabilizes the kink, and thus it is the extended H3 structures that are the exceptions and not the kinked loops. Whereas previous studies have explained the presence of the kink as a “strange” structural feature, we show here that the kink is not strange; it is found in a wide range of proteins, and some other proteins even conserve it and use it in diverse loops that are involved in binding.
All of our results lead to our hypothesis of why the kinked base geometry is preferred: it is an agent of loop diversification. The C-terminal kink in H3 loops disrupts the β-strand pairing, allowing increased structural diversity with the same number of residues. In other words, if it were not for the kink, most sequences would form extended strand-turn-strand conformations, giving little structural diversity, but with a kink, many structures of similar free energy can form instead. Such a feature is advantageous to an antibody undergoing somatic hypermutation to improve affinity and specificity to a newly introduced antigen. For this reason, we believe the heavy chain fold has been selected to form the kink, and it is only in rare circumstances that the extended geometry is energetically favorable compared to the kinked conformation.
Methods
Datasets
A set of IgG heavy chain V domains, constructed and filtered as described by North et al. (resolution ≤ 2.8 A, backbone B-factor ≤ 80.0 A2, no missing coordinates, no cis-non-Proline residues, conformational energy ≤ 9.5) (North et al., 2011), was further filtered for redundancy by removing structures with CDR loops of identical length with either a single residue difference or no differences in sequence. Using the PISCES web server (Wang and Dunbrack, 2005) a diverse set of high quality non-antibody protein chains was obtained by searching the PDB (Berman et al., 2003) for chains with maximum sequence identity of 70%, a resolution of 2.2 Å or better, and a maximum R-value of 0.25. Before recording results, segments with high B-factors in backbone atoms (> 80.0 Å2) were filtered out.
Loop anchor transform calculation
Unlike other investigations of CDR H3 structures (Kuroda et al., 2008; Morea et al., 2000; Morea et al., 1997, 1998; North et al., 2011; Oliva et al., 1998; Reczko et al., 1995; Shirai et al., 1996, 1999), this study focuses on comparing CDR H3 loops to non-antibody proteins rather than restricting the comparison to other antibodies. For this reason, we developed a description of the CDR H3 loop environment based on structure independent of sequence. The definitions used by North et al. (North et al., 2011) (residue numbers 93–102 using the Chothia numbering scheme (Chothia and Lesk, 1987)) were used to identify the terminal residues on the CDR H3 loop. A coordinate frame was defined using the main chain backbone atoms (N, Cα, C) of each of these residues such that the z-axis is the unit vector along the Cα-C bond, the x-axis lies in the N-Cα-C plane and the direction is the vector product of the and directions. The six degrees of freedom of the 3D transformation of the C-terminal coordinate frame onto the N-terminal coordinate frame together compose what we term the loop anchor transform (LAT). The covariance for each pair of degrees of freedom revealed that each degree of freedom could be treated independently (see Supplemental Methods).
Features analysis
LATs were calculated using the feature analysis framework (Leaver-Fay et al., 2013) within the Rosetta software suite (Leaver-Fay et al., 2011). A custom feature reporter was developed to compute (1) LATs for every 5–31 residue window in each chain in the non-antibody dataset and (2) the Cα-Cα-Cα pseudo bond angle of the last three residues in each window. The results were saved to a relational database (http://www.sqlite.org). Analysis scripts were developed to display distributions of the results using the ggplot2 (Wickham, 2009) library in R (R Development Core Team, 2010). The resulting database was then queried to identify regions of proteins with LATs and bond angles within ± 3.0 σ of the mean of the distributions developed from the antibody dataset.
Primary & secondary structure analysis
Sequence and secondary structure comparisons were performed using a local copy of WebLogo (Crooks et al., 2004). When comparing secondary structures, the DSSP code (Kabsch and Sander, 1983) is used in place of the one-letter amino acid abbreviation. Due to limitations of WebLogo, the “B” DSSP code (β-bridge) and a blank DSSP code are represented as “R” and “L”, respectively.
Supplementary Material
Figure S1, related to Figure 1: Density estimates for each of the six degrees of freedom of the loop anchor transform for each 13-residue segment from (1) the culled PDB set (gray); and (2) the known CDR H3 loops (black) show the relative structural diversity between the two sets. The tightness of the H3 distributions indicates the defined CDR H3 anchor points at structurally conserved positions, while the diffuse distributions from the PDB show the structural diversity of 13-residue segments in the other proteins. Because the six degrees of freedom are not covariant, each can be considered independent and modeled with a Gaussian distribution. These six Gaussian distributions are used to extract a set of non-antibody regions that match the span and orientation of the CDR H3 loop anchors.
Figure S2, related to Figure 6: Cumulative density estimate for minimum root-mean-square deviation (RMSD) of backbone atomic coordinates for each H3 loop relative to all other H3 loops ranging from 9–20 residues with a maximum sequence identity (SID) of 30% (gray curve) and the minimum RMSD of any LAT+kink match relative to each antibody CDR H3 loop (yellow curve), a random set of LAT matches of the same size and length distribution as the LAT+kink matches (blue curve) and the union of the H3 loop and LAT+kink match sets (green curve) split up by length. Dashed vertical lines at 1.0 and 2.0 Å indicate the fraction of structurally similar H3 loops at each cutoff. As the loop length increases, so does the distribution of minimum RMSDs, showing that longer H3 loops are more diverse. These data underscore the difficulty of developing a template-based modeling method for long H3 loops and show that using the LAT+kink matches improves the coverage of known CDR H3 loops.
Figure S3, related to Figure 2: Ramachandran plots for four N-terminal residues of H3 loops (left) and LAT matches (right), beginning with the residue preceding the N-terminal loop anchor. In antibodies (A) this residue is the Cysteine that precedes H3 loops and is structural conserved, but in the LAT matches (B), this residue is free to adopt an extremely wide variety of conformations. At the H93 (or equivalent) position, the antibodies (C) are again structurally conserved, but now the LAT matches (D) are almost entirely restricted to the β region of the plot because this is the anchor residue that we use to identify LAT matches. The next two positions show the antibodies (E and G) beginning to broaden as further into the loop and the LAT matches (F and H) return to an extremely diverse set of conformations.
Figure S4, related to Figure 3: Ramachandran plots for four C-terminal residues of H3 loops (left) and LAT matches (right), ending with the residue following the C-terminal loop anchor. At the position furthest into the loop, the antibodies (A) and the LAT matches (B) both show conformational diversity. However, the penultimate residue shows the antibodies (C) and the LAT matches (D) confined to different regions of Ramachandran space based on the loop base geometry. Extended loops lie in the β region while kinked loops are in the α conformation. Interestingly, loops with indeterminate base geometry lie in the β, α and the Lα regions, showing that dihedral angles alone cannot be used to classify base geometry. Position H102 is the C-terminal loop anchor, and, as with the N-terminal loop anchor, most structures are confined to the β region of the plot. After the loop ends, the antibodies (G) exhibit almost no conformational diversity while the LAT matches (H), while biased toward β have density in a much larger region of the plot.
Figure S5, related to Figure 4: “Conformation Logos” for the loop anchors and three flanking residues on either side for (A) all LAT matches, and (B) LAT+kink matches. In both cases, positions 1, 2 and 3 correspond to N - 3, N - 2 and N - 1; position 4 is the N-terminal loop anchor; position 5 is the C-terminal loop anchor; and positions 6, 7 and 8 correspond to C + 1, C + 2 and C + 3. Approximately 84% of LAT match environments and 90% of LAT+kink match environments are extended β strands. The distributions are nearly identical in LAT matches and LAT+kink matches.
Figure S6, related to Figure 5: Sequence Logos for CDR H3 loops and LAT matches. Using the LAT parameters alone to select the set of structures results in a set of antibodies with clear sequence conservation at the termini and very little conservation in the central positions (A) and set of structures from the PDB that have no clear sequence preferences save for a small Glycine signal in the central-most positions (B). Including the additional constraint of the τ101 and α101 angles does not alter the antibodies (C), while the constraint has a small, but noticeable effect on the PDB sequence distribution (D). However, there is still no detectable signal and the residues typically associated with kink formation in antibodies are not observed in the LAT+kink set.
Figure S7, related to Figure 7: Density estimates for glycine positions in CDR H3 loops and LAT matches. The data are split up by base geometries using the τ101 and α101 values for the loop. The data are further split up by the parity of the loop length because defining a central position differs between the two sets.
Table S1, related to Figure 4: The number of and percentage of antibodies that are kinked for all combinations of residues implicated in kink formation. As found earlier [1], regardless of the presence of the stabilizing residues, the majority of CDR H3 loops are kinked.
Table S2, related to Figure 4: Statistical analysis of H3-classification rules proposed by Kuroda et al. [4]. Because the majority of structures are kinked, predicting an extended structure is considered a positive prediction. In our analysis we have a third base geometry: unclear. Those structures are excluded from this calculation to ensure that only structures where both analyses agree on how the base geometry should be classified are considered. Also left out are 23 structures that only have a heavy chain in the crystal (either because only the FV was crystallized or because it is the structure of a VHH) and require using light chain residues to apply the rules. Within this group, 20 structures are kinked and the other 3 are extended, but we cannot apply the rules to these structures so they are not included in the analysis below.
Acknowledgments
The authors would like to acknowledge Qifang Xu for providing alignments of LAT+kink matches to Pfam HMMs, Matthew J. O’Meara for assistance with the Rosetta features analysis framework, Christopher R. Shaffer, Andrew P. Leaver-Fay and Daisuke Kuroda for helpful discussions, and Danielle C. Hein and Robert Schleif for providing critical feedback on the manuscript. This work was supported by National Institutes of Health Grants R01 GM084453 to RLD and R01 GM078221 to JJG.
Footnotes
Author contribution statement
BDW designed experiments, created databases, wrote code, analyzed and interpreted data and wrote the manuscript. RLD and JJG supervised the project, designed experiments, interpreted data, and critically revised the manuscript.
Conflict of interest statement
The authors declare no conflict of interest.
Publisher's Disclaimer: This is a PDF file of an unedited manuscript that has been accepted for publication. As a service to our customers we are providing this early version of the manuscript. The manuscript will undergo copyediting, typesetting, and review of the resulting proof before it is published in its final citable form. Please note that during the production process errors may be discovered which could affect the content, and all legal disclaimers that apply to the journal pertain.
References
- Al-Lazikani B, Lesk AM, Chothia C. Standard conformations for the canonical structures of immunoglobulins. J Mol Biol. 1997;273:927–948. doi: 10.1006/jmbi.1997.1354. [DOI] [PubMed] [Google Scholar]
- Almagro JC, Beavers MP, Hernandez-Guzman F, Maier J, Shaulsky J, Butenhof K, Labute P, Thorsteinson N, Kelly K, Teplyakov A, et al. Antibody modeling assessment. Proteins. 2011;79:3050–3066. doi: 10.1002/prot.23130. [DOI] [PubMed] [Google Scholar]
- Almagro JC, Teplyakov A, Luo J, Sweet RW, Kodangattil S, Hernandez-Guzman F, Gilliland GL. Second Antibody Modeling Assessment (AMA-II) Proteins. 2014;82:1553–1562. doi: 10.1002/prot.24567. [DOI] [PubMed] [Google Scholar]
- Alzari PM, Lascombe MB, Poljak RJ. Three-dimensional structure of antibodies. Annu Rev Immunol. 1988;6:555–580. doi: 10.1146/annurev.iy.06.040188.003011. [DOI] [PubMed] [Google Scholar]
- Ashburner M, Ball CA, Blake JA, Botstein D, Butler H, Cherry JM, Davis AP, Dolinski K, Dwight SS, Eppig JT, et al. Gene ontology: tool for the unification of biology. The Gene Ontology Consortium. Nature genetics. 2000;25:25–29. doi: 10.1038/75556. [DOI] [PMC free article] [PubMed] [Google Scholar]
- Barbas CF, Bain JD, Hoekstra DM, Lerner RA. Semisynthetic combinatorial antibody libraries: a chemical solution to the diversity problem. Proc Natl Acad Sci USA. 1992;89:4457–4461. doi: 10.1073/pnas.89.10.4457. [DOI] [PMC free article] [PubMed] [Google Scholar]
- Berman H, Henrick K, Nakamura H. Announcing the worldwide Protein Data Bank. Nat Struct Biol. 2003;10:980. doi: 10.1038/nsb1203-980. [DOI] [PubMed] [Google Scholar]
- Buss NA, Henderson SJ, McFarlane M, Shenton JM, de Haan L. Monoclonal antibody therapeutics: history and future. Curr Opin Pharmacol. 2012;12:615–622. doi: 10.1016/j.coph.2012.08.001. [DOI] [PubMed] [Google Scholar]
- Choi Y, Deane CM. FREAD revisited: Accurate loop structure prediction using a database search algorithm. Proteins. 2010;78:1431–1440. doi: 10.1002/prot.22658. [DOI] [PubMed] [Google Scholar]
- Chothia C, Lesk AM. Canonical structures for the hypervariable regions of immunoglobulins. J Mol Biol. 1987;196:901–917. doi: 10.1016/0022-2836(87)90412-8. [DOI] [PubMed] [Google Scholar]
- Chothia C, Lesk AM, Tramontano A, Levitt M, Smith-Gill SJ, Air G, Sheriff S, Padlan EA, Davies D, Tulip WR, et al. Conformations of immunoglobulin hypervariable regions. Nature. 1989;342:877–883. doi: 10.1038/342877a0. [DOI] [PubMed] [Google Scholar]
- Crooks GE, Hon G, Chandonia JM, Brenner SE. WebLogo: a sequence logo generator. Genome Res. 2004;14:1188–1190. doi: 10.1101/gr.849004. [DOI] [PMC free article] [PubMed] [Google Scholar]
- Davies DR, Padlan EA, Sheriff S. Antibody-antigen complexes. Annu Rev Biochem. 1990;59:439–473. doi: 10.1146/annurev.bi.59.070190.002255. [DOI] [PubMed] [Google Scholar]
- DeKosky BJ, Ippolito GC, Deschner RP, Lavinder JJ, Wine Y, Rawlings BM, Varadarajan N, Giesecke C, Dörner T, Andrews SF, et al. High-throughput sequencing of the paired human immunoglobulin heavy and light chain repertoire. Nat Biotechnol. 2013;31:166–169. doi: 10.1038/nbt.2492. [DOI] [PMC free article] [PubMed] [Google Scholar]
- Fellouse FA, Esaki K, Birtalan S, Raptis D, Cancasci VJ, Koide A, Jhurani P, Vasser M, Wiesmann C, Kossiakoff AA, et al. High-throughput generation of synthetic antibodies from highly functional minimalist phage-displayed libraries. J Mol Biol. 2007;373:924–940. doi: 10.1016/j.jmb.2007.08.005. [DOI] [PubMed] [Google Scholar]
- Finn RD, Mistry J, Tate J, Coggill P, Heger A, Pollington JE, Gavin OL, Gunasekaran P, Ceric G, Forslund K, et al. The Pfam protein families database. Nucleic Acids Res. 2010;38:D211–222. doi: 10.1093/nar/gkp985. [DOI] [PMC free article] [PubMed] [Google Scholar]
- Georgiou G, Ippolito GC, Beausang J, Busse CE, Wardemann H, Quake SR. The promise and challenge of high-throughput sequencing of the antibody repertoire. Nat Biotechnol. 2014;32:158–168. doi: 10.1038/nbt.2782. [DOI] [PMC free article] [PubMed] [Google Scholar]
- Hillier BJ, Christopherson KS, Prehoda KE, Bredt DS, Lim WA. Unexpected modes of PDZ domain scaffolding revealed by structure of nNOS-syntrophin complex. Science. 1999;284:812–815. [PubMed] [Google Scholar]
- Holtby D, Li SC, Li M. LoopWeaver: loop modeling by the weighted scaling of verified proteins. J Comput Biol. 2013;20:212–223. doi: 10.1089/cmb.2012.0078. [DOI] [PMC free article] [PubMed] [Google Scholar]
- Jones PT, Dear PH, Foote J, Neuberger MS, Winter G. Replacing the complementarity-determining regions in a human antibody with those from a mouse. Nature. 1986;321:522–525. doi: 10.1038/321522a0. [DOI] [PubMed] [Google Scholar]
- Kabsch W, Sander C. Dictionary of protein secondary structure: pattern recognition of hydrogen-bonded and geometrical features. Biopolymers. 1983;22:2577–2637. doi: 10.1002/bip.360221211. [DOI] [PubMed] [Google Scholar]
- Kim S, Grant RA, Sauer RT. Covalent linkage of distinct substrate degrons controls assembly and disassembly of DegP proteolytic cages. Cell. 2011;145:67–78. doi: 10.1016/j.cell.2011.02.024. [DOI] [PMC free article] [PubMed] [Google Scholar]
- Koliasnikov OV, Kiral MO, Grigorenko VG, Egorov AM. Antibody CDR H3 modeling rules: extension for the case of absence of Arg H94 and Asp H101. J Bioinform Comput Biol. 2006;4:415–424. doi: 10.1142/s0219720006001874. [DOI] [PubMed] [Google Scholar]
- Kunik V, Ofran Y. The indistinguishability of epitopes from protein surface is explained by the distinct binding preferences of each of the six antigen-binding loops. Protein Eng Des Sel. 2013 doi: 10.1093/protein/gzt027. [DOI] [PubMed] [Google Scholar]
- Kuroda D, Shirai H, Kobori M, Nakamura H. Structural classification of CDR-H3 revisited: a lesson in antibody modeling. Proteins. 2008;73:608–620. doi: 10.1002/prot.22087. [DOI] [PubMed] [Google Scholar]
- Leaver-Fay A, O’Meara MJ, Tyka M, Jacak R, Song Y, Kellogg EH, Thompson J, Davis IW, Pache RA, Lyskov S, et al. Scientific benchmarks for guiding macromolecular energy function improvement. Methods Enzymol. 2013;523:109–143. doi: 10.1016/B978-0-12-394292-0.00006-0. [DOI] [PMC free article] [PubMed] [Google Scholar]
- Leaver-Fay A, Tyka M, Lewis SM, Lange OF, Thompson J, Jacak R, Kaufman K, Renfrew PD, Smith CA, Sheffler W, et al. ROSETTA3: an object-oriented software suite for the simulation and design of macromolecules. Methods Enzymol. 2011;487:545–574. doi: 10.1016/B978-0-12-381270-4.00019-6. [DOI] [PMC free article] [PubMed] [Google Scholar]
- Lee HJ, Zheng JJ. PDZ domains and their binding partners: structure, specificity, and modification. Cell communication and signaling: CCS. 2010;8:8. doi: 10.1186/1478-811X-8-8. [DOI] [PMC free article] [PubMed] [Google Scholar]
- Lequin RM. Enzyme immunoassay (EIA)/enzyme-linked immunosorbent assay (ELISA) Clinical chemistry. 2005;51:2415–2418. doi: 10.1373/clinchem.2005.051532. [DOI] [PubMed] [Google Scholar]
- Levitt M. A simplified representation of protein conformations for rapid simulation of protein folding. J Mol Biol. 1976;104:59–107. doi: 10.1016/0022-2836(76)90004-8. [DOI] [PubMed] [Google Scholar]
- Lu D, Jimenez X, Zhang H, Bohlen P, Witte L, Zhu Z. Selection of high affinity human neutralizing antibodies to VEGFR2 from a large antibody phage display library for antiangiogenesis therapy. Int J Cancer. 2002;97:393–399. doi: 10.1002/ijc.1634. [DOI] [PubMed] [Google Scholar]
- Marcatili P, Rosi A, Tramontano A. PIGS: automatic prediction of antibody structures. Bioinformatics. 2008;24:1953–1954. doi: 10.1093/bioinformatics/btn341. [DOI] [PubMed] [Google Scholar]
- Mardia KV, Jupp P. Directional Statistics. 2. John Wiley and Sons Ltd; 2000. [Google Scholar]
- Michalsky E, Goede A, Preissner R. Loops In Proteins (LIP)--a comprehensive loop database for homology modelling. Protein Eng. 2003;16:979–985. doi: 10.1093/protein/gzg119. [DOI] [PubMed] [Google Scholar]
- Morea V, Lesk AM, Tramontano A. Antibody modeling: implications for engineering and design. Methods. 2000;20:267–279. doi: 10.1006/meth.1999.0921. [DOI] [PubMed] [Google Scholar]
- Morea V, Tramontano A, Rustici M, Chothia C, Lesk AM. Antibody structure, prediction and redesign. Biophys Chem. 1997;68:9–16. doi: 10.1016/s0301-4622(96)02266-1. [DOI] [PubMed] [Google Scholar]
- Morea V, Tramontano A, Rustici M, Chothia C, Lesk AM. Conformations of the third hypervariable region in the VH domain of immunoglobulins. J Mol Biol. 1998;275:269–294. doi: 10.1006/jmbi.1997.1442. [DOI] [PubMed] [Google Scholar]
- North B, Lehmann A, Dunbrack J, RL A new clustering of antibody CDR loop conformations. J Mol Biol. 2011;406:228–256. doi: 10.1016/j.jmb.2010.10.030. [DOI] [PMC free article] [PubMed] [Google Scholar]
- Oliva B, Bates PA, Querol E, Aviles FX, Sternberg MJ. Automated classification of antibody complementarity determining region 3 of the heavy chain (H3) loops into canonical forms and its application to protein structure prediction. J Mol Biol. 1998;279:1193–1210. doi: 10.1006/jmbi.1998.1847. [DOI] [PubMed] [Google Scholar]
- Padlan EA. Anatomy of the antibody molecule. Mol Immunol. 1994;31:169–217. doi: 10.1016/0161-5890(94)90001-9. [DOI] [PubMed] [Google Scholar]
- R Development Core Team. R: A Language and Environment for Statistical Computing. Vienna, Austria: 2010. [Google Scholar]
- Reczko M, Martin AC, Bohr H, Suhai S. Prediction of hypervariable CDR-H3 loop structures in antibodies. Protein Eng. 1995;8:389–395. doi: 10.1093/protein/8.4.389. [DOI] [PubMed] [Google Scholar]
- Shirai H, Ikeda K, Yamashita K, Tsuchiya Y, Sarmiento J, Liang S, Morokata T, Mizuguchi K, Higo J, Standley DM, et al. High-resolution modeling of antibody structures by a combination of bioinformatics, expert knowledge, and molecular simulations. Proteins. 2014;82:1624–1635. doi: 10.1002/prot.24591. [DOI] [PubMed] [Google Scholar]
- Shirai H, Kidera A, Nakamura H. Structural classification of CDR-H3 in antibodies. FEBS Lett. 1996;399:1–8. doi: 10.1016/s0014-5793(96)01252-5. [DOI] [PubMed] [Google Scholar]
- Shirai H, Kidera A, Nakamura H. H3-rules: identification of CDR-H3 structures in antibodies. FEBS Lett. 1999;455:188–197. doi: 10.1016/s0014-5793(99)00821-2. [DOI] [PubMed] [Google Scholar]
- Sibanda BL, Blundell TL, Thornton JM. Conformation of β-hairpins in protein structures. Journal of Molecular Biology. 1989;206:759–777. doi: 10.1016/0022-2836(89)90583-4. [DOI] [PubMed] [Google Scholar]
- Sibanda BL, Thornton JM. β-Hairpin families in globular proteins. Nature. 1985;316:170–174. doi: 10.1038/316170a0. [DOI] [PubMed] [Google Scholar]
- Sidhu SS, Fellouse FA. Synthetic therapeutic antibodies. Nat Chem Biol. 2006;2:682–688. doi: 10.1038/nchembio843. [DOI] [PubMed] [Google Scholar]
- Sivasubramanian A, Sircar A, Chaudhury S, Gray JJ. Toward high-resolution homology modeling of antibody Fv regions and application to antibody-antigen docking. Proteins. 2009;74:497–514. doi: 10.1002/prot.22309. [DOI] [PMC free article] [PubMed] [Google Scholar]
- Tonegawa S. Somatic generation of antibody diversity. Nature. 1983;302:575–581. doi: 10.1038/302575a0. [DOI] [PubMed] [Google Scholar]
- Tramontano A, Lesk AM. Common features of the conformations of antigen-binding loops in immunoglobulins and application to modeling loop conformations. Proteins. 1992;13:231–245. doi: 10.1002/prot.340130306. [DOI] [PubMed] [Google Scholar]
- Tyka MD, Jung K, Baker D. Efficient sampling of protein conformational space using fast loop building and batch minimization on highly parallel computers. J Comput Chem. 2012;33:2483–2491. doi: 10.1002/jcc.23069. [DOI] [PMC free article] [PubMed] [Google Scholar]
- van Vlijmen HW, Karplus M. PDB-based protein loop prediction: parameters for selection and methods for optimization. J Mol Biol. 1997;267:975–1001. doi: 10.1006/jmbi.1996.0857. [DOI] [PubMed] [Google Scholar]
- Wang G, Dunbrack J, RL PISCES: recent improvements to a PDB sequence culling server. Nucleic Acids Res. 2005;33:W94–98. doi: 10.1093/nar/gki402. [DOI] [PMC free article] [PubMed] [Google Scholar]
- Wei Q, Dunbrack RL., Jr The role of balanced training and testing data sets for binary classifiers in bioinformatics. PLoS One. 2013;8:e67863. doi: 10.1371/journal.pone.0067863. [DOI] [PMC free article] [PubMed] [Google Scholar]
- Weinstein JA, Jiang N, White RA, Fisher DS, Quake SR. High-throughput sequencing of the zebrafish antibody repertoire. Science. 2009;324:807–810. doi: 10.1126/science.1170020. [DOI] [PMC free article] [PubMed] [Google Scholar]
- Weitzner BD, Kuroda D, Marze N, Xu J, Gray JJ. Blind prediction performance of RosettaAntibody 3.0: Grafting, relaxation, kinematic loop modeling, and full CDR optimization. Proteins. 2014;82:1611–1623. doi: 10.1002/prot.24534. [DOI] [PMC free article] [PubMed] [Google Scholar]
- Whitelegg NR, Rees AR. WAM: an improved algorithm for modelling antibodies on the WEB. Protein Eng. 2000;13:819–824. doi: 10.1093/protein/13.12.819. [DOI] [PubMed] [Google Scholar]
- Wickham H. Ggplot2: elegant graphics for data analysis. New York: Springer; 2009. [Google Scholar]
- Xu J, Tack D, Hughes RA, Ellington AD, Gray JJ. Structure-based non-canonical amino acid design to covalently crosslink an antibody-antigen complex. J Struct Biol. 2013 doi: 10.1016/j.jsb.2013.05.003. [DOI] [PMC free article] [PubMed] [Google Scholar]
- Xu Q, Dunbrack RL. The protein common interface database (ProtCID)--a comprehensive database of interactions of homologous proteins in multiple crystal forms. Nucleic Acids Res. 2011;39:D761–770. doi: 10.1093/nar/gkq1059. [DOI] [PMC free article] [PubMed] [Google Scholar]
- Xu Q, Dunbrack RL. Assignment of protein sequences to existing domain and family classification systems: Pfam and the PDB. Bioinformatics. 2012;28:2763–2772. doi: 10.1093/bioinformatics/bts533. [DOI] [PMC free article] [PubMed] [Google Scholar]
- Yan J, Pan L, Chen X, Wu L, Zhang M. The structure of the harmonin/sans complex reveals an unexpected interaction mode of the two Usher syndrome proteins. Proc Natl Acad Sci USA. 2010;107:4040–4045. doi: 10.1073/pnas.0911385107. [DOI] [PMC free article] [PubMed] [Google Scholar]
- Zemlin M, Klinger M, Link J, Zemlin C, Bauer K, Engler JA, Schroeder HW, Jr, Kirkham PM. Expressed murine and human CDR-H3 intervals of equal length exhibit distinct repertoires that differ in their amino acid composition and predicted range of structures. J Mol Biol. 2003;334:733–749. doi: 10.1016/j.jmb.2003.10.007. [DOI] [PubMed] [Google Scholar]
Associated Data
This section collects any data citations, data availability statements, or supplementary materials included in this article.
Supplementary Materials
Figure S1, related to Figure 1: Density estimates for each of the six degrees of freedom of the loop anchor transform for each 13-residue segment from (1) the culled PDB set (gray); and (2) the known CDR H3 loops (black) show the relative structural diversity between the two sets. The tightness of the H3 distributions indicates the defined CDR H3 anchor points at structurally conserved positions, while the diffuse distributions from the PDB show the structural diversity of 13-residue segments in the other proteins. Because the six degrees of freedom are not covariant, each can be considered independent and modeled with a Gaussian distribution. These six Gaussian distributions are used to extract a set of non-antibody regions that match the span and orientation of the CDR H3 loop anchors.
Figure S2, related to Figure 6: Cumulative density estimate for minimum root-mean-square deviation (RMSD) of backbone atomic coordinates for each H3 loop relative to all other H3 loops ranging from 9–20 residues with a maximum sequence identity (SID) of 30% (gray curve) and the minimum RMSD of any LAT+kink match relative to each antibody CDR H3 loop (yellow curve), a random set of LAT matches of the same size and length distribution as the LAT+kink matches (blue curve) and the union of the H3 loop and LAT+kink match sets (green curve) split up by length. Dashed vertical lines at 1.0 and 2.0 Å indicate the fraction of structurally similar H3 loops at each cutoff. As the loop length increases, so does the distribution of minimum RMSDs, showing that longer H3 loops are more diverse. These data underscore the difficulty of developing a template-based modeling method for long H3 loops and show that using the LAT+kink matches improves the coverage of known CDR H3 loops.
Figure S3, related to Figure 2: Ramachandran plots for four N-terminal residues of H3 loops (left) and LAT matches (right), beginning with the residue preceding the N-terminal loop anchor. In antibodies (A) this residue is the Cysteine that precedes H3 loops and is structural conserved, but in the LAT matches (B), this residue is free to adopt an extremely wide variety of conformations. At the H93 (or equivalent) position, the antibodies (C) are again structurally conserved, but now the LAT matches (D) are almost entirely restricted to the β region of the plot because this is the anchor residue that we use to identify LAT matches. The next two positions show the antibodies (E and G) beginning to broaden as further into the loop and the LAT matches (F and H) return to an extremely diverse set of conformations.
Figure S4, related to Figure 3: Ramachandran plots for four C-terminal residues of H3 loops (left) and LAT matches (right), ending with the residue following the C-terminal loop anchor. At the position furthest into the loop, the antibodies (A) and the LAT matches (B) both show conformational diversity. However, the penultimate residue shows the antibodies (C) and the LAT matches (D) confined to different regions of Ramachandran space based on the loop base geometry. Extended loops lie in the β region while kinked loops are in the α conformation. Interestingly, loops with indeterminate base geometry lie in the β, α and the Lα regions, showing that dihedral angles alone cannot be used to classify base geometry. Position H102 is the C-terminal loop anchor, and, as with the N-terminal loop anchor, most structures are confined to the β region of the plot. After the loop ends, the antibodies (G) exhibit almost no conformational diversity while the LAT matches (H), while biased toward β have density in a much larger region of the plot.
Figure S5, related to Figure 4: “Conformation Logos” for the loop anchors and three flanking residues on either side for (A) all LAT matches, and (B) LAT+kink matches. In both cases, positions 1, 2 and 3 correspond to N - 3, N - 2 and N - 1; position 4 is the N-terminal loop anchor; position 5 is the C-terminal loop anchor; and positions 6, 7 and 8 correspond to C + 1, C + 2 and C + 3. Approximately 84% of LAT match environments and 90% of LAT+kink match environments are extended β strands. The distributions are nearly identical in LAT matches and LAT+kink matches.
Figure S6, related to Figure 5: Sequence Logos for CDR H3 loops and LAT matches. Using the LAT parameters alone to select the set of structures results in a set of antibodies with clear sequence conservation at the termini and very little conservation in the central positions (A) and set of structures from the PDB that have no clear sequence preferences save for a small Glycine signal in the central-most positions (B). Including the additional constraint of the τ101 and α101 angles does not alter the antibodies (C), while the constraint has a small, but noticeable effect on the PDB sequence distribution (D). However, there is still no detectable signal and the residues typically associated with kink formation in antibodies are not observed in the LAT+kink set.
Figure S7, related to Figure 7: Density estimates for glycine positions in CDR H3 loops and LAT matches. The data are split up by base geometries using the τ101 and α101 values for the loop. The data are further split up by the parity of the loop length because defining a central position differs between the two sets.
Table S1, related to Figure 4: The number of and percentage of antibodies that are kinked for all combinations of residues implicated in kink formation. As found earlier [1], regardless of the presence of the stabilizing residues, the majority of CDR H3 loops are kinked.
Table S2, related to Figure 4: Statistical analysis of H3-classification rules proposed by Kuroda et al. [4]. Because the majority of structures are kinked, predicting an extended structure is considered a positive prediction. In our analysis we have a third base geometry: unclear. Those structures are excluded from this calculation to ensure that only structures where both analyses agree on how the base geometry should be classified are considered. Also left out are 23 structures that only have a heavy chain in the crystal (either because only the FV was crystallized or because it is the structure of a VHH) and require using light chain residues to apply the rules. Within this group, 20 structures are kinked and the other 3 are extended, but we cannot apply the rules to these structures so they are not included in the analysis below.