Summary
Agonist-promoted G-protein coupled receptor (GPCR) endocytosis and recycling plays an important role in many signaling events in the cell. However, the approaches that allow fast and quantitative analysis of such processes still remain limited. Here we report an improved labeling approach based on the genetic fusion of a Fluorogen Activating Protein (FAP) to a GPCR and binding of a sulfonated analog of the malachite green (MG) fluorogen to rapidly and selectively label cell surface receptors. Fluorescence microscopy and flow cytometry demonstrate that this dye does not cross the plasma membrane, binds with high affinity to a dL5** FAP-GPCR fusion construct, activating tagged surface receptors within seconds of addition. The ability to rapidly and selectively label cell surface receptors with a fluorogenic genetically encoded tag allows quantitative imaging and analysis of highly dynamic processes like receptor endocytosis and recycling.
Introduction
Fluorescent proteins (FP) have revolutionized our ability to study proteins of interest by allowing direct visualization of the proteins involved in important signaling pathways in real time in live cells. Although FP tagging provides useful information about the locations of the proteins, it is not an ideal tool to quantitatively examine certain cellular events, such as the redistribution of receptors during endocytosis and recycling, because both the receptors at the plasma membrane and inside the cell contribute to the detected fluorescence signal, regardless of their location. Recently developed strategies based on chemical tags have achieved exclusive cell-surface labeling by using cell-impermeable fluorescent probes1. In these strategies, a peptide tag, instead of an intrinsically fluorescent protein, is fused to the protein of interest. The expressed peptide tag can bind with high affinity or can be directly covalently linked to a fluorophore modified with a “linking group”. For example, TMP-tag2, SNAP-tag3, Halo Tag4 and chemical tags mediated by biotin ligase5, lipoic acid ligase6 and phosphopantetheine transferase7 have been successfully used to label receptor proteins for live cell imaging. However, these approaches have some drawbacks: 1. the labeling protocol requires multiple reagents to be added to the cells and multiple wash steps to remove the unreacted fluorophore; 2. the labeling time could be as long as 60 min to obtain optimal results; 3. blocking reagents are sometimes required to minimize the background signal; 4. saturation labeling can require incubation with very high concentrations of the fluorescent dye tag. Therefore, there is an immediate need for a convenient, fast, fluorogenic labeling strategy for cell surface proteins.
G protein coupled receptors (GPCRs) comprise the largest gene family of signaling molecules in the human genome and account for at least one third of the drug targets.8 It is therefore of great interest to understand the functional significance of GPCRs under physiological and disease conditions, and in response to drug treatments. Currently there are two well established approaches to measure receptor internalization and recycling.9 The first approach uses fluorescently labeled antibodies against the receptor or an epitope tag fused to the receptor. The cells are treated with an agonist to induce endocytosis and the receptors are allowed to recycle for various durations prior to immunolabeling of non-permeabilized cells. The changes in the immunoreactivity of the receptor are assessed by flow cytometric analysis, reflecting the fraction of protein remaining accessible to the antibody at the cell surface. The second approach takes advantage of a cleavable biotin modification of surface proteins. All surface proteins are modified with a reactive, cleavable biotin linker, followed by treatment of the cells to cause endocytosis. After internalization, the biotin label on receptors that remain at the cell surface is removed by chemical treatment. As a result only internalized receptors remain labeled, allowing for measurement of total endocytosed protein. To discern the protein of interest within the cell lysate, immunoprecipitation and immunodetection using an antibody specific to the receptor is performed to quantify the extent of biotin retained, and hence the fraction of endocytosed protein. Both of these approaches involve multiple wash steps and are time-consuming: it takes 10 hours to finish the biotin labeling and signal quantification when both receptor internalization and recycling need to be examined.10 This has limited the evaluation of trafficking in high-throughput analyses of receptor signaling.
We recently reported a fluorogenic labeling approach that utilized molecular recognition to directly activate the fluorescence of otherwise nonfluorescent dyes. This Fluorogen Activating Protein (FAP) technology11 uses single chain antibodies isolated from a yeast cell surface display library. Upon binding to the cognate FAPs, the otherwise dark fluorogenic dyes that are analogs of thiazole orange and malachite green are activated and display thousands-fold fluorescence enhancements. There are several distinct advantages to the FAP-fluorogen system. The interaction between the fluorogen and FAP is highly specific, with some FAP clones exhibiting subnanomolar affinity.12 Because the non-bound fluorogen is essentially dark, no wash steps are needed. In addition, the genetically encoded FAPs are small in size, allowing fusions to proteins of interest for live cell imaging and analysis.13 We have previously demonstrated selective cell surface labeling of the β2-adrenergic receptor (β2-AR) fused with a TO or MG binding FAP using a cell impermeable fluorogen.13, 14 The FAP based fluorescence detection and quantification approach also provides a platform for high-throughput screening of receptor proteins13. Moreover, a tandem dye with TO-1 conjugated to a pH sensitive acceptor has been employed to monitor the trafficking behavior of (β2-AR)15. Here we demonstrate that a sulfonated MG analog, MG-B-Tau 1, shows improved quantum yield, and cell exclusion properties, improving the application of MG-FAPs in live-cell fluorescence microscopy and flow cytometric assays.
Results and Discussion
An ideal pair of dyes for intracellular and cell surface labeling would have similar fluorescence quantum yields, binding constants, yet markedly different ability to penetrate the plasma membrane. Previously we have used MG-2p 2 and MG-11p 3 for cell surface and MG-ester 4 for intracellular labeling.11, 13, 14 Our analysis of these dyes indicated that there were substantial differences in quantum yield between the surface-selective MG derivatives and the cell-permeant MG-ester 4 (Table 1). In addition, prolonged exposures to the MG-2p 2 and MG-11p 3 dyes in screening experiments suggested that these dyes displayed nonspecific labeling and some evidence of cell penetration (Yang Wu, University of New Mexico, Private Communication). To improve the quantum yield, nonspecific interactions and cell exclusion, we considered modifications to the fluorogen in the non-binding tail region. Sulfonates are a well-established, negatively charged group that limits plasma membrane penetration.16 A derivative of the malachite green fluorogen with two sulfonate groups, a net charge of −1, and a short hydrophilic linker was designed to maximize the charge density for cell exclusion (MG-B-Tau 1). In contrast, the PEG linker in MG-2p 2 and MG-11p 3 is amphiphilic and these two dyes have a net charge of +2. PEG molecules have been used in other studies to facilitate transport across the membrane17 or to fuse membranes of cells.18 Based on the structure of these dye molecules (Scheme 1), we hypothesized that MG-B-Tau 1 would be more polar and should be rigorously excluded from the cell.
Table 1.
Properties of fluorogenic MG analogs.
| Dye | Kd (nM) (SD) | Φf | Charge |
|---|---|---|---|
| MG-B-Tau 1 | 0.54 (0.04) | 0.19 | −1 |
| MG-2p 2 | 0.19 (0.02) | 0.20 | +2 |
| MG-11p 3 | 0.11 (0.02) | 0.08 | +2 |
| MG-ester 4 | 0.42 (0.05) | 0.12 | +1 |
Scheme 1.
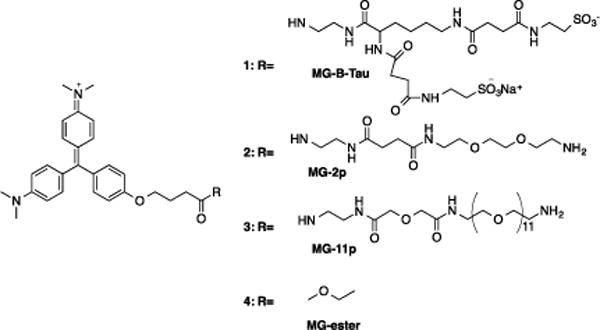
Chemical structure of MG-B-Tau 1, MG-2p 2, MG-11p 3 and MG-ester 4.
Our strategy for synthesizing MG-B-Tau 1 (Scheme 2) started from MG[H]-EDA 5, a precursor that was used in the preparation of many of our malachite green based fluorogens.11 The MG[H]-EDA-Fmoc-Lys(Boc) derivative 6 was synthesized by standard peptide coupling of MG[H]-EDA 5 with Fmoc-Lys(Boc)OSu, followed by Fmoc deprotection with piperidine in chloroform to give MG[H]-EDA-Lys(Boc) 7 in high yield. We used orthogonal amino protective groups to allow the preparation of a variable building block. Throughout the multistep synthesis, the reduced form of the malachite green derivatives, indicated by “[H]”, was used since this form is easier to handle and purify than the oxidized derivatives. Additionally, we chose tetrabutylammonium as the sulfonate counter ion to turn 2-({4-[(2,5-dioxopyrrolidin-1-yl)oxy]-4-oxobutanoyl}amino) ethane sulfonate into its organic soluble tetrabutylammonium salt 8. With this transformation it was possible to couple it with MG[H]-EDA-Lys(Boc) 7 in solvents such as acetonitrile or chloroform in high yields, allowing us to purify the resulting MG[H]-EDA-Lys(Boc)-Tau 9 by chromatography on silica gel. Acid catalyzed deprotection of the Boc group with 1N HCl yielded the mono-sulfonated intermediate MG[H]-EDA-Lys-Tau 10, a valuable compound for the preparation of tandem dyes.19, 20 MG[H]-EDA-Lys-Tau 10 was again coupled with tetrabutylammonium 2-({4-[(2,5-dioxopyrrolidin-1-yl)oxy]-4-oxobutanoyl}amino) ethane sulfonate 8 under anhydrous conditions, and without isolation oxidized with tetrachlorobenzoquinone to give the target compound MG-B-Tau 1. This compound is very water-soluble and thus was purified by reversed phase chromatography. Prior to the purification, MG-B-Tau 1 was transformed to the free sulfonic acid by adding diluted sulfuric acid. For the last three steps of the synthesis we report an overall yield 15% for the product fractions with a purity of >99.5 %.
Scheme 2.
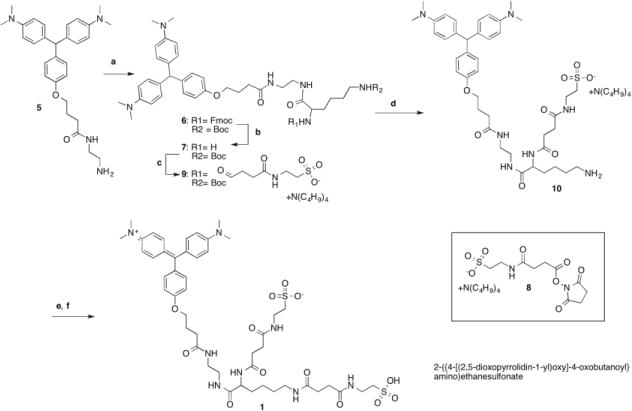
Synthesis of MG-B-Tau 1 Reagents and conditions: (a) Fmoc-Lys(Boc)-OSu, DIEA, CH2Cl2, rt, overnight; 81%(b) CHCl3/20% piperidine, rt; 79% (c) 8 CHCl3, DIEA, 60 %; (d) 1N HCl, rt, overnight; (e) 8, DMF, DIEA, rt (f) CH3CN, tetrachlorobenzoquinone 1 hr reflux, combined yield d,e,f 15%.
Modifications to the fluorogen may negatively impact the affinity of the FAP-fluorogen interaction.19 Each of the MG analog dyes was titrated against the dL5** FAP and fluorescence was measured in a Tecan Safire2 plate reader (Supplementary Online Materials Figure S1). The background-subtracted, normalized data was fitted to a single site, specific binding model accounting for ligand depletion to arrive at a measured Kd for the dye-protein interaction. All the dyes exhibited similar, subnanomolar Kd values (Table 1), suggesting that they all bind to dL5** with high affinity, and can be used to achieve saturation labeling at submicromolar concentrations.
Cell exclusion of each dye was assessed by time-lapse confocal microscopy on a HeLa cell line expressing cytosolic FAP-actin.21 Cells were imaged over 30 minutes in the presence of 100 nM cell-permeant MG-ester 4 or 500 nM MG-B-Tau 1, MG-11p 3 and MG-2p 2 (Figure 1). Time-lapse and endpoint analysis show that MG-2p 2 and MG-ester 4 penetrate the cells and stain actin structures relatively quickly and with high signal levels, while the MG-11p 3 and MG-B-Tau 1 are more rigorously excluded from the cell, although some signal is still visible on actin structures after 15–30 minutes (Supplementary Online Materials, Figure S2). The maximum signal seen in the MG ester 4 is at least 16× higher than the MG-11p 3 and MG-B-Tau 1, but only ~4x higher than that seen with the MG-2p 2. Although the MG-B-Tau 1 signal is slightly higher than that seen with MG-11p 3, it remains in the very low intensity range, with those images (Figure S2 C and D) set to a maximum intensity value of 1000 (compared to the full 14-bit dynamic range of the camera for the MG-ester), and may be due to the ~2.5-fold difference in the quantum yield of the FAP-dye complexes between these different MG variant dyes, rather than differences in cell penetration.
Figure 1.

Fluorescence labeling of dH6.2-Actin expressing HeLa cells. Images of cell-permeant MG-ester 4 (100 nM), and cell impermeant MG-2p 2, MG-11p 3 and MG-B-Tau 1 (all at 500 nM) after 30 minute incubation in the presence of dye (unwashed). Images are displayed on the full lookup table, showing the low activation of dyes 3 and 4 on intracellular targets. Scalebar = 10 μm.
Time-lapse microscopy was also used to measure the rate of dye activation for labeling cell surface receptors. At the cell surface, the diffusion-limited association of the free fluorogen with exposed FAP should define the activation rate for fluorogen-FAP complexes. Studies on purified protein demonstrated that the dL5** FAP showed ~107 M−1s−1 activation rates,12 suggesting that it could very rapidly activate added dye in cultured cells. Time-lapse confocal imaging of a HEK-293 cell line expressing dL5**-B2AR upon addition of 200 nM dye revealed complete activation of the MG-B-Tau 1 dye by surface displayed FAPs within seconds of dye addition (Figure 2A, B), essentially limited to the timescale of mixing. Kinetic analysis of binding in the presence of different dye concentrations and analysis of the activation rates using first-order binding kinetics (Figure 2C) indicated a kon for dye-binding at the cell surface of (5.06±0.07)×105 M−1s−1 and a koff that was negligible on the timescale of these experiments. Such rapid binding and stable signal generation is exceptionally useful for direct quantitation of receptor trafficking on living cells.
Figure 2.
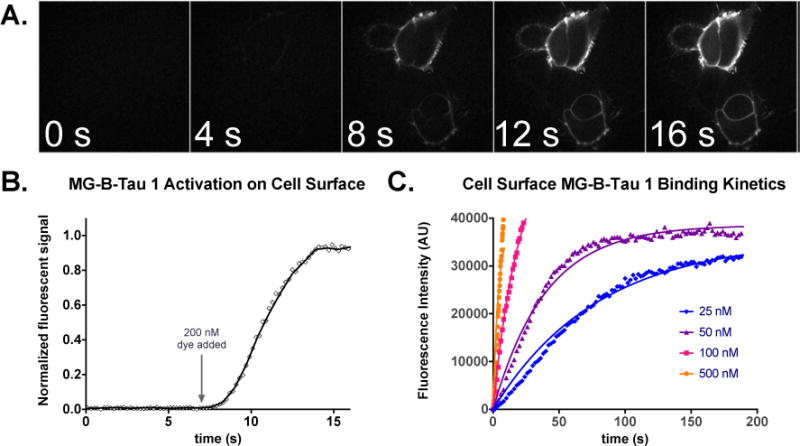
Rapid activation of MG-B-Tau 1 on HEK293 cells expressing B2AR-dL5**. A. Cells were incubated in 150uL colorless DMEM and imaging was performed upon addition of 2mL of 200nM MG-B-Tau 1 at t=7 seconds to the dish until steady-state labeling was obtained. (scale bar 10 μm). B. Timecourse of activation upon addition of dye in A. Once mixed, the dye rapidly activates surface exposed FAP. C. Kinetic analysis of binding to cells at different dye concentrations and fitting to a global exponential association model reveals an activation constant of 5.06×10⁵ M−1s−1.
Fluorogenic assays rely on specific activation of the fluorogen dye by the target protein. Although cell exclusion can reduce concerns about nonspecific labeling of intracellular contents in living cells, it is essential to ensure that a good fluorogen has minimal interaction with compromised cells or dead cells, particularly in flow cytometric assays where morphology cannot be used to discriminate between authentic and artifactual signals.22 Brefeldin A was used to induce apoptosis. Brefeldin A blocks membrane traffic and protein secretion by reversibly disassembling the Golgi apparatus and mixing its contents with the ER.23 Prolonged treatment results in cell death due to caspase activation and ER-stress induced apoptotic pathways. Three mammalian cell lines: RBL, Hela and HEK293 were treated with Brefeldin A for 40 hours and incubated with fluorogens dissolved in ethanol or water before flow cytometric analysis of fluorescence intensity on propidium iodide positive cells (a marker of cell death). Under all the conditions tested, MG-2p 2 showed the highest level of nonspecific activation on apoptotic cells, followed by MG-11p 3 or MG-ester 4, while MG-B-Tau 1 showed the lowest activation (Figure 3). Interestingly, we found statistically significant (p<0.01 for MG-11p 3, p<0.03 for MG-2p 2, and p<0.08 for MG-B-Tau 1 due to the low signal levels) differences between water and ethanol stock solutions of the dyes, in spite of the fact that final concentrations of ethanol were substantially below 0.1% in the staining experiments. For the lowest nonspecific binding, concentrated dye stocks should be prepared consistently in acidic aqueous solution. Based on these findings, MG-B-Tau 1 is potentially the best dye for use for cell surface labeling in complex tissues and living organisms, where washing is impossible. Analysis of the PI-negative population, the living cells in these experiments, revealed that only the MGester showed significant nonspecific activation relative to autofluorescence, with all other dyes showing slight enhancements that were not statistically significant (Supplementary Figure S3).
Figure 3.
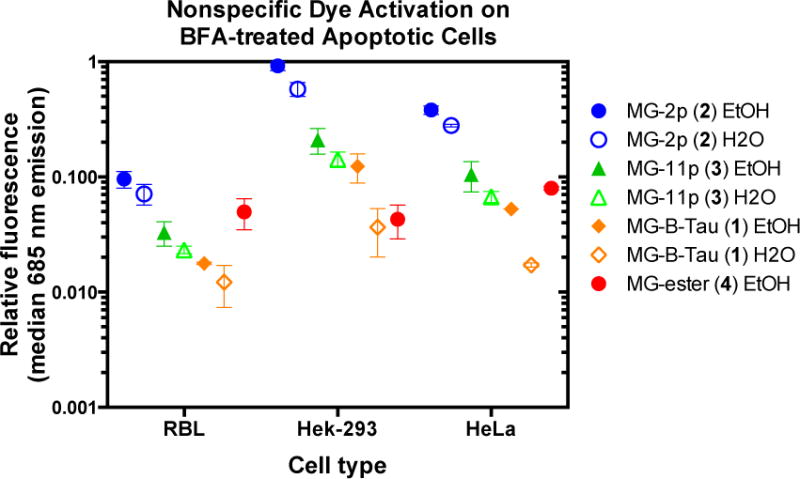
Non-specific dye activation on apoptotic cells. Cells that were not expressing any FAP were treated with Brefeldin A to induce apoptosis followed by 30 minute incubation with dyes at 500 nM (MG-2p 2, MG-11p 3, and MG-B-Tau 1) or 100 nM (MG-ester 4) prepared from the indicated stock solution. Propidium iodide positive cells were selected and analyzed for associated MG fluorescence due to nonspecific activation (633 nm laser excitation with 685/70 nm emission filter). Data was normalized to the highest signal among the samples, and plotted as mean (center line) and range (box) of independent duplicate experiments on separate days.
During receptor internalization and recycling, the receptors are redistributed between the cell surface and the endosomal compartments in the cell. It is therefore crucial to separate these two pools of receptors for quantitative analysis. Based on the observations that MG-B-Tau 1 showed minimal intracellular FAP labeling, rapid activation on the cell surface, and low nonspecific activation on dead cells, we next used a whole-cell flow cytometry assay to quantitatively measure drug-mediated β2-AR internalization and recycling using MG-B-Tau 1 as a rapid, specific cell-surface protein tagging reagent. HEK293 cells stably expressing dL5**-β2-AR were exposed to 10 μM isoproterenol (iso) to initiate receptor internalization for 20 min. After the agonist was removed, the cells were treated with either alprenolol (alp), an antagonist of the receptor that allows recycling, or a combination of alprenolol + latrunculin B (alp+lat) that prevents recycling. Previous studies of the β2-AR established that the actin machinery is required for recycling to the plasma membrane,24, 25 therefore cells treated with drugs that interfere with actin polymerization, such as latrunculin25 or cytochalasin24 show no recycling and internalized β2-AR is targeted to lysosomes for degradation.
Recycling of GPCRs is typically assessed by surface immunofluorescence assays using nonpermeabilized cells. To demonstrate the potential for quantitative analysis of surface abundance using the MG-B-Tau 1 reagent, we compared the fluorogen signal generated in a simple add-and-read protocol to that determined using the HA epitope that was cloned at the N-terminus of the FAP-β2-AR receptor for conventional surface immunofluorescence analysis of the same stable cell line. Cells were first treated with isoproterenol for 20 minutes to stimulate the receptor, resulting in initial internalization of activated receptors. After this initial stimulation, the isoproterenol was removed, and replaced with alp to allow recycling or alp+lat to prevent recycling for 1 hour. Cells treated at each stage of the process were analyzed in triplicate by direct addition of MG-B-Tau 1 at 500 nM, or indirect immunofluorescent staining for the HA epitope remaining at the cell surface. Figure 4 shows the drug treatment protocols (Figure 4A), along with the quantitative results of these parallel analyses of GPCR trafficking (Figure 4B–antibody, Figure 4C–fluorogen). Supplemental Figure S4 shows the differences in the labeling protocols after the drug treatment. The quantitative results obtained by the standard immunofluorescent labeling method are recapitulated accurately by the add-and-read fluorogenic dye addition approach. In addition, the measurement of surface protein by fluorogenic dye addition is considerably more precise, resulting in up to a 3-fold reduction in standard error of the mean. Precise and accurate assays for trafficking will allow for detection of more subtle, yet biologically relevant changes in protein abundance at the surface.
Figure 4.
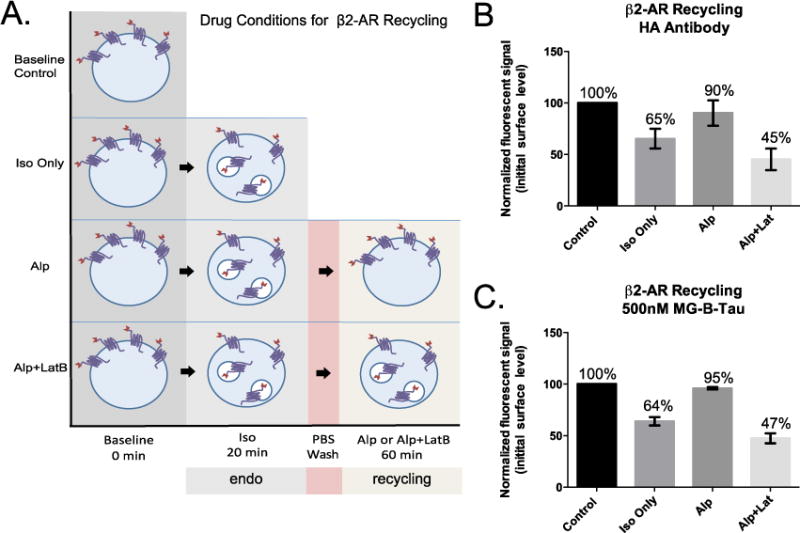
Trafficking assays of the β2-adrenergic receptor (β2AR). A. Sequential treatment of HEK-293 cells stably expressing a HA-FAP-β2AR construct with isoproterenol (iso) and alprenolol (alp) or alprenolol and latrunculin B (alp + lat), allows separation of receptor endocytosis and recycling. B. Antibody labeling of the surface exposed HA epitope reveals desensitization and recycling levels, nearly identical to (C) those measured by fluorogenic dye addition in a simple “add and read” assay format with improved precision in the simplified assay. The error bars represent SEM of 3 independent replicate experiments on different days.
The relative simplicity of the fluorogenic labeling assay allows rapid analysis of multiple time-points during recycling. After 20 minutes of agonist treatment, the added fluorogen produced fluorescent signal reduced by 50% relative to parallel samples not treated with agonist, indicating that approximately half of the surface receptors had internalized. (Figure 5, 0, 20 min data points) Cells subsequently treated with alp alone, showed rapid recycling when fluorogen was added at different times after the drug change: the cell surface signal had returned to 100% 15 min after recycling started (Figure 5, blue line). In contrast, the presence of lat, a drug that binds to the G-actin monomers and sequesters them from polymerization,26 abolished the recycling when assessed by fluorogen addition (Figure 5, black), revealing a persistent reduction of surface protein abundance throughout the 1 hour recycling time. The simplicity of the “add and read” assay format with the fluorogenic dye allows rapid sampling of a larger cell population with high frequency. Because the FAP/MG-B-Tau labeling can be performed in common physiological buffers and cell culture media, no washing is required.
Figure 5.
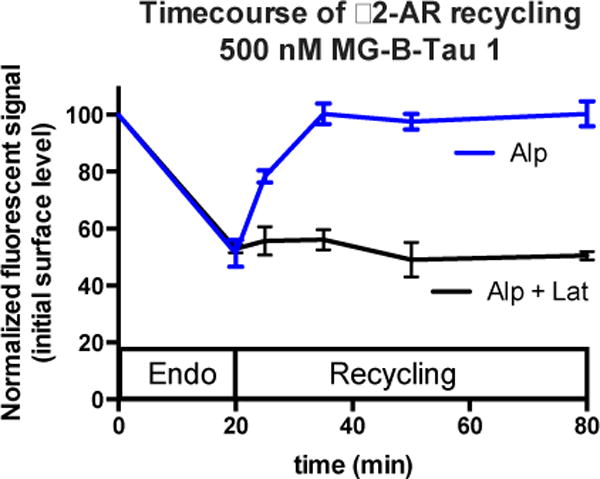
Flow cytometric analysis of β2-AR recycling dynamics using MG-BTau 1. Error bars represent independent triplicate experiments. Cells were treated with isoproterenol to induce receptor endocytosis for 20 min. Then the cells were washed and treated with antagonist (alprenolol) (blue) or with antagonist (alprenolol) and a recycling inhibitor (latrunculin B) (black) 500 nM MG-B-Tau 1 dye was added to cells immediately prior to flow cytometric analysis. Under the recycling conditions (alp), the surface signal rapidly recovers to the initial level, indicating near 100% receptor recycling, while under the blocked recycling conditions (alp + lat), essentially no recycling to the surface is observed.
Conclusion
In conclusion, we have established a fast and convenient cell surface labeling technique using a FAP as a genetically encoded protein tag and a sulfonated MG fluorogen as a cell-excluded dye. MG-B-Tau 1 binds to the dL5** FAP with subnanomolar affinity and the fluorescence signal can be detected quantitatively within seconds upon addition of the dye. The specificity of the MG-B-Tau 1 dye modified with two sulfonate groups is improved relative to polyethyleneglycol variants of the dye, achieving >10-fold reduction in the fluorescent intensity on dead cells and decreasing plasma membrane penetration, while improving the quantum yield of the FAP-fluorogen complex >2-fold relative to the next-best cell-excluded dye, the MG-11p 3. Staining of cell-surface proteins tagged with the fluorogen activating protein tag provided quantitative agreement with the conventional antibody staining methods used to assess surface abundance, with decreased variability, and the simplicity of the assay allowed for rapid sampling of cells during recycling to assess timescales for receptor recycling in cultured cells. Overall, this methodology provides a general basis for imaging studies and quantitative measurements of receptor trafficking in live cells.
Materials and Methods
Cell culture
RBL, Hela and HEK-293 cells were cultured in Dulbecco’s Modified Eagle Medium (DMEM) with 10% fetal bovine serum (FBS), 100 units/ml penicillin, and 100 μg/ml streptomycin in a humidified atmosphere of 5% CO2 at 37 °C. Cells were split every time they reached 80% confluence.
Plasmid and mammalian cell line preparation
pBabe-dL5**- β2-AR was generated by inserting the dL5 sequence to pBabeSac β2-AR Lac2 using SfiI cutting sites. Stable HEK293 cells were generated by transfecting HEK293 cells with pBabe-dL5**-β2-AR followed by drug selection (1 mg/ml puromycin, Invitrogen) and FACS enrichment (Becton Dickinson FACS Vantage flow cytometer. Excitation: 633 nm; Emission: 685/35 nm).
Fluorescence titration
Secretion and purification of soluble dL5 was described in (Szent-Gyorgyi et al, 2008)12. Binding affinity to soluble dL5 was measured as a homogeneous fluorescence activation assay on a TECAN Safire2 fluorescence plate reader. 1 nM dL5 was incubated with a serial dilution of 1024 nM to 0.5 nM of the respective fluorogen dissolved in PBS with 0.1% Pluronic F127. The FAP+dye complex fluorescence was corrected by subtracting the fluorescence of a dye only sample, and then normalized to the maximum signal at saturation to establish the fractional occupancy. The KD was determined by fitting the data with a ligand depletion single-site binding model in Graphpad Prism 5.0.
Fluorescence microscopy for cell penetration
HeLa cells stably expressing the dH6.2-Actin construct were plated in glass-bottom dishes (Mattek) and imaged in OptiMEM (Invitrogen) in an imaging chamber at 37 °C with 5% CO2. The images were acquired on an Andor Spinning disk confocal microscope using a 63×, 1.45 NA TIRF objective. 100 nM MG-ester, 500 nM MG-11p, MG-2p and MG-B-Tau 1 were used to stain the cells. Images were acquired 1, 5, 15, 30 min after the addition of dye. A 640 nm laser was used for excitation and the emission signal was collected using a 685/70 filter. Laser power and camera gain settings were held constant for all acquisitions.
Fluorescence microscopy for surface activation
HEK293 cells stably expressing the dL5**-β2-AR construct were plated in glass-bottom dishes (Mattek), washed, and covered with 150 μl of colorless DMEM. Image acquisition was started at 10 frames per second. To achieve rapid mixing, 2.0 mL of dye stock at 1.1× the desired final concentration was added, and imaged for 200s. The images were acquired on an Nikon Ti Eclipse inverted microscope using a 63×, 1.45 NA TIRF objective with a 640 nm laser for excitation and a 685/70 nm emission filter. Laser power and camera gain settings were held constant for all acquisitions. Average fluorescent intensity of cellular areas was extracted from the image series using ImageJ, and subsequently truncated to remove camera saturation (signals over 40,000 from the high concentration, late-time points), and pre-addition timepoints. The resulting curves were fit using Graphpad Prism 6.0 using nonlinear regression with the “Association kinetics – Two or more conc. of hot.” equation (Equation 1). This model fits all curves with a common kon and koff but independent maximum fluorescence signals, to get a global best-fit for activation rate. Values of the fits obtained from all datasets (25 nM, 50 nM, 100 nM, 500 nM) were consistent with those that considered only the non-camera saturated data at low concentration (25 nM, 50 nM only), so values reported are from the global fit of all datasets.
| Equation 1 |
Brefeldin A induced apoptosis
cells were treated with 35 nM Brefeldin A at 37° C for 40 hours. Cells were then trypsinized, centrifuged and resuspended in PBS. 300 nM dye was added to cells and incubated at room temperature for 30 minutes. Then cells were kept on ice and stained with propidium iodide (PI) (1 μg/ml) before FACS analysis. The analysis was carried out on PI positive cells selectively, typically ~30% of the total cell population.
FACS analysis of apoptotic cells
1–2×10⁶ cells were kept on ice and stained with propidium iodide (PI) (1 μg/ml) before FACS analysis. Cells were analyzed using a Becton Dickinson FACS Vantage SE Flow Cytometer, and collecting at least 20,000 cellular events for each dataset. The analysis was carried out on PI positive cells. Cells were excited with a 633 nm laser and 685/35 nm emission filter. Quantification was performed using median fluorescence intensities from the PI positive cells. The same gate was applied to all samples. At least 2 experiments were carried out on separate days for each experimental condition. Data is shown as mean and range of these independent replicate experiments.
Analysis of β2-AR recycling by flow cytometry
β2-AR recycling conditions
HEK293 cells were grown to 80% confluency in 35mm dishes. Each dish was treated with different drug conditions, cells were either untreated, treated with iso only, treated with iso and then alp, or treated with iso and then alp+lat. Cells were treated with 10 μM iso in OptiMEM for 20 min at 37°C to induce receptor endocytosis and then washed extensively with PBS to remove the agonist. After iso incubation, cells were either collected or further treated with 10 μM alp or 10 μM alp and 10 μM lat in OptiMEM for an hour at 37°C. After each condition was met, cells were suspended in cold 2mM EDTA/PBS and transferred to 1.5mL tubes on ice to prevent further membrane trafficking.
500nM MG-B-Tau surface labeling
Once cells were suspended in cold 2mM EDTA/PBS on ice, cells were exposed to 500 nM MG-B-Tau for 30 seconds and immediately analyzed on the BD Accuri C6 flow cytometer (excitation 640 nm/emission 675/25 nm) or a FACS Vantage SE (excitation 633 nm/emission 685/35 nm). Quantification was performed by applying the same gate to all samples and collecting the fluorescence intensity from the 90th percentile of the total cell population. The fluorescence of untreated cells, no dye control condition was subtracted from the fluorescence of cells stained with dye. Then the fluorescence intensity of each experimental condition was averaged from at least 3 experiments carried out on separate days. The conditions were normalized to the untreated cell control (baseline) and the data is shown as mean ± S.E.M. of these independent replicate experiments.
Antibody surface labeling
For this labeling protocol, HEK293 cells were grown in 60mm dishes instead of 35mm dishes to account for cell loss. After the cell samples were suspended in cold 2mM EDTA/PBS and transferred to a 1.5mL tube, they were exposed to 1ug/mL of PI on ice for 5 minutes. After the 5 minute incubation, the cells were centrifuged at 3000rpm for 5min. The supernatant was aspirated and the cell pellet was resuspended in cold PBS on ice and then centrifuged again to wash out PI. The cell pellet was resuspended in cold 2% PFA and incubated on ice for 30 minutes. After PFA incubation, cold PBS was added to the samples to further dilute the PFA and then centrifuged as before. The cell pellet was washed with cold PBS and centrifuged again. Once the PBS was removed, the cells were suspended in 2% Fetal Bovine Serum (FBS) for 20 minutes. After blocking for 20 minutes, the samples were centrifuged. The cell pellet was resuspended in primary anti-HA epitope mouse antibody (1:1000) in a 2% FBS solution and incubated on ice for 1 hour. Then cold PBS was added to dilute the primary solution and the cells were centrifuged to remove the primary. Samples were washed with cold PBS and centrifuged again. Then the cells were resuspended in secondary anti-mouse Alexa488 antibody (1:1000) in a 2% FBS solution for 30 minutes on ice. Cold PBS was added to dilute the secondary solution and the samples were centrifuged to remove the secondary and then washed with cold PBS. After the PBS wash, the cells were resuspended in cold PBS and immediately analyzed on the BD Accuri C6 flow cytometer. Untreated cells that served as a no antibody control condition were only suspended in 2mM EDTA/PBS without PI and were simply resuspened in cold PBS after PFA fixation and kept on ice until analysis. Quantification was performed by applying the same gate to all samples, excluding PI labeled cells, and collecting the fluorescence intensity from the 90th percentile of the total cell population. The fluorescence of untreated cells, no antibody control condition was subtracted from the fluorescence of cells stained with dye. Then the fluorescence intensity of each experimental condition was averaged from at least 3 experiments carried out on separate days. The conditions were normalized to the untreated cell control (baseline) and the data is shown as mean ± S.E.M. of these independent replicate experiments.
Supplementary Material
Acknowledgments
This work was supported as part of the NIH Technology Centers for Networks and Pathways (U54GM103529).
References
- 1.Jing C, Cornish VW. Acc Chem Res. 2011;44:784–792. doi: 10.1021/ar200099f. [DOI] [PMC free article] [PubMed] [Google Scholar]
- 2.Miller LW, Cai Y, Sheetz MP, Cornish VW. Nat Methods. 2005;2:255–257. doi: 10.1038/nmeth749. [DOI] [PubMed] [Google Scholar]
- 3.Keppler A, Gendreizig S, Gronemeyer T, Pick H, Vogel H, Johnsson K. Nat Biotechnol. 2003;21:86–89. doi: 10.1038/nbt765. [DOI] [PubMed] [Google Scholar]
- 4.Los GV, Encell LP, McDougall MG, Hartzell DD, Karassina N, Zimprich C, Wood MG, Learish R, Ohana RF, Urh M, Simpson D, Mendez J, Zimmerman K, Otto P, Vidugiris G, Zhu J, Darzins A, Klaubert DH, Bulleit RF, Wood KV. ACS Chem Biol. 2008;3:373–382. doi: 10.1021/cb800025k. [DOI] [PubMed] [Google Scholar]
- 5.Chen I, Howarth M, Lin W, Ting AY. Nat Methods. 2005;2:99–104. doi: 10.1038/nmeth735. [DOI] [PubMed] [Google Scholar]
- 6.Fernandez-Suarez M, Baruah H, Martinez-Hernandez L, Xie KT, Baskin JM, Bertozzi CR, Ting AY. Nat Biotechnol. 2007;25:1483–1487. doi: 10.1038/nbt1355. [DOI] [PMC free article] [PubMed] [Google Scholar]
- 7.Yin J, Liu F, Li X, Walsh CT. Journal of the American Chemical Society. 2004;126:7754–7755. doi: 10.1021/ja047749k. [DOI] [PubMed] [Google Scholar]
- 8.Kroeze WK, Sheffler DJ, Roth BL. Journal of cell science. 2003;116:4867–4869. doi: 10.1242/jcs.00902. [DOI] [PubMed] [Google Scholar]
- 9.Hislop JN, von Zastrow M. Methods Mol Biol. 2011;746:425–440. doi: 10.1007/978-1-61779-126-0_25. [DOI] [PMC free article] [PubMed] [Google Scholar]
- 10.Turvy DN, Blum JS. Curr Protoc Immunol. 2001 doi: 10.1002/0471142735.im1807s36. Chapter 18, Unit 18 17. [DOI] [PubMed] [Google Scholar]
- 11.Szent-Gyorgyi C, Schmidt BF, Creeger Y, Fisher GW, Zakel KL, Adler S, Fitzpatrick JA, Woolford CA, Yan Q, Vasilev KV, Berget PB, Bruchez MP, Jarvik JW, Waggoner A. Nat Biotechnol. 2008;26:235–240. doi: 10.1038/nbt1368. [DOI] [PubMed] [Google Scholar]
- 12.Szent-Gyorgyi C, Stanfield RL, Andreko S, Dempsey A, Ahmed M, Capek S, Waggoner AS, Wilson IA, Bruchez MP. Journal of molecular biology. 2013;425:4595–4613. doi: 10.1016/j.jmb.2013.08.014. [DOI] [PMC free article] [PubMed] [Google Scholar]
- 13.Fisher GW, Adler SA, Fuhrman MH, Waggoner AS, Bruchez MP, Jarvik JW. J Biomol Screen. 2010;15:703–709. doi: 10.1177/1087057110370892. [DOI] [PubMed] [Google Scholar]
- 14.Holleran J, Brown D, Fuhrman MH, Adler SA, Fisher GW, Jarvik JW. Cytometry A. 2010;77:776–782. doi: 10.1002/cyto.a.20925. [DOI] [PMC free article] [PubMed] [Google Scholar]
- 15.Grover A, Schmidt BF, Salter RD, Watkins SC, Waggoner AS, Bruchez MP. Angewandte Chemie. 2012;51:4838–4842. doi: 10.1002/anie.201108107. [DOI] [PMC free article] [PubMed] [Google Scholar]
- 16.Whiteley NM, Berg HC. Journal of molecular biology. 1974;87:541–561. doi: 10.1016/0022-2836(74)90103-x. [DOI] [PubMed] [Google Scholar]
- 17.Walther FJ, Wade AB, Warburton D, Forman HJ. American journal of respiratory cell and molecular biology. 1991;4:364–368. doi: 10.1165/ajrcmb/4.4.364. [DOI] [PubMed] [Google Scholar]
- 18.Lentz BR. European biophysics journal : EBJ. 2007;36:315–326. doi: 10.1007/s00249-006-0097-z. [DOI] [PubMed] [Google Scholar]
- 19.Szent-Gyorgyi C, Schmidt BF, Fitzpatrick JA, Bruchez MP. Journal of the American Chemical Society. 2010;132:11103–11109. doi: 10.1021/ja9099328. [DOI] [PMC free article] [PubMed] [Google Scholar]
- 20.Yushchenko DA, Zhang M, Yan Q, Waggoner AS, Bruchez MP. Chembiochem : a European journal of chemical biology. 2012;13:1564–1568. doi: 10.1002/cbic.201200334. [DOI] [PMC free article] [PubMed] [Google Scholar]
- 21.Yan Q, Schwartz SL, Maji S, Huang F, Szent-Gyorgyi C, Lidke DS, Lidke KA, Bruchez MP. Chemphyschem : a European journal of chemical physics and physical chemistry. 2014;15:687–695. doi: 10.1002/cphc.201300757. [DOI] [PMC free article] [PubMed] [Google Scholar]
- 22.Saunders MJ, Szent-Gyorgyi C, Fisher GW, Jarvik JW, Bruchez MP, Waggoner AS. Methods. 2012;57:308–317. doi: 10.1016/j.ymeth.2012.02.003. [DOI] [PMC free article] [PubMed] [Google Scholar]
- 23.Klausner RD, Donaldson JG, Lippincott-Schwartz J. The Journal of cell biology. 1992;116:1071–1080. doi: 10.1083/jcb.116.5.1071. [DOI] [PMC free article] [PubMed] [Google Scholar]
- 24.Puthenveedu MA, Lauffer B, Temkin P, Vistein R, Carlton P, Thorn K, Taunton J, Weiner OD, Parton RG, von Zastrow M. Cell. 2010;143:761–773. doi: 10.1016/j.cell.2010.10.003. [DOI] [PMC free article] [PubMed] [Google Scholar]
- 25.Cao TT, Deacon HW, Reczek D, Bretscher A, von Zastrow M. Nature. 1999;401:286–290. doi: 10.1038/45816. [DOI] [PubMed] [Google Scholar]
- 26.Spector I, Shochet NR, Kashman Y, Groweiss A. Science. 1983;219:493–495. doi: 10.1126/science.6681676. [DOI] [PubMed] [Google Scholar]
Associated Data
This section collects any data citations, data availability statements, or supplementary materials included in this article.


