
Figure 4.
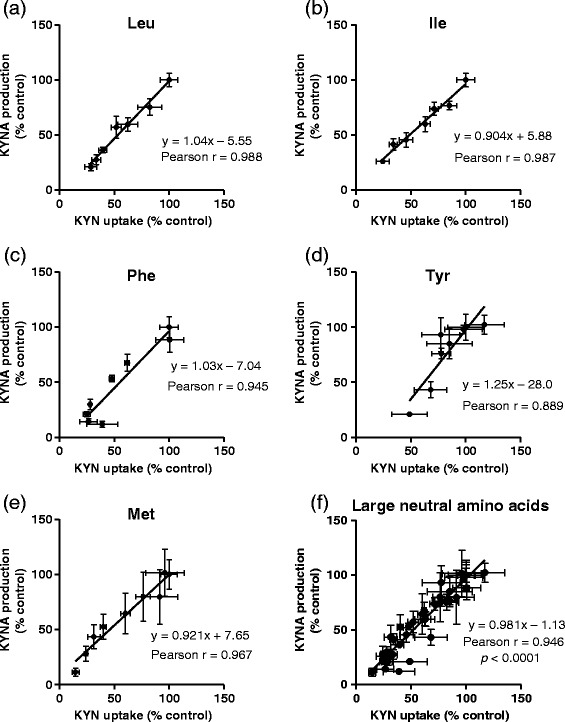
Correlation between inhibitory rates for KYNA production and tissue KYN concentration by (a) leucine (Leu), (b) isoleucine (Ile), (c) phenylalanine (Phe), (d) tyrosine (Tyr), (e) methionine (Met), and (f) all five large neutral amino acids. Values are expressed as mean ± SE (n = 4–6). Lines represent linear regression of data.