

Abstract
Hypogonadatropic hypogonadism (HH) can be acquired through energy restriction or may be inherited as congenital hypogonadotropic hypogonadism and its anosmia-associated form, Kallmann's syndrome. Congenital hypogonadotropic hypogonadism is associated with mutations in a group of genes that impact fibroblast growth factor 8 (FGF8) function. The Sirt1 gene encodes a nicotinamide adenine dinucleotide-dependent histone deacetylase that links intracellular metabolic stress to gene expression. Herein Sirt1−/− mice are shown to have HH due to failed GnRH neuronal migration. Sirtuin-1 (Sirt1) catalytic function induces GnRH neuronal migration via binding and deacetylating cortactin. Sirt1 colocalized with cortactin in GnRH neurons in vitro. Sirt1 colocalization with cortactin was regulated in an FGF8/fibroblast growth factor receptor-1 dependent manner. The profound effect of Sirt1 on the hormonal status of Sirt1−/− mice, mediated via defective GnRH neuronal migration, links energy metabolism directly to the hypogonadal state. Sirt1-cortactin may serve as the distal transducer of neuronal migration mediated by the FGF8 synexpression group of genes that govern HH.
The release of GnRH from a distinct population of cells in the hypothalamus is essential for mammalian reproduction. GnRH stimulates the anterior pituitary to secrete gonadotropins, including FSH and LH (1). Hypogonadotropic hypogonadism (HH) is characterized by the failure of secondary gonadal functions that can be due to either congenital or acquired deficient gonadotropin secretion (2). Acute or chronic illness and malnutrition may induce HH. Moreover, GnRH secretion is very sensitive to calorie restriction. Congenital HH (CHH) due to GnRH deficiency and/or resistance is often associated with anosmia, termed Kallmann's syndrome (KS), and other abnormalities including hearing loss, midline malformations, and unilateral agenesis. Mutations in fibroblast growth factor 8 (FGF8) and fibroblast growth factor receptor 1 (FGFR1) account for more than 12% of KS cases, and recent studies suggest that mutations in the FGF8 synexpression group contribute to the disease (3). The FGF8 synexpression group of genes show spatiotemporal expression patterns that are similar to FGF8 and also modulate the signaling efficiency of FGF8 through FGFR1.
In mice the GnRH neurons have a unique point of origin within the vomeronasal organ (VNO) at embryonic day (E) 10.5 (4). GnRH neurons migrate from the VNO across the cribriform plate (CP) and through the basal forebrain (FB) to arrive within the presumptive hypothalamus by E17.5. In the FB, the GnRH neurons turn toward the developing hypothalamus, guided by the vomeronasal nerve cortical branch. Subsequently their axons extend into the median eminence, facilitating the secretion of GnRH into the hypophyseal system.
Genetic analysis in mice has led to an understanding of a subset of genes involved in normal migration of GnRH neurons. In both humans and mice, FGF8 is an important determinant of GnRH production (5). During this migratory journey starting at age E10.5 to its completion at birth, a number of neuronal guidance cues have been identified. The guidance of vomeronasal nerve axons, and thereby the migration of GnRH neurons, is dependent on semaphorin (Sema)-3A (6). Reelin functions in the extracellular matrix of the olfactory bulb to deflect the course of migrating GnRH neurons into the ventral FB (7). Directional cues to GnRH neuronal migration in the nasal compartment include guidance molecules [Sema4D, Sema7a, hepatocyte growth factor, stromal cell-derived factor-1 (chemokine [C-X-C motif] ligand-12)], whereas Slit2 and Robo3 mediate the final stages of migration (8).
The sirtuin (SIRT) family of proteins were initially identified as orthologs of the yeast silent information regulatory protein 2 (Sir2) and convey diverse functions in a variety of physiological settings. The seven mammalian orthologs of yeast Sir2, named Sirt1 to Sirt7, convey distinct functions; Sirt1 demonstrates the greatest homology to the yeast Sir2 gene. Sirt1 conveys nicotinamide adenine dinucleotide (NAD+)-dependent deacetylase activity for both histone and nonhistone substrates (9). The expression and activity of Sirt1 is tightly regulated, contributing to its tissue-specific functions (10) and its important roles in physiology and disease.
Sirt1-deficient (Sirt1−/−) mice die postnatally from a variety of abnormalities, including pancreas, lung, skeletal, and heart defects (11). Although the penetrance of the postnatal lethality is strain dependent, with improved survival on the 129/Sv-CD1 background, analysis of Sirt1−/− animals demonstrated infertility as a common phenotype. Sirt1 is highly expressed in the gonads (11), and gonadogenesis is abnormal in Sirt1−/− mice with oocytes failing to mature and immature sperm (14). Maturation of the gonads is in part dependent on a normal pituitary gonadal axis. Analysis of Sirt1 expression in the pituitary demonstrated high levels in the thyrotropes. Pituitary GH levels and IGFs are not affected in Sirt1 mutant mice (15). Further analysis of the gonads revealed abnormal Leydig and Sertoli cell maturation in the testis associated with reduced FSH and LH serum levels (16). In normal animals, the distribution of Sirt1 among the hormone-secreting pituitary cells in mice and humans demonstrates that Sirt1 is localized in TSH-positive cells but is barely detectable in the ACTH-, FSH-, LH/GH-, or prolactin-positive cells (17).
The current studies were undertaken to assess the function of the pituitary gland in Sirt1−/− mice and to determine the molecular mechanisms governing the reduction in serum androgens. We show Sirt1−/− mice have HH due to failed GnRH neuronal migration. Using a GnRH neuronal cell line, we demonstrate Sirt1 induces GnRH neuronal migration dependent on Sirt1 catalytic function. Sirt1 binds and deacetylates cortactin in the cytoplasm, and using Sirt1−/− mice, we demonstrate sirtuin inhibitors require Sirt1 for their effect on cortactin deacetylation. Sirt1 is shown to induce GnRH neuronal migration via deacetylation of cortactin. The profound effect of Sirt1 on the hormonal status of Sirt1−/− mice is mediated via a defect in GnRH neuronal migration mediated via acetylation of cortactin.
Materials and Methods
Transgenic mice
Sirt1 knockout (Sirt1−/−) mice were provided by Dr Michael McBurney and have been previously described (11). The appropriate institutional committee approved protocols were followed when working with these mice. To obtain mouse embryos of defined gestational ages of 14.5 days (E14.5) and 3-month-old noncastrated mice, Sirt1 wild-type (Sirt1+/+) and Sirt1−/−, Sirt1 heterozygous mice (Sirt1+/−) were mated, and female mice with an observed vaginal plug were counted as 0.5 days postcoitum. To confirm the genotype of the embryos, a PCR analysis was conducted on extracted tail DNA using an oligonucleotide pair directed toward exon 5 of Sirt1 and single Pgk1 cassette primer specific for Sirt1−/− allele, generating, respectively, a Sirt1 endogenous amplicon of 423 bp and a Sirt1-Pgk1 knockout vector amplicon of 526 bp (nucleotide sequences were forward, 5′-TTCACATTGCATGTGTGTGG-3′, and reverse, 5′-TAGCCTGCGTAGTGTTGGTG-3′ and Pgk1 reverse, 5′-ATTTGGTAGGGACCCAAAGG-3′).
Cell culture, plasmid, transfection, and infection
GN11, human embryonic kidney (HEK) 293T, and immortalized mouse embryonic fibroblasts (3T3) Sirt1+/+ and Sirt1−/− cells (18) were maintained in DMEM supplemented with 10% fetal bovine serum (FBS) (Gemini Bio-Products), 100 U/mL penicillin, and 100 μg/mL streptomycin in a humidified atmosphere containing 5% CO2 at 37°C (19). Myc-tagged SIRT1 wild type, the catalytic dead mutant (H363Y), the FLAG-tagged SIRT1, and the control expression vectors were previously described (18). The cDNA encoding mouse cortactin was amplified using either FLAG-tagged cortactin wild-type or acetylation mutant plasmids (provided by Dr Xiaohong Zhang, Department of Pathology and Cell Biology, University of South Florida Morsani College of Medicine, Tampa, FL) as templates and subcloned into the lentiviral pCDH-CMV-MCS-EF1-RFP vector (System Biosciences) at the XbaI and BamHI sites. A single FLAG sequence tag (Asp-Tyr-Lys-Asp-Asp-Asp-Asp-Lys) was introduced to the N terminus of cortactin to produce a fusion protein. Cell transfection and infection were performed as previously described (20). The histone deacetylase (HDAC) inhibitor trichostatin A (TSA; 1 μM; catalog number 19–138; Calbiochem), nicotinamide (NAM; 20 mM, catalog number N0636; Sigma-Aldrich) and sirtinol (50 μM, catalog number 566321; Calbiochem) were used as previously described (21). Briefly, NAM is the first product from hydrolysis of the pyridinium-N-glycosidic bond of nicotinamide adenine dinucleotide, and it is an inhibitor of Sirt1 enzyme from different organisms, in a noncompetitive manner. Sirtinol is reported to be a specific inhibitor of Sirt1 enzyme (21). Therefore, to study the effect of Sirt1 on cellular migration, we used sirtinol and NAM as previously reported at 50 μM and 20 mM, respectively. The respective working concentration are showed by Western blot to inhibit SIRT1 deacetylation activity (21).
Radioimmunoassay
Serum levels of FSH, LH, and T were measured by a RIA on the peripheral blood of noncastrated 3-month-old Sirt1+/+ and Sirt1−/− mice, injected sc with either GnRH (30 ng) or saline solution as previously described (22). Briefly, 15 minutes after the injection, the serum was separated by centrifugation and stored at −20°C before analysis by the standard protocols of the Center for Research in Reproduction Ligand Assay and Analysis Core at the University of Virginia (Charlottesville, Virginia).
Fixation and tissue preservation
At E14.5, the mother was killed and the embryo heads were removed and incubated in a freshly prepared 4% paraformaldehyde (PFA) solution (in PBS, pH 7.4) overnight (O/N) at +4°C, followed by several washes in PBS. Finally, samples underwent a cryoprotection process passing through a 15% and 30% sucrose solutions at +4°C, frozen in liquid nitrogen, and stored in a deep freezer at −80°C until sectioned. Heads were serially cut in the sagittal plane at 25 μm thickness with a cryostat. Hematoxylin and eosin and immunostaining were performed. The plane of sectioning was oriented to match the drawings corresponding to the sagittal sections of the mouse embryonic brain at E14.5.
At the age of 3 months, the animals were weighed and anesthetized with tribromoethanol (250 mg/kg). Animals underwent intracardiac perfusion with saline (0.9%) followed by 4% PFA. The brains were removed and stored in a freshly prepared 4% PFA solution O/N at +4°C, followed by several washes in 0.01 M PBS. Finally they were processed passing through 15% and 30% sucrose solutions at +4°C and stored in a deep freezer at −80°C until sectioned. Brains were cut in the coronal plane at 25 μm thickness with a cryostat. The plane of sectioning was oriented to match the drawings corresponding to the coronal sections of the mouse brain atlas.
GnRH and Sirt1 immunofluorescence staining on tissue
The tissue sections were probed using a rabbit polyclonal antibody against either GnRH (catalog number ab5617; Abcam) or Sirt1 (provided by Y.H.). The primary antibodies were detected with antirabbit Alexa Fluor 488 and 568 (GnRH and Sirt1, respectively) (Alexa Fluor 488 and 568, catalog numbers A11008 and A21428, respectively). Briefly, the tissue sections were allowed to dry for 2 hours at room temperature, followed by two 5-minute washes with Tris-buffered saline with 1% Triton X-100 (TBS-T; pH 7.6). The sections were permeabilized for 30 minutes with Triton X-100 and blocked for 30 minutes in PBS containing 5% of normal goat serum. After blocking solution, they were rinsed three times for 2 minutes each with TBS-T and probed with the primary antibody O/N at +4°C. The following day, the slides were rinsed three times for 2 minutes each with TBS-T and probed for 1 hour at room temperature with a secondary antibody. The sections were washed for 5 minutes with TBS-T, mounted, and examined by confocal microscopy (Nikon C2+ confocal microscope system). The total number of GnRH neurons was determined by counting the GnRH-positive cells in the processed sagittal sections of each embryo head, considering the three regions of interest: the VNO, CP, and FB (6). Every second section was processed for GnRH immunostaining.
A freeware software was used to reconstruct a three-dimensional view of the mouse embryo brain structures (Brain Explorer 2; Allen Institute for Brain Science, http://www.brain-map.org).
General anosmia
General anosmia was tested as previously described (23). Briefly, the tests were conducted in the last 4 hours of the light phase in rodent cages, each containing 6 cm of wood chip bedding. During an experimental session, each animal was tested a total of six times. Fifty percent of the time the test used an unscented, glass marble and 50% of the time a chocolate candy (sweet, chocolate scent) was used. The center section of the cage was always used as a starting point for the animal. For each of the six trials per experimental session, a coin was flipped to determine whether the scented or unscented object was to be hidden for that particular trial. Mice were placed in the center of the experimental cage and retrieval time was measured. Each trial could last up to 600 seconds. If the object was not retrieved within 600 seconds, a value of 600 seconds was scored. For an object to be scored as retrieved, at least 5% of the object had to be visible for consistency. Between trials, each mouse was replaced in its home cage with access to food and water for 2 minutes. The animals were not fasted before the beginning of the experiment.
This behavioral paradigm, to test for general anosmia, is based on the premise that mice will find hidden food items more quickly, based on olfactory ability, than the random discovery of a buried, unscented object. The time taken to find the unscented marble was an internal animal control to normalize between possible differences in locomotor activity, general curiosity, and anxiety-based digging behaviors that might increase the chances of a false-positive result.
Western blot and immunoprecipitation assay
Whole-cell lysates (50 μg) were separated by 10% SDS-PAGE gel, and the proteins were transferred to nitrocellulose membrane for Western blotting as previously described (24) and probed for Sirt1 (catalog number 15404; Santa Cruz Biotechnology), Sirt2 (catalog number 20966; Santa Cruz Biotechnology), cortactin (catalog number 11408; Santa Cruz Biotechnology), acetyl-cortactin (catalog number 09–881; Millipore), Rho GDI (catalog number 360; Santa Cruz Biotechnology), vinculin (catalog number 9131; Sigma-Aldrich) and β-tubulin (catalog number 9935; Santa Cruz Biotechnology). Immunoprecipitation (IP) assays were performed in HEK 293T cells as indicated. Cells were pelleted and lysed in buffer (50 mM HEPES, pH 7.2; 150 mM NaCl; 1 mM EDTA; 1 mM EGTA; 1 mM dithiothreitol; and 0.1% Tween 20) supplemented with a protease inhibitor cocktail (catalog number 04693116001; Roche). Antibodies used for IP were anti-c-MYC (catalog number 40; Santa Cruz Biotechnology) and anti-FLAG clone M2 (catalog number 8592; Sigma-Aldrich).
Wound-healing and migration assays
The three-dimensional invasion assay was performed as previously reported (25). Briefly, 100 μL of 1.67 5 mg/mL rat tail collagen type I (catalog number 354236; BD Biosciences) was pipetted into the top chamber of a 24-well, 8-μm pore Transwell (catalog number 3464; Corning). The Transwell was incubated at +37°C O/N to allow the collagen to solidify. Thirty thousand cells were then seeded on the bottom of the Transwell membrane and allowed to attach. Serum-free growth medium was placed into the bottom chamber, whereas 5% FBS was used as a chemoattractant in the medium of the upper chamber. The cells were then chemoattracted across the filter through the collagen above for 3 days. Cells were fixed in 4% PFA, permeabilized with 0.2% Triton-X in PBS, and then stained with 40 μg/mL propidium iodide for 2 hours. Fluorescence was analyzed by confocal z-sections (one section every 20 μm) at ×10 magnification from the bottom of the filter using a Zeiss LSM 510 Meta inverted confocal microscope at the Sidney Kimmel Cancer Center Bioimaging Facility. Wound-healing migration assays were performed as described (26). At 0 and 24 hours from the initial scratch, the wound area was measured by an imaging analysis software (version 1.48; ImageJ, National Institutes of Health, Bethesda, Maryland). Then the ratio between the area at 24 and 0 hours was calculated to define the wound closure percentage. The absolute number of cells moved into the wound was calculated by counting the number of cells migrated from the assigned edges at time 0 into the wound after 24 hours.
Persistence of migratory directionality assay
To determine the cellular migratory velocity and distance, the persistence of migratory directionality assays were conducted as previously described (27, 28). For migration assays, cells were transduced with retroviral expression vectors encoding either SIRT1 or H363Y. In circumstances as described, transduction was followed by stable transfection with either FLAG-tagged cortactin or its mutants. Seventy-two hours after the transfection, the cells were detached with trypsin and 2 × 10⁵ of cells were reseeded in the six-well plate precoated with fibronectin (10 μg/mL) and incubated at 37°C. The cells were washed with medium after 30 minutes, and images were collected at the time points indicated. The experiments were carried out in triplicate and the number of attached cells at 30 minutes was counted. The images were taken with the ×20 objective (Axiovert 200; Zeiss) and further analyzed by Image J (National Institutes of Health), and the average cell migration was calculated (25). For time-lapse observation of cell movement, cells on 12-well plates were maintained in DMEM with 10% fetal calf serum and HEPES. Cells were placed in an incubator to maintain the temperature at 37°C and 5% CO2. The cell movement videos were taken at 5-minute intervals by using a Nikon Eclipse TE-300 inverted microscope system. The cell movement velocity was determined by tracing the single cells at different time points using MetaMorph software.
RNA extraction and real-time PCR
RNA extraction from cells (QIAGEN RNeasy minikit, catalog number 74104) and whole-brain tissue (QIAGEN RNeasy lipid tissue minikit, catalog number 74804) was conducted according to the manufacturer's guidelines. Real-time PCR analysis was conducted in an Agilent 2100 Bioanalyzer (Agilent Technologies), using Power SYBR Green (catalog number 4367659; Life Technology) according to the manufacturer's guidelines. Equal quantities of RNA (1 μg) were used for the reverse transcription reactions. Primers for all the genes are reported in Supplemental Table 1. Briefly, each cycle consisted of 10 seconds of denaturation at +94°C 15 seconds of annealing at each annealing temperature (Supplemental Table 1) and 20 seconds of extensions at +72°C. Thermal cycling was performed for 40 cycles. The mRNA ratio was calculated using the following equation (29):
whereas ΔΔCt =(ΔCt Reference = Ct Reference gene WT − Ct Reference gene KO) − (ΔCt Target = Ct Target gene WT − Ct Target gene KO)
where the target gene represents one of the sirtuins (Sirt1–2) and the reference gene is Gapdh.
Immunofluorescence
Immunofluorescence was performed on GN11 cells maintained in 10% FBS in the presence of either mouse FGF8 (50 ng) (catalog number 423-F8; R&D Systems) or vehicle as control at different time points (0, 24, and 48 h). Briefly, 2 × 10⁴ GN11 cells were plated in a chamber slide (catalog number C6932; Sigma-Aldrich) the day before the experiment. After the O/N incubation, the cells were treated with either FGF8 peptide or vehicle for 8 hours. The FGF8 treatments were prepared by the addition of heparin (1 μg) (catalog number H3149; Sigma-Aldrich). After the treatment the cells were washed three times with PBS one time (5 min at room temperature each) and permeabilized with a wash in 0.5% Triton X100 (5 min at room temperature). The cells were then fixed with 4% PFA (20 min at room temperature). After two washes in PBS (5 min each at room temperature), the cells were incubated in blocking solution for 1 hour (5% normal goat serum). The subcellular localization of endogenous Sirt1 and cortactin was determined using anti-Sirt1 (catalog number 15404; Santa Cruz Biotechnology) and anticortactin (catalog number 55579; Santa Cruz Biotechnology) with an O/N incubation at +4°C. The following day, the cells were rinsed three times with PBS with 0.05% Tween 20 (PBS-T) (5 min each at room temperature) and probed for 1 hour at room temperature with secondary antibodies. The cells were washed three times with PBS with 0.05% Tween 20 (5 min each at room temperature), mounted, and examined by confocal microscopy (Nikon C2+ confocal microscope system).
Apoptosis study
Dying cells were detected using an in situ apoptosis detection kit in accordance with the manufacturer's instructions (ApopTag Red, catalog number S7165; Millipore) (30). Briefly, DNA fragmentation is usually associated with ultrastructural changes in cellular morphology during apoptosis. The DNA strand breaks are detected by enzymatically labeling the free 3′-OH termini with modified nucleotides. These new DNA ends that are generated upon DNA fragmentation are typically localized in morphologically identifiable nuclei and apoptotic bodies. The Sirt1+/+ and Sirt1−/− E14.5 brain sections were postfixed with 1% PFA (10 min at room temperature) and washed twice in PBS (5 min each at room temperature). Then the sections were precooled with ethanol and acetic acid (ratio 2:1) (5 min at −20°C). After the precooling the sections were washed twice in PBS (5 min at room temperature each) and equilibrated with equilibration buffer (10 sec at room temperature). After the equilibration, the sections were incubated for 1 hour at +37°C with a terminal deoxynucleotidyl transferase enzyme. The reaction was stopped at room temperature for 10 minutes by incubating the section in stopping solution. After three washes in PBS (1 min each at room temperature), the slides were mounted and examined by confocal microscopy.
Statistical analysis
The statistical analysis was performed using Prism 4 software (GraphPad Software). Differences were considered statistically significant with values at P < .05.
To compare the GnRH effect on circulating T, FSH, and LH levels in Sirt1+/+ and Sirt1−/− mice, a two-way ANOVA was performed. A t test was performed to compare the mean values between Sirt1+/+ and Sirt1−/− mice within the two groups (saline and GnRH). To compare the GnRH positive neuron populations, localized in the three embryo brain regions of the Sirt1+/+ and Sirt1−/− mice (VNO, CP, and FB, respectively), a one-way ANOVA followed by a post hoc Tukey's test was performed. The total number of GnRH-positive neurons and the percentage of migrated cells compared between Sirt1+/+ and Sirt1−/− mice were analyzed by an unpaired t test. A one-way ANOVA followed by a post hoc Tukey's test was performed to compare between the different experimental conditions, both the percentage of wound closure and the number of migrated cells (transwell migration and three dimensional migration assay). The cytoplasmic intensity of Sirt1 in the GN11 cells at different time points (0, 24, and 48 h, respectively) in the presence of either FGF8 or vehicle was analyzed by a two-way ANOVA followed by a post hoc Tukey's test. Enrichment of acetyl-cortactin signal detected by Western blot in GN11 cells treated with either FGF8 or vehicle was analyzed by an unpaired t test. Both Sirt2 mRNA and protein levels between Sirt1+/+ and Sirt1−/− mouse brain tissues were analyzed by an unpaired t test. Sirt1 mRNA levels between GN11 and 3T3 wild-type cells were analyzed by an unpaired t test. Sirt1–7 mRNA levels in GN11 cells were analyzed by a one-way ANOVA followed by a post hoc Tukey's test. All data are expressed as mean ± SEM.
Results and Discussion
Sirt1−/− mice show an impaired GnRH neuronal migration
Previous studies had demonstrated a decrease in the FSH and LH levels in Sirt1−/− mice (16). A reduction of T, FSH (P < .001), and LH was detected in Sirt1−/− mice injected with saline solution. In both Sirt1+/+ and Sirt1−/− mice, a significant increase of T (15.12 ± 2.70 ng/mL and 11.2 ± 0.59 ng/mL, respectively) (P < .001), FSH (95.64 ± 19.7 ng/mL and 38.13 ± 6.15 ng/mL, respectively) (P < .01), and LH (12.54 ± 0.47 ng/mL and 7.41 ± 0.54 ng/mL, respectively) (P < .001) levels was detected in response to GnRH stimulation. Moreover, a decreased circulating level of T, FSH (P < .05), and LH (P < .01) was observed in Sirt1−/− mice after GnRH administration (Figure 1A). We inferred the primary cause for reduced FSH and LH levels in Sirt1−/− was therefore a decrease in GnRH production.
Figure 1.

Sirt1−/− mice show hypogonadotropic hypogonadism due to reduced GnRH neuronal migration. A, Sirt1−/− mice and litter mate control male mice were subjected to either GnRH or saline solution injections. Serum samples were assessed for T, FSH, and LH. B, Three-dimensional reconstruction of a mouse embryo brain at E14.5. GnRH neurons use vomeronasal axons (red lines), which form the vomeronasal nerve, as guides to migrate from the VNO, through the CP to the FB during the embryonic development. C, coronal; S, sagittal; T, transverse plane. Sirt1+/+ (C) and Sirt1−/− (D) E14.5 mouse heads are shown. The sections were stained with 4′,6′-diamino-2-phenylindole (DAPI; blue) and immunostained for GnRH (green) to detect the migration of the GnRH-positive neurons (white arrows). E and F, Relative proportion of GnRH neurons in the VNO, CP, and FB of Sirt1+/+ and Sirt1−/− mice. G, Quantitation of the total number of GnRH-positive neurons in E14.5 mouse embryo heads. H, Percentage of GnRH neurons migrated to the FB. Data are shown as mean ± SEM of three separate animals. *, P < .05; **, P ≤ .01; ***, P < .001.
We examined the trajectory of the GnRH migrating neurons in the mouse embryo brain at E14.5 (Figure 1B and Supplemental Figure 1A). GnRH-positive neurons were present in Sirt1+/+ mice in the VNO, CP, and FB, respectively (Figure 1C) and reduced in Sirt1−/− mice (Figure 1D). As previously shown (6), most of the GnRH-positive neurons (568% ± 31%, 64% ± 4%) were located at their terminal destination in the FB in Sirt1+/+ mice (P < .01) (Figure 1E). In contrast, most the GnRH neurons in the Sirt1−/− brain remained at the VNO and CP, failing to migrate into the FB (P < .01) (Figure 1F). We determined that the total number of GnRH-positive neurons were decreased from an average of 890 ± 42 in Sirt1+/+ mice to an average of 29 ± 2 in Sirt1−/− mice (P < .001) (Figure 1G). The percentage of GnRH-positive neurons that migrated to the FB were essentially undetectable in the Sirt1−/− mice when compared with the Sirt1+/+ mice (P < .01) (Figure 1H). To investigate whether the reduced number of GnRH neurons could be due to an increased neuronal apoptotic activity, we detected apoptotic cells in E14.5 Sirt1+/+ and Sirt1−/− mouse FB by a terminal deoxynucleotidyl transferase dUTP nick end labeling. We found increased neuronal apoptosis in Sirt1−/− E14.5 mice FB (P < .05) (Supplemental Figure 1, B and C). Our findings are in accordance with the antiapoptotic effect of Sirt1 in E14.5 mouse FB (31).
To better understand the fate of the GnRH neurons and their migration process, we immunostained the GnRH neurons in 3-month-old Sirt1+/+ and Sirt1−/− mouse brains. We found Sirt1−/− brains have less GnRH immuoreactivity compared with Sirt1+/+ mice (Supplemental Figure 2A). We next investigated the potential of the other sirtuin family members to regulate GnRH neuronal migration. Most of the sirtuins are precluded because they are restricted to the nucleus (Sirt6 and Sirt7) or mitochondria (Sirt3–5), whereas others (Sirt1 and Sirt2) shuttle between the nucleus and cytoplasm (32). In the context of neuronal migration and brain physiology, Sirt1 and Sirt2 were found highly expressed in the fetal and adult brain (13, 34). Sirt2 has the ability to deacetylate α-tubulin, which is the main component of microtubules together with β-tubulin. Sirt2 is implicated in multiple brain functions including impaired cytoskeletal growth cone dynamics, neurite outgrowth, and oligodendrocyte arboriation in vitro (33). It has been reported that Sirt2 does not bind cortactin directly and is not involved in promoting cellular migration via cortactin deacetylation (35). Conversely, Sirt1 has a promigratory action, acting as a cell migration stimulator (35). Based on these findings, we hypothesized that Sirt1 may be a candidate to promote GnRH neuronal migration during fetal development by deacetylating cortactin. The role of Sirt2 in regulating either directly or indirectly the acetylation status of cortactin is controversial (35). To investigate any compensatory effect of Sirt2 upon knocking down Sirt1, we measured the endogenous levels of both the mRNA and protein of Sirt1 and Sirt2 from Sirt1+/+ and Sirt1−/− mouse brains of 3-month-old animals. A quantitative analysis of RNA (Supplemental Figure 2B) and protein (Supplemental Figure 2, C and D) levels do not show any significant difference between the Sirt1+/+ and Sirt1−/− brain tissues.
Sirt1 catalytic activity is required for the induction of GnRH neuronal cell migration and invasion
To examine the molecular mechanisms by which Sirt1 promoted GnRH neuron migration, we deployed GnRH neuron cell type, GN11 (36, 37). GN11 cells were monitored for 24 hours during a wound-healing assay in the presence of sirtinol, NAM, or vehicle as a treatment control. GN11 cell migration was significantly reduced in the presence of both inhibitors after 24 hours (P < .001) (Figure 2A, left panels). Sirtinol decreased the migration by approximately 70% (P < .001) and NAM by approximately 60%, (P < .001) (Figure 2B). Moreover, after 24 hours of treatment, the number of cells that migrated into the wound were higher in the vehicle compared with sirtinol and NAM (68 ± 3, ***, 28 ± 3, and ***, 35 ± 5, respectively, means ± SEM) (***, P < .001). This finding suggests endogenous sirtuin activity contributes to GN11 cell migration. To determine whether the migration required SIRT1 catalytic activity, GN11 cells were transduced with a retroviral expression vector encoding either SIRT1 or its catalytic dead mutant (H363Y) (Figure 2A, right panels). The transduction of GN11 cells with SIRT1 induced migration into the wound (P < .01). The enhanced migrating phenotype was abrogated by transduction with the H363Y mutant when compared with GN11 cells transduced with SIRT1 (P < .05) (Figure 2C). The number of cells that migrated into the wound were higher in the GN11 cells overexpressing SIRT1 compared with the cells overexpressing the mutant H363Y or the vector control (78 ± 3, ***, 46 ± 2 and 70 ± 3, respectively, means ± SEM) (***, P < .001).
Figure 2.

Sirt1 induction of GnRH neuronal migration requires the catalytic function. A, Wound-healing assay for GN11 cells treated with either sirtinol (50 μM) or NAM (20 mM) and transduced with either retroviral expression vectors encoding SIRT1 wild type (SIRT1) or the catalytic dead mutant (H363Y). B, Quantitation of the wound area in the GN11 cells treated with either sirtinol or NAM. C, Quantitation of the wound area in the GN11 cells transduced with either SIRT1 or H363Y. D, GN11 cells treated with either sirtinol (50 μM) or NAM (20 mM) and transduced with either retroviral expression vectors encoding SIRT1 wild type (SIRT1) or the catalytic dead mutant (H363Y) were assessed in transwell migration assay. E and F, Quantitation of the transwell migration assay in the presence of either sirtinol or NAM and transduced with either SIRT1 or H363Y mutant. G, Representative images of gel matrigel invasion assay. H and I, Quantitation of the matrigel invasion assay in the presence of either sirtinol or NAM and transduced with either SIRT1 or H363Y mutant. Data are shown as mean ± SEM for five separate experiments. *, P < .05; **, P < .01; and ***, P < .001.
The matrigel invasion assay showed either sirtinol or NAM inhibited GN11 cell migration (P = .002) (Figure 2D, upper panels). Moreover, sirtinol decreased the GN11 migration by approximately 80% (P < .05) and NAM by approximately 90% (P < .01) (Figure 2E). Transduction of GN11 cells with SIRT1 enhanced matrigel invasion (P < .01), which was dependent on the SIRT1 catalytic domain (P < .001) (Figure 2, D, lower panels, and F). Quantitative analysis of the matrigel invasion assay showed a reduced number of migrated GN11 cells treated with either sirtinol (P < .001) or NAM (P < .001) (Figure 2, G and H). However, overexpression of SIRT1 promotes GN11 migration compared with H363Y (P < .01) mutant and vector control (P < .001) (Figure 2, G and I).
Cortactin deacetylation by Sirt1 in GnRH neuronal migration
To examine the molecular mechanisms further, the candidate promigratory substrates targeted by histone deacetylases were considered. Cortactin promotes fibroblast cellular motility by promoting F-actin polymerization and is acetylated in prostate cancer cells (38). Deacetylation by SIRT1 promotes cell migration in breast and prostate cancer cell lines (35, 38, 39). To determine the role of Sirt1 in regulating the cortactin acetylation in GnRH neurons, we first conducted a Western blot analysis of Sirt1−/− and Sirt1+/+ 3T3 cells. TSA (the type I/II histone deacetylase inhibitor) alone, NAM alone, or a combination of both increased the acetylation of cortactin in Sirt1+/+ 3T3 cells (∼2-fold for TSA or NAM and ∼4-fold for a combination of both) (Figure 3A). In Sirt1−/− 3T3 cells, the addition of TSA induced a 2-fold increase in cortactin acetylation, whereas NAM did not increase cortactin acetylation (Figure 3B). These studies suggest that cortactin acetylation is regulated by both NAD+-dependent and NAD+-independent deacetylase activity and that Sirt1 is a critical endogenous NAD+-dependent inhibitor of cortactin acetylation.
Figure 3.

The cortactin acetylation sites are required for Sirt1-enhanced GnRH neuronal migration. A and B, Western blot of Sirt1+/+ (A) and Sirt1−/− (B) 3T3 cells treated with HDAC inhibitor TSA (1 μM) or NAM (20 mM). The antibodies are as indicated. GDI (Santa Cruz Biotechnology) serves as a protein loading control. SE, short exposure; LE, long exposure. C, IP-Western blot of HEK 293T cells transfected with c-Myc-tagged cortactin and/or FLAG-tagged SIRT1. D, IP-Western blot of GN11 cells transfected either with expression vectors for SIRT1 or H363Y mutant. E, Time lapse video microscopy image of individual GN11 cell migration. Cells were transfected with a SIRT1 expression vector or empty vector control and expression vectors encoding either cortactin or cortactin acetylation site point mutants (9KQ, 9KR). The representative individual cell migrations are numbered. F and G, The cellular velocity (micrometers per minute) and persistence of migratory directionality (direct distance/total distance) is shown as mean ± SEM for n > 50 separate cells. *, P < .05; *, P ≤ .01).
Expression vectors encoding FLAG-tagged SIRT1 and Myc-tagged cortactin were transfected into HEK 293T cells. Immunoprecipitation of FLAG-tagged SIRT1 demonstrated the association of cortactin with SIRT1 (Figure 3C). Transduction of GN11 cells with either SIRT1 or the catalytic dead mutant H363Y demonstrated that the physical association between cortactin and SIRT1 did not require the catalytic domain (Figure 3D).
To examine further the role of cortactin acetylation in SIRT1-mediated induction of GnRH neuronal migration, video microscopy of GN11 cells was conducted. GN11 cells were transduced with either a mammalian expression vector encoding SIRT1 or cortactin or a cortactin mutant carrying two different point mutations at the acetylation site, lysine 9 (9K) (Figure 3E). The expression vectors encode cortactin in which point mutation was conducted of the nine acetylation sites (35). Expression of cortactin enhanced the velocity and distance of GN11 cell migration. In contrast, expression of the acetylation defective cortactin mutants (9KQ and 9KR) failed to induce GN11 cell migration. Expression of SIRT1 enhanced GN11 migratory velocity and distance (P < .05) (Figure 3F). Coexpression of cortactin with SIRT1 further enhanced GN11 migratory distance and velocity. SIRT1 expression failed to deacetylate the cortactin mutants and did not increase GN11 cell migration (P < .05) (Figure 3G).
Sirt1 colocalization and deacetylation of cortactin is regulated by FGF signaling
Cortactin is located in the cytoplasm. The subcellular localization of Sirt1 is known to be both cytoplasmic and nuclear (40). Our studies confirmed Sirt1 cytoplasmic localization in the ventricular zone and cerebral cortex using the same antibody under identical conditions (Figure 4A) (41). Immunofluorescence showed Sirt1 located in the cytoplasm of the neurons located in the VNO, CP, and FB at E14.5 (Figure 4B).
Figure 4.
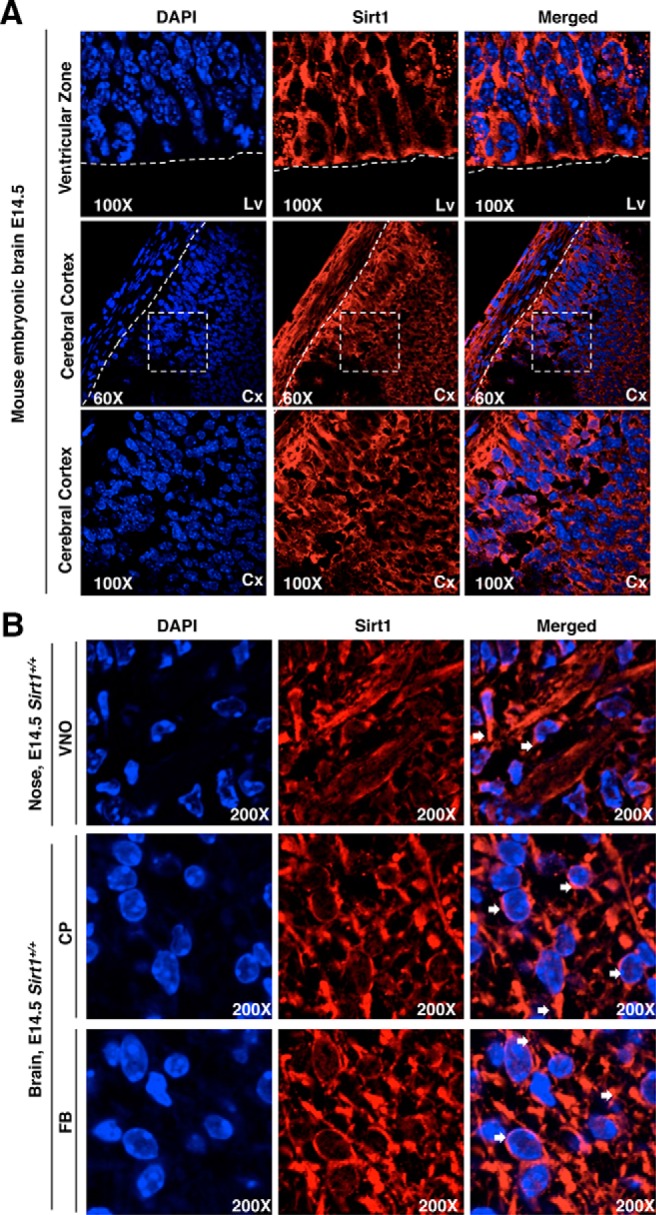
Subcellular localization of Sirt1 in mouse brain at E14.5. A and B, Sagittal sections from Sirt1+/+ E14.5 mouse heads. The sections were stained with 4′,6′-diamino-2-phenylindole (DAPI; blue) and immunostained for Sirt1 (red) to detect the subcellular location of Sirt1-positive neurons in the brain localized in the ventricular zone. Cerebral cortex (Cx), VNO, CP, and FB are indicated by white arrows.
To study FGF signaling in promoting cortactin activation via Sirt1, we first defined the endogenous level of Sirt1 in GN11 cells in comparison with the endogenous levels in 3T3 cells as a positive control for Sirt1 expression. mRNA and protein levels of endogenous Sirt1 in GN11 cells were similar to endogenous Sirt1 levels in 3T3 cells (Supplemental Figure 3, A and B, respectively). The GN11 cells were stimulated either with FGF8 peptide at different time points (0, 24, and 48 h) or vehicle compared with the control. Endogenous Sirt1 was located predominantly in the nucleus as determined by immunofluorescence (Figure 5A). After 24 and 48 hours of treatment, Sirt1/cortactin colocalization increased in the cytoplasmic compartment (Figure 5A). A quantitative analysis of cytoplasmic Sirt1 intensity at different time point shows a significant effect of FGF8 on Sirt1 cellular localization (P < .001). A significant enrichment of Sirt1 was observed in the cytoplasm at 24 hours (P < .001) and 48 hours (P < .001) (Figure 5B). A Western blot analysis (Figure 5C) showed a decrease in cortactin acetylation (∼2 fold, P < .001) after FGF8/FGFR1 activation (Figure 5D).
Figure 5.

Sirt1-cortactin association is regulated by FGFR1/FGF8. A, Subcellular localization of Sirt1 and cortactin in GN11 cells. Cells were assessed at the basal state (10% FBS) in the presence of either FGF8 (+FGF8) or vehicle (−FGF8) at different time points (0, 24, and 48 h). Immunostaining was conducted for Sirt1 (red) and cortactin (green), and 4′,6′-diamino-2-phenylindole (DAPI; (blue) was used as nuclear marker. Colocalized pixels between Sirt1 and cortactin were automatically highlighted as yellow dots by an imaging analysis software (ImageJ; National Institutes of Health). B, Quantitation of cytoplasmic Sirt1 immunoreactivity in GN11 cells. C, Acetylated-cortactin in GN11 cells treated for 24 hours with either FGF8 or vehicle. D, Cortactin acetylation fold enrichment in GN11 cells. Data are shown as mean ± SEM for n = 3 separate experiments. ***, P < .001).
The current studies identify a potential mechanism of HH in Sirt1−/− mice being due to failed GnRH neuronal migration. GnRH neuronal cell line migration, velocity, and distance traveled was induced by Sirt1 and cortactin. Sirt1 bound and deacetylated cortactin. Sirt1-dependent induction of GnRH neuronal cell line migration required the acetylation of cortactin because acetylation defective mutants of cortactin failed to collaborate with Sirt1 in the induction of neuronal cell migration. Although hypothyroidism may contribute to reduced FSH and LH levels, genetic deletion studies in the mouse demonstrated that GnRH neuronal migration is not affected by hypothyroidism (42). Together these studies demonstrate an important biological function of Sirt1 to determine the normal androgen status in vivo. Because gonadal hormones have significant effects on metabolism muscle, structure and function, tumorigenesis, and neuronal function, these studies have implications for the mechanisms governing CHH as well as other diseases.
Cortactin plays an important role in promoting cellular motility by interacting with F-actin to facilitate its polymerization and cellular branching (43, 44). The structure of cortactin includes an N-terminal acidic domain and 6.5 tandem repeats of a unique 37-amino acid sequence, which is both necessary and sufficient for F-actin binding. Nine of the 11 lysine residues that have been identified as targets for acetylation are within the tandem repeat region of cortactin (44). In the current studies, Sirt1 enhanced GnRH neuronal migration, requiring the Sirt1 catalytic domain. Recent studies have indicated that biological stimuli including brain-derived neurotrophic factor and glutamine induce cortactin acetylation (45). Herein cortactin enhanced GnRH neuronal migration in an acetylation site-dependent manner. The cortactin 9KR mutant, a nonacetylated cortactin, decreased cell velocity. This finding is similar to recent evidence that the nonacetylated mutant of cortactin 9KR decreased power spectral density-95 (power spectral density, on ODs), clustering in cortactin expressing neurons (45). The effect of amino acid substitution on the function of Sirt1 substrates is complex.
Herein FGF8 and FGFR1 activity promoted cytoplasmic distribution of Sirt1 and thereby its colocalization with cortactin in order to promote cellular migration (Figure 6). CHH resulting from failed GnRH neuronal migration in humans is known as Kallmann's Syndrome. Patients with KS have anosmia (lack of sense of smell) in approximately 60% of patients. Using a general anosmia test, we determined that the Sirt1−/− mice are affected by anosmia (P < .05) (Supplemental Figure 4, A and B). More than 15 genes have been linked to KS, accounting for approximately 50% of cases. Most of the genes mutated in CHH encode receptor-ligand pairs and are now known to be part of the FGF8 synexpression group (3). The KAL1 (Kallmann syndrome 1) gene responsible for KS is inherited as an X-linked disorder (46). KAL1, the first gene discovered to be mutated in KS, encodes anosmin-1, which enhances FGF signaling. Mutations in HS6ST1 (heparin sulfate 6-O-sulfotransferase 1) occur in KS, and the activity of this enzyme is required for anosmin-1 function (47). Mutations in FGFR1 (fibroblast growth factor receptor 1), FGF8 (fibroblast growth factor 8), PROKR2 (prokineticin receptor 2), PROK2 (prokineticin 2), TACR3 (tachykinin receptor 3), TAC3 (tachykinin 3), KISS1R [kisspeptin (KISS) receptor], and KISS1 (Kiss1 metastasis suppressor) are associated with KS. Mutations in KISS1, KISSIR (GPRS4), TAC3, TACR3, GNRHR, and GNRHR1 cause normosmic isolated gonadotropin deficiency. A growing body of evidence suggests that the phenotype causing proteins known to be involved in GnRH deficiency, impact FGF8/FGFR1 function (3). In the current studies, FGF8/FGFR1 determined cortactin/Sirt1 colocalization, suggesting that Sirt1-cortactin may serve as the distal transducer of signaling to neuronal migration for an array of genes involved in normal human GnRH neuronal migration defects.
Figure 6.
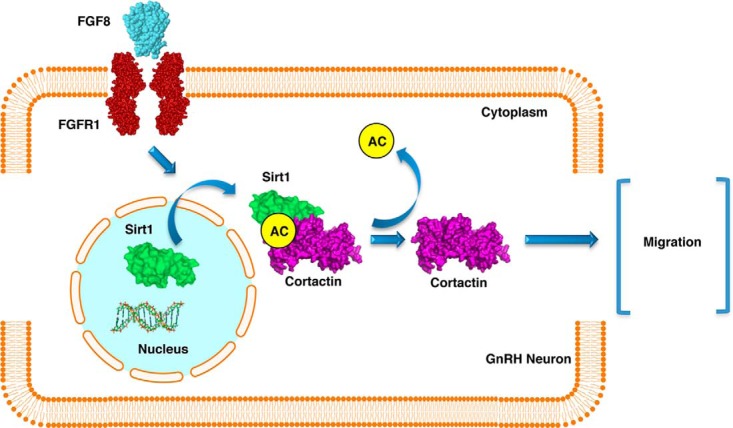
Schematic representation of FGF8/FGFR1 regulation of neuronal cell migration through Sirt1-cortactin. The interaction between FGFR1 and its ligand FGF8 promotes Sirt1 translocation into the cytoplasmic compartment. After its translocation into the cytoplasm by the activation of the FGF8/FGFR1 signaling pathway, Sirt1 directly deacetylates and activates cortactin, which promotes GnRH neuron migration.
The current studies are consistent with observations suggesting an important role for Sirt1 in neuronal processes. Previous studies have demonstrated that Sirt1 plays an important role in synaptic plasticity and normal cognitive function (48). Dendritic arborization of cultured hippocampal neurons is also Sirt1 dependent (12, 49). Cortactin interacts with F-actin to promote polarization and thereby cellular branching. Deacetylation of steroidogenic factor 1 by Sirt1 protects neurons against metabolic imbalance (34). Sirt1 affects neuronal survival and death, in part through regulation of androgen receptor deacetylation (21), suggesting multiple Sirt1 targets may contribute to neuronal survival including the androgen receptor, the Huntington protein, and Forkhead box O3A (50). The current studies extend these findings by demonstrating a key role for Sirt1-mediated deacetylation of cortactin in promoting neuronal migration and normal brain development.
Acknowledgments
Author contributions include the following: R.G.P. developed the idea. M.C.C. and C.W. developed the experimental design. R.G.P. and G.D. wrote the manuscript. L.W. performed the GnRH injection of the mice for T, FSH, and LH blood level detection. G.D. generated the three-dimensional brain structures and performed the GnRH and Sirt1 staining on the brain tissues. M.P. performed the wound-healing assay. L.W. performed the matrigel assay. L.W. performed the Western blots. K.C. performed the immunoprecipitation Western blot. X.J. performed the persistence of migratory directionality assay. Y.H. provided the Sirt1 antibody. M.W.B. generated the mice. G.D. performed the colocalization study in the GN11 cells, the acetyl-cortactin Western blot. G.D., T.G.P, I.Y., and X.S. performed the hematoxylin and eosin staining and the mRNA and protein extractions with the related PCR and Western blots. A.D. performed the apoptotic study. X.H. and G.D. performed the general anosmia study. G.D. analyzed all the presented data. G.D. managed the mouse colony.
The Department of Defense specifically disclaims responsibility for analyses, interpretations, or conclusions in this study.
This work was supported in part by Grants R01CA70896, R01CA75503, and R01CA86072 (to R.G.P.) from the National Institutes of Health and the Department of Defense Concept Award W81XWH-1101–0303. The Sidney Kimmel Cancer Center was supported by the National Institutes of Health Cancer Center Core Grant P30CA56036 (to R.G.P). This project was also supported in part from the Dr Ralph and Marian C. Falk Medical Research Trust (to R.G.P.), grants from the Pennsylvania Department of Health (to R.G.P. and C.W.), and an American-Italian Cancer Foundation Postdoctoral Research Fellowship (to G.D.).
Disclosure Summary: The authors have nothing to declare.
Footnotes
- CHH
- congenital HH
- CP
- cribriform plate
- FB
- forebrain
- FBS
- fetal bovine serum
- FGF8
- fibroblast growth factor 8
- FGFR1
- fibroblast growth factor receptor 1
- HDAC
- histone deacetylase
- HEK
- human embryonic kidney
- HH
- hypogonadotropic hypogonadism
- IP
- immunoprecipitation
- 9K
- lysine 9
- KISS
- kisspeptin
- KS
- Kallmann's syndrome
- NAD+
- nicotinamide adenine dinucleotide
- NAM
- nicotinamide
- O/N
- overnight
- PFA
- paraformaldehyde
- Sema
- semaphorin
- Sir2
- silent information regulatory protein 2
- SIRT
- sirtuin
- 3T3
- mouse embryonic fibroblasts
- TBS-T
- Tris-buffered saline with Triton X-100
- TSA
- trichostatin A
- VNO
- vomeronasal organ.
References
- 1. Constantin S. Physiology of the gonadotrophin-releasing hormone (GnRH) neurone: studies from embryonic GnRH neurones. J Neuroendocrinol. 2011;23:542–553. [DOI] [PMC free article] [PubMed] [Google Scholar]
- 2. Caronia LM, Martin C, Welt CK, et al. A genetic basis for functional hypothalamic amenorrhea. N Engl J Med. 2011;364:215–225. [DOI] [PMC free article] [PubMed] [Google Scholar]
- 3. Miraoui H, Dwyer AA, Sykiotis GP, et al. Mutations in FGF17, IL17RD, DUSP6, SPRY4, and FLRT3 are identified in individuals with congenital hypogonadotropic hypogonadism. Am J Hum Genet. 2013;92:725–743. [DOI] [PMC free article] [PubMed] [Google Scholar]
- 4. Wierman ME, Kiseljak-Vassiliades K, Tobet S. Gonadotropin-releasing hormone (GnRH) neuron migration: initiation, maintenance and cessation as critical steps to ensure normal reproductive function. Front Neuroendocrinol. 2011;32:43–52. [DOI] [PMC free article] [PubMed] [Google Scholar]
- 5. Falardeau J, Chung WC, Beenken A, et al. Decreased FGF8 signaling causes deficiency of gonadotropin-releasing hormone in humans and mice. J Clin Invest. 2008;118:2822–2831. [DOI] [PMC free article] [PubMed] [Google Scholar]
- 6. Cariboni A, Davidson K, Rakic S, et al. Defective gonadotropin-releasing hormone neuron migration in mice lacking SEMA3A signalling through NRP1 and NRP2: implications for the aetiology of hypogonadotropic hypogonadism. Hum Mol Genet. 2011;20:336–344. [DOI] [PubMed] [Google Scholar]
- 7. Cariboni A, Rakic S, Liapi A, et al. Reelin provides an inhibitory signal in the migration of gonadotropin-releasing hormone neurons. Development. 2005;132:4709–4718. [DOI] [PubMed] [Google Scholar]
- 8. Cariboni A, Andrews WD, Memi F, et al. Slit2 and Robo3 modulate the migration of GnRH-secreting neurons. Development. 2012;139:3326–3331. [DOI] [PMC free article] [PubMed] [Google Scholar]
- 9. Whittle JR, Powell MJ, Popov VM, et al. Sirtuins, nuclear hormone receptor acetylation and transcriptional regulation. Trends Endocrinol Metab. 2007;18:356–364. [DOI] [PubMed] [Google Scholar]
- 10. Kong S, McBurney MW, Fang D. Sirtuin 1 in immune regulation and autoimmunity. Immunol Cell Biol. 2012;90:6–13. [DOI] [PubMed] [Google Scholar]
- 11. McBurney MW, Yang X, Jardine K, et al. The mammalian SIR2α protein has a role in embryogenesis and gametogenesis. Mol Cell Biol. 2003;23:38–54. [DOI] [PMC free article] [PubMed] [Google Scholar]
- 12. Gao J, Wang WY, Mao YW, et al. A novel pathway regulates memory and plasticity via SIRT1 and miR-134. Nature. 2010;466:1105–1109. [DOI] [PMC free article] [PubMed] [Google Scholar]
- 13. Sakamoto J, Miura T, Shimamoto K, Horio Y. Predominant expression of Sir2α, an NAD-dependent histone deacetylase, in the embryonic mouse heart and brain. FEBS Lett. 2004;556:281–286. [DOI] [PubMed] [Google Scholar]
- 14. Seifert EL, Caron AZ, Morin K, et al. SirT1 catalytic activity is required for male fertility and metabolic homeostasis in mice. FASEB J. 2012;26:555–566. [DOI] [PubMed] [Google Scholar]
- 15. Lemieux ME, Yang X, Jardine K, et al. The Sirt1 deacetylase modulates the insulin-like growth factor signaling pathway in mammals. Mech Ageing Dev. 2005;126:1097–1105. [DOI] [PubMed] [Google Scholar]
- 16. Kolthur-Seetharam U, Teerds K, de Rooij DG, et al. The histone deacetylase SIRT1 controls male fertility in mice through regulation of hypothalamic-pituitary gonadotropin signaling. Biol Reprod. 2009;80:384–391. [DOI] [PubMed] [Google Scholar]
- 17. Akieda-Asai S, Zaima N, Ikegami K, et al. SIRT1 regulates thyroid-stimulating hormone release by enhancing PIP5Kγ activity through deacetylation of specific lysine residues in mammals. PLoS One. 2010;5:e11755. [DOI] [PMC free article] [PubMed] [Google Scholar]
- 18. Bouras T, Fu M, Sauve AA, et al. SIRT1 deacetylation and repression of p300 involves lysine residues 1020/1024 within the cell cycle regulatory domain 1. J Biol Chem. 2005;280:10264–10276. [DOI] [PubMed] [Google Scholar]
- 19. Liu M, Ju X, Willmarth NE, et al. Nuclear factor-κB enhances ErbB2-induced mammary tumorigenesis and neoangiogenesis in vivo. Am J Pathol. 2009;174:1910–1920. [DOI] [PMC free article] [PubMed] [Google Scholar]
- 20. Wang C, Pattabiraman N, Zhou JN, et al. Cyclin D1 repression of peroxisome proliferator-activated receptor γ expression and transactivation. Mol Cell Biol. 2003;23:6159–6173. [DOI] [PMC free article] [PubMed] [Google Scholar]
- 21. Fu M, Liu M, Sauve AA, et al. Hormonal control of androgen receptor function through SIRT1. Mol Cell Biol. 2006;26:8122–8135. [DOI] [PMC free article] [PubMed] [Google Scholar]
- 22. Chandrashekar V, Bartke A, Coschigano KT, Kopchick JJ. Pituitary and testicular function in growth hormone receptor gene knockout mice. Endocrinology. 1999;140:1082–1088. [DOI] [PubMed] [Google Scholar]
- 23. Tucker KR, Godbey SJ, Thiebaud N, Fadool DA. Olfactory ability and object memory in three mouse models of varying body weight, metabolic hormones, and adiposity. Physiol Behav. 2012;107:424–432. [DOI] [PMC free article] [PubMed] [Google Scholar]
- 24. Casimiro MC, Crosariol M, Loro E, et al. ChIP sequencing of cyclin D1 reveals a transcriptional role in chromosomal instability in mice. J Clin Invest. 2012;122:833–843. [DOI] [PMC free article] [PubMed] [Google Scholar]
- 25. Jiao X, Katiyar S, Willmarth NE, et al. c-Jun induces mammary epithelial cellular invasion and breast cancer stem cell expansion. J Biol Chem. 2010;285:8218–8226. [DOI] [PMC free article] [PubMed] [Google Scholar]
- 26. Meng H, Tian L, Zhou J, et al. PACSIN 2 represses cellular migration through direct association with cyclin D1 but not its alternate splice form cyclin D1b. Cell Cycle. 2011;10:73–81. [DOI] [PMC free article] [PubMed] [Google Scholar]
- 27. Ju X, Katiyar S, Wang C, et al. Akt1 governs breast cancer progression in vivo. Proc Natl Acad Sci USA. 2007;104:7438–7443. [DOI] [PMC free article] [PubMed] [Google Scholar]
- 28. Janowski E, Jiao X, Katiyar S, et al. c-Jun is required for TGF-β-mediated cellular migration via nuclear Ca(2)(+) signaling. Int J Biochem Cell Biol. 2011;43:1104–1113. [DOI] [PubMed] [Google Scholar]
- 29. Yuan JS, Reed A, Chen F, Stewart CNJ. Statistical analysis of real-time PCR data. BMC Bioinformatics. 2006;7:85. [DOI] [PMC free article] [PubMed] [Google Scholar]
- 30. Choi RY, Engbretson GA, Solessio EC, et al. Cone degeneration following rod ablation in a reversible model of retinal. Invest Ophthalmol Vis Sci. 2011;52:364–373. [DOI] [PMC free article] [PubMed] [Google Scholar]
- 31. Hasegawa K, Yoshikawa K. Necdin regulates p53 acetylation via Sirtuin1 to modulate DNA damage response in cortical neurons. J Neurosci. 2008;28:8772–8784. [DOI] [PMC free article] [PubMed] [Google Scholar]
- 32. Michan S, Sinclair D. Sirtuins in mammals: insights into their biological function. Biochem J. 2007;404:1–13. [DOI] [PMC free article] [PubMed] [Google Scholar]
- 33. Pandithage R, Lilischkis R, Harting K, et al. The regulation of SIRT2 function by cyclin-dependent kinases affects cell motility. J Cell Biol. 2008;180:915–929. [DOI] [PMC free article] [PubMed] [Google Scholar]
- 34. Ramadori G, Fujikawa T, Anderson J, et al. SIRT1 deacetylase in SF1 neurons protects against metabolic imbalance. Cell Metab. 2011;14:301–312. [DOI] [PMC free article] [PubMed] [Google Scholar]
- 35. Zhang Y, Zhang M, Dong H, et al. Deacetylation of cortactin by SIRT1 promotes cell migration. Oncogene. 2009;28:445–460. [DOI] [PubMed] [Google Scholar]
- 36. Mellon D, Jr, Munger SD. Nontopographic projection of olfactory sensory neurons in the crayfish brain. J Comp Neurol. 1990;296:253–262. [DOI] [PubMed] [Google Scholar]
- 37. Radovick S, Wray S, Lee E, et al. Migratory arrest of gonadotropin-releasing hormone neurons in transgenic mice. Proc Natl Acad Sci USA. 1991;88:3402–3406. [DOI] [PMC free article] [PubMed] [Google Scholar]
- 38. Nakane K, Fujita Y, Terazawa R, et al. Inhibition of cortactin and SIRT1 expression attenuates migration and invasion of prostate cancer DU145 cells. Int J Urol. 2012;19:71–79. [DOI] [PubMed] [Google Scholar]
- 39. Byles V, Zhu L, Lovaas JD, et al. SIRT1 induces EMT by cooperating with EMT transcription factors and enhances prostate cancer cell migration and metastasis. Oncogene. 2012;31:4619–4629. [DOI] [PMC free article] [PubMed] [Google Scholar]
- 40. Tanno M, Sakamoto J, Miura T, Shimamoto K, Horio Y. Nucleocytoplasmic shuttling of the NAD+-dependent histone deacetylase SIRT1. J Biol Chem. 2007;282:6823–6832. [DOI] [PubMed] [Google Scholar]
- 41. Hisahara S, Chiba S, Matsumoto H, et al. Histone deacetylase SIRT1 modulates neuronal differentiation by its nuclear translocation. Proc Natl Acad Sci USA. 2008;105:15599–15604. [DOI] [PMC free article] [PubMed] [Google Scholar]
- 42. Kendall SK, Samuelson LC, Saunders TL, Wood RI, Camper SA. Targeted disruption of the pituitary glycoprotein hormone α-subunit produces hypogonadal and hypothyroid mice. Genes Dev. 1995;9:2007–2019. [DOI] [PubMed] [Google Scholar]
- 43. Bryce NS, Clark ES, Leysath JL, et al. Cortactin promotes cell motility by enhancing lamellipodial persistence. Curr Biol. 2005;15:1276–1285. [DOI] [PubMed] [Google Scholar]
- 44. Zhang X, Yuan Z, Zhang Y, et al. HDAC6 modulates cell motility by altering the acetylation level of cortactin. Mol Cell. 2007;27:197–213. [DOI] [PMC free article] [PubMed] [Google Scholar]
- 45. Catarino T, Ribeiro L, Santos SD, Carvalho AL. Regulation of synapse composition by protein acetylation: the role of acetylated cortactin. J Cell Sci. 2013;126:149–162. [DOI] [PubMed] [Google Scholar]
- 46. Oliveira LM, Seminara SB, Beranova M, et al. The importance of autosomal genes in Kallmann syndrome: genotype-phenotype correlations and neuroendocrine characteristics. J Clin Endocrinol Metab. 2001;86:1532–1538. [DOI] [PubMed] [Google Scholar]
- 47. Tornberg J, Sykiotis GP, Keefe K, et al. Heparan sulfate 6-O-sulfotransferase 1, a gene involved in extracellular sugar modifications, is mutated in patients with idiopathic hypogonadotrophic hypogonadism. Proc Natl Acad Sci USA. 2011;108:11524–11529. [DOI] [PMC free article] [PubMed] [Google Scholar]
- 48. Michan S, Li Y, Chou MM, et al. SIRT1 is essential for normal cognitive function and synaptic plasticity. J Neurosci. 2010;30:9695–9707. [DOI] [PMC free article] [PubMed] [Google Scholar]
- 49. Codocedo JF, Allard C, Godoy JA, Varela-Nallar L, Inestrosa NC. SIRT1 regulates dendritic development in hippocampal neurons. PLoS One. 2012;7:e47073. [DOI] [PMC free article] [PubMed] [Google Scholar]
- 50. Jiang M, Wang J, Fu J, Du L, Jeong H, et al. Neuroprotective role of Sirt1 in mammalian models of Huntington's disease through activation of multiple Sirt1 targets. Nat Med. 2012;18:153–158. [DOI] [PMC free article] [PubMed] [Google Scholar]