

Background: The mechanism underlying the association of triacylglycerol storage and insulin resistance is unclear.
Results: Increasing phosphatidic acid (PA) in primary hepatocytes via de novo synthesis or action of phospholipase D or diacylglycerol kinase-θ disrupts insulin signaling.
Conclusion: PA derived from different sources inhibits insulin signaling.
Significance: Increases in hepatocyte PA may mechanistically link lipid storage and insulin action.
Keywords: Glycerophospholipid, Insulin Resistance, Mammalian Target of Rapamycin (mTOR), Phospholipase D, Protein Kinase C (PKC), Diacylglycerol Kinase, Glycerol-3-phosphate Acyltransferase
Abstract
Although an elevated triacylglycerol content in non-adipose tissues is often associated with insulin resistance, the mechanistic relationship remains unclear. The data support roles for intermediates in the glycerol-3-phosphate pathway of triacylglycerol synthesis: diacylglycerol (DAG), which may cause insulin resistance in liver by activating PKCϵ, and phosphatidic acid (PA), which inhibits insulin action in hepatocytes by disrupting the assembly of mTOR and rictor. To determine whether increases in DAG and PA impair insulin signaling when produced by pathways other than that of de novo synthesis, we examined primary mouse hepatocytes after enzymatically manipulating the cellular content of DAG or PA. Overexpressing phospholipase D1 or phospholipase D2 inhibited insulin signaling and was accompanied by an elevated cellular content of total PA, without a change in total DAG. Overexpression of diacylglycerol kinase-θ inhibited insulin signaling and was accompanied by an elevated cellular content of total PA and a decreased cellular content of total DAG. Overexpressing glycerol-3-phosphate acyltransferase-1 or -4 inhibited insulin signaling and increased the cellular content of both PA and DAG. Insulin signaling impairment caused by overexpression of phospholipase D1/D2 or diacylglycerol kinase-θ was always accompanied by disassociation of mTOR/rictor and reduction of mTORC2 kinase activity. However, although the protein ratio of membrane to cytosolic PKCϵ increased, PKC activity itself was unaltered. These data suggest that PA, but not DAG, is associated with impaired insulin action in mouse hepatocytes.
Introduction
The accumulation of triacylglycerol in non-adipose tissues is highly associated with insulin resistance, but the mechanistic relationship remains unclear. Both diacylglycerol (DAG)2 and phosphatidic acid (PA) have been implicated as modulators of insulin signaling that contribute to insulin resistance, but controversy exists as to their sources, their specific roles, and their mechanism(s) of action (1). PA and DAG are produced via the pathway of de novo glycerolipid biosynthesis, and PA can also be produced by phospholipase D (PLD)-mediated phospholipid hydrolysis and by phosphorylation of DAG by DAG kinase (DGK). The latter enzyme simultaneously diminishes the DAG substrate. DAG is believed to cause insulin resistance when it activates conventional and novel PKC isoforms that inhibit insulin signaling by serine phosphorylation of insulin receptor substrate (IRS), thereby decreasing insulin-stimulated tyrosine phosphorylation (2–4).
The link between elevated DAG and hepatic insulin resistance is strong (2, 5, 6), but exceptions remain in which hepatic insulin resistance is unaffected despite elevated DAG content (7–9) or in which insulin resistance occurs without an increase in DAG (10). These discrepancies could result from sequestration in lipid droplets in which the DAG may be unable to activate PKC because it is poorly accessible (11).
We have reported that PA derived from overexpressing glycerol-3-phosphate acyltransferase (GPAT) or acylglycerol-3-phosphate acyltransferase (AGPAT) disrupts the association of mTOR and rictor and inhibits insulin signaling to Akt, thereby contributing to hepatic insulin resistance (12, 13). In contrast, PLD-mediated hydrolysis of phosphatidylcholine produces PA that is said to activate mTORC1 signaling and inhibit insulin signaling by enhancing IRS1 phosphorylation at serine sites (14, 15). PLD-derived PA also enhances the association of mTOR and rictor in kidney and breast cancer cells (16). In addition to synthesis by PLD, PA can also be generated by phosphorylation of DAG by one of ten DGK isoforms (17). DGK alters the cellular content of DAG and PA simultaneously and in opposite directions (18). Although one study showed an association between DGKδ inhibition and insulin resistance in skeletal muscle, the study examined changes in DAG, but not PA (19). Thus, it is not known whether a DGK-mediated increase in PA content leads to impaired insulin signaling.
We asked whether one or both of the lipid intermediates, PA and DAG, is involved in regulating hepatic insulin sensitivity and whether lipid intermediates that originate from different enzymatic sources exert different effects. When we overexpressed DGKθ and isoforms of PLD and GPAT in mouse primary hepatocytes, our results showed that regardless of its source, elevated PA, particularly PA that contained 16:0 fatty acid species, was associated with impaired insulin action.
EXPERIMENTAL PROCEDURES
Antibodies and Other Reagents
Primary antibodies were from Cell Signaling Technology unless otherwise noted. Secondary antibodies and SuperSignal West Pico chemiluminescent substrate were from Thermo Scientific. Anti-PKCα, PKCϵ, PKCθ, and DGKθ antibodies and protein A/G-Sepharose were from Santa Cruz Biotechnology (Santa Cruz, CA). Anti-IRS1, anti-Flag® M2, and anti-α-tubulin antibodies, bovine serum albumin (fatty acid free), insulin (human recombinant), sodium-d-lactate, phorbol 12-myristate 12-acetate (PMA), Avertin (2-2-2-tribromoethanol), phosphatase inhibitor cocktails 1 and 2, Percoll, ATP, and CHAPS were from Sigma. Anti-PLD2 antibody was made as described (20). Type I collagenase was from Worthington Biochemical Corporation. Protease inhibitor tablets were from Roche. Inactive Akt1 was from SignalChem (Richmond, Canada). Cell culture media and reagents were from Invitrogen.
Mouse Liver Perfusion, Hepatocyte Isolation, and Culture
Hepatocytes were isolated from perfused livers from 8–15-week-old C57/B6J mice (12) and cultured overnight in William's medium E supplemented with 10% FBS, 1% penicillin/streptomycin, and 4 mm glutamine. Hepatocytes were infected with adenovirus or lentivirus constructs of the different enzymes in FBS-free William's medium E supplemented with 1% penicillin/streptomycin and 4 mm glutamine for 24 h, followed by treatments for specific experiments.
cDNA Cloning, Adenovirus Production, and Hepatocyte Infection
The construction, generation, and purification of recombinant Gpat1-FLAG adenovirus and Ad-enhanced green fluorescent protein (EGFP) were described previously (21). Gpat3 cDNA was cloned from an adipocyte cDNA library, and a Flag® tag (Clontech) was added at the carboxyl terminus. Gpat4 cDNA was cloned as described (22). EGFP, Gpat1-Flag, Gpat3-Flag, and Gpat4-Flag constructs were subcloned into adenoviral vectors using the AdEasy adenoviral vector system (Stratagene). EGFP, Gpat1, Gpat3, and Gpat4 adenoviruses were packaged and titered by the UNC Gene Therapy Core Facility.
Adenoviral constructs of PLD1, PLD2, and the catalytically inactive mutants of PLD1 and PLD2 were produced as described (23). MOIs of 10–20 were used for mouse hepatocyte adenoviral infection, based on pilot experiments to obtain high efficiency of infection without toxic effects on the cells.
cDNA Cloning, Lentiviral Packaging, and Hepatocyte Infection
Lentiviral constructs for GFP and mouse DGKθ were generous gifts from Dr. Daniel M. Raben (Johns Hopkins University, Baltimore, MD). The constructs were transfected into HEK293T cells together with lentiviral packaging plasmids pCMV delta-R8.2 and PCMV-VSV-G (Addgene, Cambridge, MA). The crude lentiviruses (∼1–2 × 10⁸ transduction unit/ml) produced in DMEM containing 4.5 g/liter glucose, 30% FBS, 0.1% penicillin/streptomycin, and 4 mm glutamine were concentrated by 2 h ultracentrifugation at 25,000 × g at 4 °C. The lentivirus pellet was reconstituted in phosphate-buffered saline to obtain concentrated lentivirus with a titer of 1–2 × 10¹⁰ TU/ml. MOIs of 1 were used for mouse hepatocyte lentiviral infection, based on pilot experiments to obtain high efficiency of infection without toxic effects on the cells.
Lipid Extraction and PA and DAG Assays
The total cell lipid was extracted (24), and PA and DAG were analyzed by LC/MS on a Shimadzu Prominence ultra fast liquid chromatography system with a C8 column and detected with an applied Biosystems 4000Q Trap triple quadripole LC/MS/MS system equipped with an electrospray ionization system as described (12, 25). The amount of each glycerolipid species in the biological samples was calculated from the peak areas obtained using the software that controls the LC/MS system (Analyst 1.5; Applied Biosystems). Raw peak areas were corrected for recovery and sample loading and then transformed into amounts of analyte using standard curves made with commercially obtained glycerolipids. To correct for recovery, 0.1 nmol of 17:0 lysophosphatidic acid was added as an internal standard and normalized to the protein concentrations of the cellular lysates.
GPAT Activity
Mouse hepatocytes were homogenized in buffer (10 mm Tris-HCL, pH 7.4, 250 mm sucrose, 1 mm DTT, 1.0 mm EDTA). Total membrane fractions were isolated by centrifuging at 100,000 × g for 1 h. Protein concentrations were determined by the bicinchoninic acid method using bovine serum albumin as the standard. GPAT specific activity was assayed for 10 min at 25 °C with 800 μm [3H]glycerol-3-phosphate and 100 μm palmitoyl-CoA. The reaction was initiated by adding 10–30 μg of total membrane protein to the assay mixture after incubating the membrane protein on ice for 15 min in the presence or absence of 1 mm NEM, which inhibits GPAT2, GPAT3, and GPAT4 (26). Microsomal activity (primarily GPAT3 and GPAT4) (22) was calculated as the activity inactivated by NEM.
PLD Activity
PLD activity was measured as previously described with [3H]phosphatidylbutanol produced in [3H]palmitate-labeled hepatocytes through PLD-catalyzed transphosphatidylation (27). Briefly, 24 h after adenoviral infections, hepatocytes were labeled for 24 h with [3H]palmitate in the absence of serum. The labeling medium was then replaced with fresh medium containing 0.3% 1-butanol with or without 100 nm PMA, and 30 min later total cellular lipids were extracted and separated on Whatman LK5D silica gel thin layer chromatography plates (with an authentic phosphatidylbutanol positive control) (27, 28) in a developing solvent system of ethyl acetate: 2,2,4-trimethylpentane:acetic acid:water (110:50:20:100, v/v/v/v). The plate was dried and exposed to iodine. The iodine-stained phosphatidylbutanol spot was marked and scraped, as was the remainder of the lane. Relative PLD activity was expressed as the ratio of the scintillation counts in the phosphatidylbutanol spot to those of the entire lane (27).
DGK Activity
Hepatocytes were lysed on ice with a cold lysis buffer (40 mm Hepes, pH 7.5, 120 mm NaCl, 1 mm EDTA, 10 mm pyrophosphate, 10 mm glycerophosphate, 50 mm NaF, 0.5 mm Na3VO4, EDTA-free protease inhibitors, 1% phosphatase inhibitor mixtures 2 and 3, 0.3% CHAPS). Cell lysates were centrifuged at 13,000 × g for 10 min, and supernatants were transferred to new tubes. DGK reactions (29, 30) were started by adding 10 μl of the cell lysates (10–30 μg of protein) to 90 μl of a reaction mixture that contained 8 mol% DAG, 16 mol% phosphatidylserine, 55 mm octylglucoside mixed micelles, 100 μm diethylenetriamine pentaacetic acid, 50 mm imidazole HCl, 50 mm NaCl, 1.5 mm MgCl2, 1 mm EGTA, 1 mm DTT, and 1 mm (2 μCi) [γ-32P]ATP). The reaction was terminated by adding 1 ml of 1% perchloric acid and 1 ml of chloroform. After vortexing and washing twice with 2 ml of 1% perchloric acid, an aliquot of the lower phase (organic) was removed for scintillation counting.
PKC Activity
Hepatocytes were washed with cold buffer I (20 mm Tris-HCl, pH 7.5, 2.0 mm EDTA, 0.5 mm EGTA, 1 mm phenylmethylsulfonyl fluoride, 1 mm dithiothreitol, and 0.33 m sucrose), scraped from the dish, centrifuged, and resuspended in cold buffer I containing 25 μg/ml leupeptin and 0.1 mg/ml aprotinin. The cells were homogenized with 20 up and down strokes at 4 °C in a motorized Teflon-glass homogenizer. The soluble fraction, obtained after centrifuging at 100,000 × g for 60 min, was defined as the cytosolic extract. The pellets were washed with cold buffer I, resuspended in cold buffer II (buffer I without sucrose) containing 1% Triton X-100, and homogenized with 10 up and down strokes at 4 °C. This fraction was defined as the membrane fraction. PKC activity was assayed with a protein kinase C assay system (Promega) according to the manufacturer's instructions. PKC activity was measured as the calcium-, phosphatidylserine-, and DAG-stimulated transfer of 32P from [γ-32P]ATP to the substrate peptide (AAKIQAS*FRGHMARKK; the asterisk indicates that the preceding serine is the site that is phosphorylated by PKC) and expressed as pmol [32P]/min/mg protein.
Immunoprecipitation and Kinase Activity Assay
Immunoprecipitation of rictor and the mTORC2 kinase assay were performed as described (31). Western blots were probed with phosphor-Akt (Ser-473) to assess mTORC2 activity.
Western Blot Analysis
Hepatocytes were harvested in lysis buffer (20 mm Tris-HCl, pH 7.5, 0.1 mm Na3VO4, 25 mm NaF, 25 mm glycerophosphate, 2 mm EGTA, 1 mm dithiothreitol, 0.5 mm phenylmethylsulfonyl fluoride, and 0.3% Triton X-100). The lysates were mixed 1:1 with 2× Laemmli sample buffer and boiled before loading onto SDS-PAGE. Western blotting was carried out according to procedures recommended by suppliers of the antibodies. Horseradish peroxidase-conjugated secondary antibodies were detected with SuperSignal West Pico chemiluminescent substrate and exposure to x-ray film. The film was converted to digital images by an Epson scanner (Perfection 2400), and the images were cropped using Photoshop CS2.
Statistical Analysis
The values are expressed as means ± S.E. Comparisons were determined using Student's t test (EGFP or GFP set as control). The data represent at least three independent experiments, each performed in triplicate. p < 0.05 was considered significant.
RESULTS
Overexpressed PLD1 or PLD2 Impaired Insulin Signaling to Akt in Mouse Hepatocytes
The PLD-mediated hydrolysis of phosphatidylcholine to produce PA has taken center stage in mTOR signaling (32, 33). PA derived via PLD stimulates mTORC1/S6K1 signaling and increases the phosphorylation of IRS-1 on serines 307, 632, and 636/639, residues that inhibit insulin signaling to Akt (34, 35). In contrast to the inhibition of insulin signaling by mTORC1, insulin signaling is enhanced by mTORC2, which phosphorylates and activates Akt at serine 473 (31). Because the PA derived via PLD in human kidney and mammary carcinoma cells stabilizes both mTORC1 and mTORC2 complexes (16), PA could produce paradoxical outcomes of both enhanced and inhibited insulin signaling.
To investigate the role of PLD in hepatic insulin signaling, we overexpressed PLD1 and PLD2 in primary mouse hepatocytes. Although the antibody for PLD1 also recognizes PLD2, overexpression was confirmed by Western blotting (Fig. 1A) by 2-fold (PLD1) and 25-fold (PLD2) increases in basal activity relative to EGFP; and by 10-fold (PLD1) and 32-fold (PLD2) increases in PMA-stimulated PLD activity, respectively (Fig. 1B). Overexpressing catalytically inactive PLD1 and PLD2 constructs did not increase PLD activity (Fig. 1B). Overexpressing PLD1 and PLD2 in mouse hepatocytes completely blocked insulin signaling, as represented by absent insulin-stimulated Akt phosphorylation at serine 473 and threonine 308. Specificity for these results was confirmed by the absence of inhibition when the inactive mutants of PLD1 and PLD2 were used (Fig. 1C). Thus, PLD-derived signals disrupted insulin signaling in hepatocytes. Overexpression of PLD1, PLD2, or the inactive PLD constructs did not alter basal or insulin-stimulated phosphorylation of IRS1 (Ser-612), consistent with an effect that occurred downstream of the insulin receptor (Fig. 1, D and E).
FIGURE 1.

Overexpressing PLD1 and PLD2 impaired insulin signaling to Akt. Mouse primary hepatocytes were infected for 24 h with EGFP, Flag-GPAT1, PLD1, inactive PLD1 mutant (PLD1-m), PLD2, or inactive PLD2 mutant (PLD2-m) adenoviruses. Cells were lysed and subjected to Western blotting with appropriate antibodies (A), scraped from the dish, centrifuged to obtain total particulate preparations and assayed for PLD activity (B), or treated with or without insulin (100 nm) for 10 min, followed by cell lysate preparation for Western blotting (C and D). A, C, and D show representative Western blots from three independent experiments; B shows results from three independent experiments, each done in triplicate. E shows the quantitative analysis of data from D. * and #, p < 0.05 compared with EGFP basal and PMA-stimulated, respectively.
Overexpressing PLD1 and PLD2 Increased the Cellular Content of Total PA and di16:0 PA, but Did Not Change Total DAG or di16:0 DAG Content
Our previous study showed that overexpression of GPAT1 in primary mouse hepatocytes diminished insulin signaling, blocked phosphorylation of Akt at the mTORC2 site serine 473, and markedly increased PA species, particularly di16:0 PA. Furthermore, of several molecular species of PA and LPA tested, only diC16:0 PA disrupted the association of mTOR and rictor (12). To determine which lipids produced by PLD1 and PLD2 were associated with disrupted insulin signaling in mouse hepatocytes, we examined the cellular content of PA and DAG species. Compared with cells expressing EGFP, overexpressed PLD1 increased total PA, 16:0-containing PA, and the remaining PA species 7.9-, 10-, and 5.8-fold, respectively, and increased di16:0 PA 4.4-fold (Fig. 2, A and B, and Table 1). Overexpressed PLD2 increased total PA, 16:0-containing PA, and the remaining PA species 1.7-, 1.9-, and 1.5-fold, respectively, and increased di16:0 PA 3.2-fold (Fig. 2, A and B, and Table 1). Overexpressed PLD1 or PLD2 did not alter the total DAG content or the content of any DAG species (Fig. 2, C and D, and Table 2). These results indicate that PA, but not DAG, was associated with impaired insulin signaling. The eight PA species identified were increased 2.6–13-fold by PLD1 overexpression; however, PLD2 overexpression increased di16:0 PA to the greatest extent (3.2-fold) (Fig. 2, A and B, and Table 1). Because the block in Akt phosphorylation was similar with overexpression of either PLD1 or PLD2 (Fig. 1C), these results suggest that di16:0 PA is most strongly associated with impaired insulin signaling.
FIGURE 2.
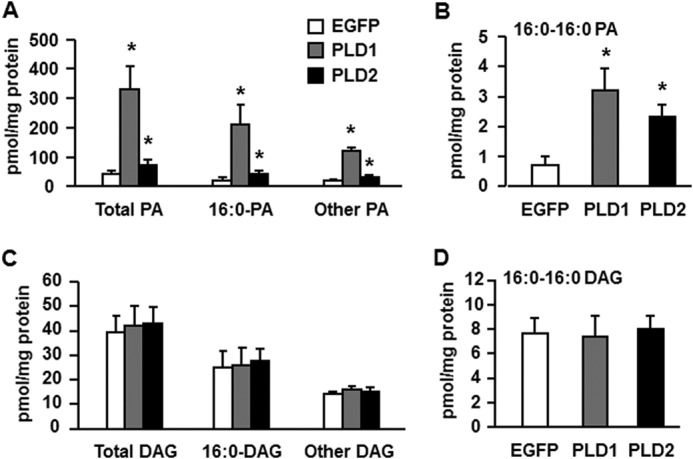
Overexpressing PLD1 and PLD2 increased the cellular content of total PA and di16:0 PA but did not change total or di16:0 DAG. Lipids were extracted from mouse primary hepatocytes overexpressing EGFP, PLD1, or PLD2. A, content of total PA, 16:0-containing PA, and other PA. B, content of di16:0 PA. C, content of total DAG, 16:0-containing DAG, and other DAG. D, content of di16:0 DAG. *, p < 0.05 compared with EGFP. The data are from three independent experiments, each done in triplicate.
TABLE 1.
Content of PA species in mouse primary hepatocytes overexpressing EGFP, GPAT3, GPAT4, PLD1, PLD2, GFP, or DGKθ
Mouse primary hepatocytes were infected for 24 h with 1) EGFP, Flag-GPAT3, or Flag-GPAT4 adenoviruses, or with 2) EGFP, HA-PLD1, or HA-PLD2 adenoviruses, or with 3) GFP or DGKθ lentiviruses. Lipids were extracted and PA content was analyzed as described under “Experimental Procedures.” Comparisons were determined using Student's t test.
| PA species | EGFP1 | GPAT31 | GPAT41 | EGFP2 | PLD12 | PLD22 | GFP3 | DGKθ3 |
|---|---|---|---|---|---|---|---|---|
| pmol/mg protein | pmol/mg protein | pmol/mg protein | pmol/mg protein | pmol/mg protein | pmol/mg protein | pmol/mg protein | pmol/mg protein | |
| 16:0–16:0 | 0.56 ± 0.26 | 1.0 ± 0.49 | 3.17 ± 1.58a | 0.73 ± 0.29 | 3.21 ± 0.76a | 2.32 ± 0.41a | 0.9 ± 0.33 | 8.45 ± 2.15a |
| 16:0–18:0 | 0.77 ± 0.33 | 2.42 ± 0.23a | 2.86 ± 1.12a | 0.54 ± 0.21 | 2.54 ± 0.83a | 0.8 ± 0.23 | 1.15 ± 0.41 | 2.49 ± 0.33a |
| 16:0–18:1 | 11.62 ± 2.25 | 12.62 ± 3.46 | 37.9 ± 12.16a | 14.06 ± 7.81 | 170.9 ± 56.8a | 30.06 ± 10.2a | 15.31 ± 6.1 | 22.7 ± 4.06 |
| 16:0–18:2 | 7.67 ± 1.83 | 8.35 ± 3.25 | 30.17 ± 9.55a | 5.91 ± 1.05 | 34.12 ± 10.4a | 8.23 ± 1.67 | 7.22 ± 0.47 | 22.18 ± 5.16a |
| 18:0–18:1 | 4.39 ± 0.95 | 12.34 ± 2.96a | 19.94 ± 9.82a | 4.12 ± 0.89 | 10.86 ± 1.51a | 2.69 ± 0.45 | 5.79 ± 0.98 | 7.17 ± 0.86 |
| 18:0–18:2 | 1.86 ± 0.33 | 3.81 ± 0.44a | 4.56 ± 1.38a | 1.94 ± 0.64 | 25.43 ± 6.1a | 4.75 ± 1.37a | 1.53 ± 0.18 | 0.24 ± 0.11 |
| 18:1–18:1 | 13.3 ± 3.68 | 57.02 ± 6.91a | 68.96 ± 16.9a | 13.27 ± 0.88 | 72.7 ± 9.25a | 21.62 ± 4.4a | 12.08 ± 3.71 | 36.82 ± 1.54a |
| 18:1–18:2 | 1.2 ± 0.26 | 4.23 ± 0.48a | 8.13 ± 2.42a | 1.59 ± 0.68 | 11.53 ± 1.98a | 2.52 ± 0.3 | 1.35 ± 0.23 | 3.53 ± 0.76a |
| Total | 41.37 ± 8.99 | 101.8 ± 16.38a | 175.69 ± 53.8a | 42.16 ± 10.5 | 331.3 ± 78.3a | 72.99 ± 18a | 45.33 ± 5.99 | 103.58 ± 6.29a |
a p < 0.05 compared to EGFP, EGFP, or GFP as grouped by superscripts 1, 2, or 3. Data are from three independent experiments, each done in triplicate.
TABLE 2.
Content of DAG species in mouse primary hepatocytes overexpressing EGFP, GPAT3, GPAT4, PLD1, PLD2, GFP, or DGKθ
Mouse primary hepatocytes were infected for 24 h with 1) EGFP, Flag-GPAT3, or Flag-GPAT4 adenoviruses, or with 2) EGFP, HA-PLD1, or HA-PLD2 adenoviruses, or with 3) GFP or DGKθ lentiviruses. Lipids were extracted and DAG content was analyzed as described under “Experimental Procedures.” Comparisons were determined using Student's t test.
| DAG species | EGFP1 | GPAT31 | GPAT41 | EGFP2 | PLD12 | PLD22 | GFP3 | DGKθ3 |
|---|---|---|---|---|---|---|---|---|
| pmol/mg protein | pmol/mg protein | pmol/mg protein | pmol/mg protein | pmol/mg protein | pmol/mg protein | pmol/mg protein | pmol/mg protein | |
| 16:0–16:0 | 7.44 ± 1.69 | 7.21 ± 0.72 | 10.81 ± 1.83a | 7.62 ± 1.29 | 7.35 ± 1.75 | 8.07 ± 1.01 | 10.0 ± 0.93 | 0.46 ± 0.08a |
| 16:0–18:0 | ||||||||
| 16:0–18:1 | 12.37 ± 2.42 | 16.14 ± 2.21a | 46.13 ± 10.3a | 14.19 ± 5.04 | 15.88 ± 5.36 | 16.39 ± 4.07 | 12.2 ± 0.45 | 1.23 ± 0.2a |
| 16:0–18:2 | 3.25 ± 0.72 | 3.09 ± 0.49 | 7.58 ± 1.44a | 3.29 ± 0.46 | 2.76 ± 0.32 | 3.15 ± 0.15 | 4.43 ± 0.58 | 0.81 ± 0.09a |
| 18:0–18:1 | ||||||||
| 18:0–18:2 | ||||||||
| 18:1–18:1 | 12.81 ± 2.3 | 16.62 ± 1.85a | 15.24 ± 6.24 | 10.47 ± 0.92 | 11.55 ± 0.4 | 10.73 ± 1.09 | 8.52 ± 0.69 | 6.9 ± 1.02a |
| 18:1–18:2 | 2.21 ± 0.54 | 2.0 ± 0.35 | 2.23 ± 0.86 | 2.44 ± 0.41 | 2.8 ± 0.63 | 2.83 ± 0.59 | 3.3 ± 0.72 | 1.7 ± 0.54a |
| 18:2–18:2 | 1.56 ± 0.3 | 1.41 ± 0.24 | 1.19 ± 0.49a | 1.37 ± 0.16 | 1.58 ± 0.24 | 1.64 ± 0.15 | ||
| Total | 39.64 ± 7.84 | 46.47 ± 5.15 | 83.18 ± 19.4a | 39.38 ± 6.65 | 41.92 ± 8.29 | 42.81 ± 6.95 | 38.45 ± 2.93 | 11.1 ± 1.18a |
a p < 0.05 compared to EGFP, EGFP, or GFP as grouped by superscripts 1, 2, or 3. Data are from three independent experiments, each done in triplicate.
Overexpressed DGKθ Impaired Insulin Signaling to Akt
Because PLD overexpression resulted in impaired insulin signaling, we asked whether PA produced by DGK-mediated phosphorylation of DAG would similarly inhibit insulin signaling. The DGK reaction is of particular interest because it reciprocally modulates the relative concentrations of DAG and PA, two lipids involved in signal transduction. Although DGKθ is expressed in liver (36, 37), little is known about its physiological function related to insulin signaling. Overexpression of the DGKθ protein was confirmed by Western blotting (Fig. 3A) and by a 4-fold increase in DGK activity (Fig. 3B). Overexpressed DGKθ almost completely blocked insulin signaling, as shown by the absence of insulin-stimulated Akt phosphorylation at serine 473 and threonine 308 (Fig. 3C). Overexpressing DGKθ did not alter the phosphorylation of IRS1 (Ser-612) (Fig. 3, D and E), suggesting that the lipid signal derived from DGKθ had disrupted the insulin signaling pathway downstream of IR/IRS1.
FIGURE 3.
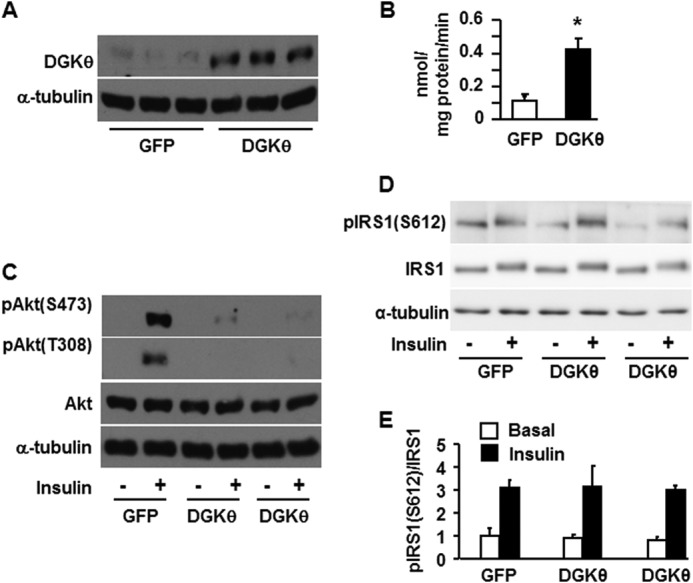
Overexpressing DGKθ impaired insulin signaling to Akt in mouse hepatocytes. Mouse primary hepatocytes were infected for 24 h with GFP or DGKθ lentiviruses. Cells were lysed and subjected to Western blotting with appropriate antibodies (A), lysed and assayed for DGK activity (B), or treated with or without insulin (100 nm) for 10 min, followed by cell lysate preparation for Western blotting (C and D). A, C, and D show representative Western blots from three independent experiments; B shows results from three independent experiments, each done in triplicate. E shows the quantitative analysis of data from D. *, p < 0.05 compared with GFP.
Overexpressing DGKθ Increased the Cellular Content of Total PA and di16:0 PA, and Decreased Total DAG and di16:0 DAG
To learn which lipid signals produced by DGKθ were associated with impaired hepatic insulin signaling, we overexpressed DGKθ in mouse hepatocytes and examined the cellular content of PA and DAG. Compared with the GFP control, overexpressing DGKθ increased total PA, 16:0-containing PA species, and the remaining PA species by 2.3-fold and increased di16:0 PA 9.4-fold (Fig. 4, A and B, and Table 1). Overexpressing DGKθ decreased total DAG, 16:0-containing DAG, and other DAG species by 71, 91, and 27%, respectively, and decreased di16:0 DAG by 95% (Fig. 4, C and D, and Table 2). These results show a strong association between diminished insulin signaling and the hepatocyte content of PA, especially di16:0 PA, but not with DAG content or species.
FIGURE 4.
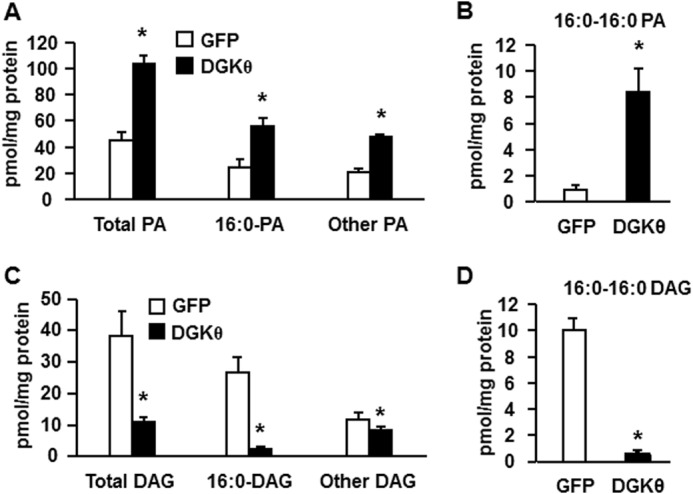
Overexpressing DGKθ increased the cellular content of total PA and di16:0 PA and decreased total DAG and di16:0 DAG. Lipids were extracted from mouse primary hepatocytes overexpressing GFP or DGKθ, and lipid content was assayed. A, content of total PA, 16:0-containing PA, and other PA. B, content of di16:0 PA. C, content of total DAG, 16:0-containing DAG, and other DAG. D, content of di16:0 DAG. The data are from three independent experiments, each done in triplicate. *, p < 0.05 compared with GFP.
Overexpressing Gpat1 or Gpat4, but Not Gpat3, Impaired Insulin Signaling to Akt
In addition to PLD and DGK, increasing flux through the glycerolipid biosynthetic pathway can increase cellular PA content. Overexpressing GPAT1 in rat liver increases hepatic triacylglycerol content and induces hepatic insulin resistance (36), and overexpressing GPAT1 in cultured mouse hepatocytes diminishes insulin-mediated suppression of glucose production by disrupting the association between mTOR and rictor (12). Of the four GPAT isoforms found in mammals, GPAT1 and GPAT2 are located on the outer membrane of mitochondria, and GPAT3 and GPAT4 reside on the endoplasmic reticulum (26) and on lipid droplets (37). GPAT1 has a strong substrate preference for 16:0-CoA, and GPAT4 shows a mild preference for acyl-CoAs that contain 16 and 18 carbons, but GPAT2 and GPAT3 exhibit no acyl-CoA specificity (22, 38). To investigate the roles of different GPAT isoforms in regulating insulin sensitivity, we overexpressed GPAT1, GPAT3, and GPAT4 in mouse primary hepatocytes by infecting the cells with adenovirus-GPAT isoforms that each contained a carboxyl-terminal Flag tag. Overexpression was confirmed by Western blotting (Fig. 5A) and by 5-fold (GPAT1), 4-fold (GPAT3), and 5.5-fold (GPAT4) increases in total GPAT activity (Fig. 5B), consistent with our previous studies (13). Overexpressing either GPAT3 or GPAT4 increased NEM-sensitive GPAT activity, whereas overexpressing GPAT1 increased NEM-resistant GPAT activity (Fig. 5B), consistent with the fact that GPAT1 is NEM-resistant and GPAT3 and GPAT4 are NEM-sensitive (26). Overexpressing GPAT1 or GPAT4 completely blocked insulin signaling to Akt as shown by absent Akt phosphorylation at serine 473 and threonine 308, the sites that are essential for full Akt activation. In contrast, overexpressing GPAT3 did not result in diminished Akt phosphorylation (Fig. 5C). These results replicate our previous report (13) and suggest (a) that signals from the GPAT-initiated pathway of lipid synthesis impair insulin signaling and (b) that the location of the GPAT isoform does not determine its effect on insulin sensitivity.
FIGURE 5.
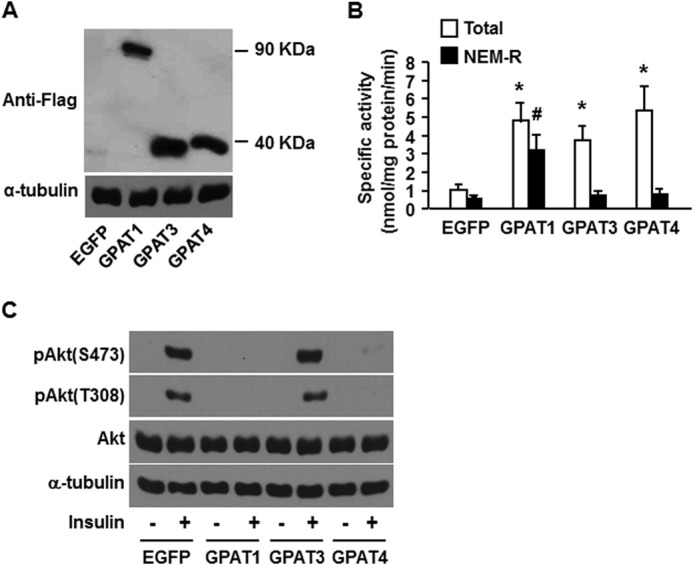
Overexpressed GPAT1 and GPAT4 in mouse hepatocytes, but not GPAT3, impaired insulin signaling to Akt. Mouse primary hepatocytes were infected for 24 h with EGFP, Flag-GPAT1, Flag-GPAT3, or Flag-GPAT4 adenoviruses. Cells were lysed and subjected to Western blotting with anti-Flag antibodies (A); scraped from the dish, centrifuged to obtain total particulate preparations, and assayed for total and NEM-resistant (NEM-R) GPAT activity (B); or treated with or without insulin (100 nm) for 10 min, followed by cell lysate preparation for Western blotting (C). A and C show representative Western blots from three independent experiments; B shows data from three independent experiments, each done in triplicate. * and #, p < 0.05 compared with EGFP total and NEM-resistant GPAT activity, respectively.
Overexpressing GPAT4, but Not GPAT3, Increased the Cellular Content of Total PA and DAG, and di16:0 PA, but Not di16:0 DAG
In mouse hepatocytes that overexpressed GPAT1, inhibition of insulin signaling correlates with increases in the cellular content of both DAG and PA, particularly 16:0-containing PA and di16:0 PA (12). To learn whether this correlation exists for other GPAT isoforms, we examined the cellular content of PA and DAG in mouse hepatocytes that overexpressed GPAT3 or GPAT4. GPAT4 overexpression increased the content of total PA 4-fold, and di16:0-PA species 3.6-fold, and non-16:0-PA species 4.9-fold (Fig. 6A and Table 1), consistent with a previous study (13). In contrast, GPAT3 overexpression increased the content of total PA ∼2.5-fold, but this increase was in non-16:0-PA species (Fig. 6, A and B, and Table 1). GPAT4 overexpression also increased the total DAG content and the content of DAG species containing 16:0, but GPAT3 overexpression did not alter the content of DAG (Fig. 6, C and D, and Table 2). Thus, the cellular content of both PA and DAG, especially the di16:0 PA and DAG species, correlated with diminished insulin signaling.
FIGURE 6.
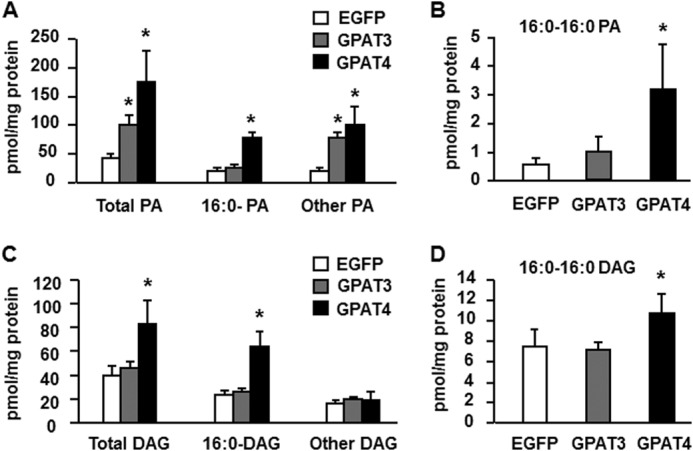
Overexpressing GPAT4, but not GPAT3, increased the cellular content of total PA, DAG, and di16:0 PA. Lipids were extracted from mouse primary hepatocytes overexpressing EGFP, Flag-GPAT3, or Flag-GPAT4, and lipid content was assayed. A, content of total PA, 16:0-containing PA, and other PA. B, content of di16:0 PA. C, content of total DAG, 16:0-containing DAG, and other DAG. D, content of di16:0 DAG. The data are from three independent experiments, each done in triplicate. *, p < 0.05 compared with EGFP.
Overexpression of PLD1 or 2 or DGKθ Diminished the mTOR-Rictor Association and Inhibited mTORC2 Activity
To test the mechanism by which overexpressing PLD1/2 and DGKθ blocked insulin signaling, we immunoprecipitated rictor and assayed mTORC2 kinase using inactive Akt as the substrate. The expression of all three enzymes, PLD1, PLD2 and DGKθ, disrupted the mTOR-rictor association (Fig. 7, A and B) and inhibited mTORC2 activity (Fig. 7, A and C), indicating that similar to the overexpression of GPAT1 or GPAT4 in mouse hepatocytes (12, 13), the overexpression of PLD1, PLD2, or DGKθ blocked insulin signaling by disrupting the mTOR-rictor association and inhibiting mTORC2 activity.
FIGURE 7.
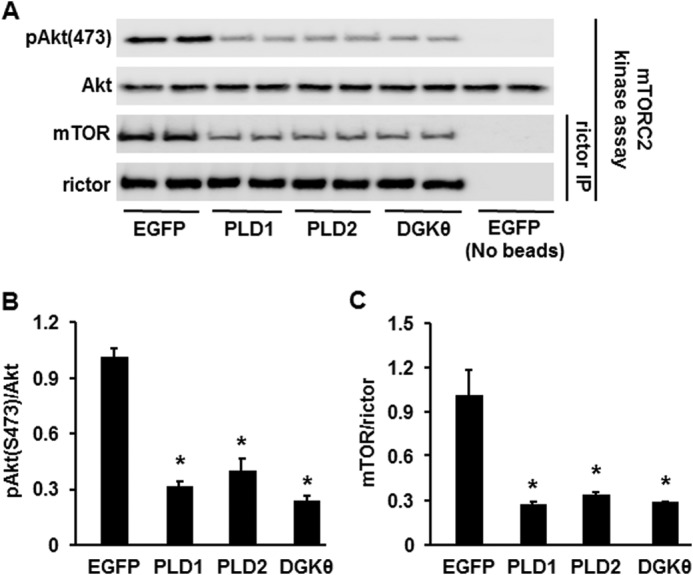
Overexpressing PLD1, PLD2, or DGKθ diminished mTOR-rictor association and inhibited mTORC2 activity. Mouse primary hepatocytes overexpressing EGFP, PLD1, PLD2, or DGKθ were lysed and immunoprecipitated (IP) and then assayed for mTORC2 kinase activity followed by Western blotting. A, Western blots representative of three independent experiments. B and C, quantitative analysis of data from A. *, p < 0.05 compared with EGFP.
Overexpression of GPAT1 and GPAT4 Increased the Protein Ratio of Membrane to Cytosolic PKCϵ but Did Not Alter PKC Activity
DAG is believed to inhibit insulin signaling in liver by recruiting and activating PKCϵ at the membrane (5). However, as with a previous report that focused on GPAT1 (12), expressing the GPAT4 isoform was not helpful in distinguishing between the roles of PA and DAG as regulators of insulin signaling. Therefore, to determine whether the increased DAG content present in GPAT4 overexpressing cells had interfered with insulin signaling, we asked whether the location and activity of PKCϵ had changed. The locations of PKCα and PKCθ did not change, but as previously reported for overexpression of GPAT1 in rat liver (36), overexpressing either GPAT1 or GPAT4 increased the ratio of membrane to cytosolic PKCϵ protein (Fig. 8A), a ratio that is often accepted as a proxy for PKC activation. However, similar to a previous report (39), this change resulted from a reduction in the cytosolic content of PKCϵ, although the membrane PKCϵ content did not change (Fig. 8B). More importantly, PKC activity itself did not increase, in contrast to the 2.5-fold increase in activity produced by the PMA control (Fig. 8C). The decrease in cytosolic DAG may have resulted from sequestration of DAG in lipid droplets where it would not be accessible to membrane-associated PKCϵ (11). These data suggest that when GPAT is overexpressed in cultured mouse hepatocytes to induce increased glycerolipid synthesis, PA molecules that contain 16:0 acyl groups are the lipid intermediates most likely to inhibit the insulin signaling pathway.
FIGURE 8.

Overexpressing GPAT1 or GPAT4 increased the protein ratio of membrane to cytosolic PKCϵ but did not alter PKC activity. Membrane and cytosolic preparations from mouse primary hepatocytes overexpressing EGFP, Flag-GPAT1, Flag-GPAT3, or Flag-GPAT4 were subjected to Western blotting (A) and protein quantification (B) or assayed for PKC activity (C). A and B show representative Western blots and protein quantifications from three independent experiments; C shows data from three independent experiments, each done in triplicate. *, p < 0.05 compared with EGFP.
DISCUSSION
In the current study, we manipulated the cellular content of PA and DAG by overexpressing key enzymes that catalyze the production of these two lipid intermediates and demonstrated that the cellular content of PA, but not DAG, correlates closely with the inhibition of insulin signaling in mouse hepatocytes. Lipin, which synthesizes DAG from PA, was not included in this study because we previously reported that overexpressing Lipin2 does not inhibit insulin signaling in mouse hepatocytes; the overexpression of Lipin2 results in only a 1.24-fold increase in total PA with no change in di16:0 PA or total DAG (12).
PLD-derived PA appears to promote mTOR-raptor assembly, thereby activating mTORC1, which inhibits insulin signaling by enhancing IRS1 phosphorylation at serine sites (14, 16). We have reported that GPAT1-derived PA disrupts the assembly of mTOR and rictor, thereby diminishing phosphorylation of phospho-Akt (Ser-473) and inhibiting insulin signaling (12). Others, however, have shown that PLD-derived PA promotes the assembly of both mTOR-raptor and mTOR-rictor (16, 33). How can chemically identical molecules have opposite functions? It was proposed that because different PA-producing enzymes are located on or within specific subcellular organelles, the PA molecules produced by these enzymes might function differently because of their cellular compartmentalization (1, 26, 41). PA derived from GPAT (via AGPAT) is produced at the outer mitochondrial membrane, at the lipid droplet, or at the ER surface (26, 42, 43); the PA produced by PLD1 is present in the Golgi and the nucleus (44); and DGK produces PA at the plasma membrane, ER, and nucleus (45). However, because our previous and current data show that each of three different catalytic pathways, GPAT/AGPAT, PLD, and DGK, provides PA that inhibits insulin signaling to Akt, the ability of PA to disrupt insulin signaling suggests that the effect of the PA may be unrelated to its source. Instead, the ability of PA to stabilize or disrupt mTORC may depend on the length and saturation of its fatty acid chains (1, 41). Our work has shown that overexpressing any of five enzymes in mouse hepatocytes, GPAT4, PLD1, PLD2, DGKθ, or GPAT1, impaired insulin signaling (Figs. 1, 3, and 5) and significantly increased the content of PA, particularly di16:0 PA (Figs. 2, 4, and 6 and Table 1). Although the hepatic PA content produced by GPAT3 was similar to that produced by DGKθ, it did not inhibit Akt phosphorylation, supporting the idea that the individual PA species are more critical than the amount of PA. This result is consistent with our previous report that of 10 lysoPA, DAG, and PA species tested, only di16:0 PA interfered with mTORC2 assembly (13).
Although many studies have concluded that DAG-mediated activation of PKC inhibits insulin signaling (2), divergent work has been reported. In both animal and human studies, elevated DAG content caused by lipid infusion or overload does not lead to suppressed insulin action or to insulin resistance, and insulin resistance is not always accompanied by increases in DAG content (1, 7–9). The current study provides data from cultured primary mouse hepatocytes showing that insulin resistance does not always correlate with DAG content and that the ratio of membrane to cytosolic PKC protein is not invariably a proxy for PKC activation.
Of the nine PKC isoforms, PKCϵ has been most widely reported as activated by DAG in liver to suppress insulin action (5). However, the different DAG species vary in their ability to activate PKC (41). Activation of PKC requires stereospecific 1,2-sn-diacylglycerols (46). The 1,2-sn-di18:1 DAG and 1,2-sn-di20:4 DAG show the strongest stimulatory effect on PKC activity, and sn-1–18:0–2-18:1 DAG, sn-1–18:0–2-18:2 DAG, and sn-1,2-di18:2 DAG are also effective (47). However, most studies in which an increase in tissue content of DAG has been reported to activate PKC and cause insulin resistance have not distinguished among DAG species, making it unclear whether the activation was caused by an increase in total DAG or by a particular DAG species. We previously reported that overexpressing GPAT1 or AGPAT2 in mouse hepatocytes inhibited insulin signaling; this inhibition was accompanied by increases in the cellular content of both PA and DAG, suggesting that both these lipids might impair insulin signaling (12). When we identified the lipid species, we determined that overexpressing GPAT1 or AGPAT2 did not increase the reportedly effective DAG species, di18:1 DAG and 18:1–18:2 DAG. Our data suggested that although total DAG content increased 1.5–2.2-fold when GPAT1 or AGPAT2 was overexpressed, DAG might not have been the major inhibitor of insulin signaling (12). In the current study, both overexpressed PLD1 and PLD2 impaired insulin signaling in mouse hepatocytes but did not increase total DAG content, while only minimally increasing di18:1 DAG and 18:2–18:2 DAG (Figs. 1 and 2 and Table 2). In addition, overexpressing DGKθ impaired insulin signaling in mouse hepatocytes and decreased, rather than increased, total DAG and di18:1 DAG (Figs. 3 and 4 and Table 2). These results dissociate inhibited insulin signaling from hepatocyte DAG content. Similarly, although overexpressing GPAT4 in mouse hepatocytes impaired insulin signaling, PKC was not activated despite a 2.1-fold increase in total DAG content, perhaps because the DAG was sequestered in lipid droplets or because di18:1 DAG content increased only 20% and di18:2 DAG decreased.
Although some early studies of hepatic insulin resistance directly measured the activity of PKC, these studies did not show a correlation between hepatic insulin resistance, PKC activation, and increased DAG content (48, 49). Except for a single paper that measured PKC activity (50), the majority of recent studies of PKC activity and hepatic insulin resistance measured only the ratio of membrane to cytosolic PKCϵ protein. The current study shows that the increase in this ratio does not necessarily represent a change in PKC activity; in the present case, the ratio changed because the amount of cytosolic PKCϵ protein consistently decreased in numerous preparations. A similar discrepancy in the ratio of membrane to cytosolic PKCϵ and δ proteins and PKC activity was reported in mice with deficient hepatic MGAT1 (39). Notably, overexpressing any of five enzymes did not change IRS1 phosphorylation at serine 612 (Figs. 1, D and E, and 3, D and E), the site that is specifically phosphorylated by PKC (3), providing additional evidence that DAG does not mediate the inhibition of insulin signaling by these enzymes. The most direct evidence for DAG activation of PKC comes from in vitro studies in which purified PKC protein was added to a reaction system in which a synthesized peptide substrate was present together with phospholipids, Ca2+, and ATP, in the presence or absence of DAG. Results of in vitro studies showed 2–6-fold increases in PKC activity when particular species of DAG were present (40, 47). Because conventional and novel PKC isoforms are activated by DAG, many commercial kits for PKC assay include DAG in the activation or coactivation buffer, which makes it unclear as to whether changes observed in PKC activity are caused by endogenous or exogenous DAG. Acute changes in DAG may not play the same role in live cells in which PKC might have already interacted with cellular DAG and might not be further affected by the DAG provided in commercial kits.
Our study has two potential limitations. Although the enzyme activities are within normal ranges for mammalian tissues, they do result from the overexpression of enzymes whose subcellular locations are not known, so it is possible that PA produced endogenously by each of these pathways would not have the same effect. A second caveat is that the primary hepatocytes were cultured in Williams's medium E, which provides 5.5 mm glucose as the major energy source. The glucose may have enhanced ChREBP-controlled de novo lipogenesis, thereby increasing the production of 16:0 fatty acids that were then incorporated into PA via the GPAT pathway and into phospholipids available for PLD hydrolysis.
Finding a relationship between an increased cellular content of distinct PA species and impaired insulin signaling provides a new therapeutic target for treatment of insulin resistance. However, the mechanism for PA action in regulating insulin signaling requires further study. Although we have reported that di16:0 PA disrupts mTOR/rictor assembly in vitro, the mechanisms that underlie this disruption and the interaction of di16:0 PA with mTORC2 are not known. Likewise, a full understanding of the molecular mechanism of lipid intermediate-mediated insulin resistance may also require the identification of particular DAG species that effectively activate PKC.
This work was supported by National Institutes of Health Grants DK56598 (to R. A. C.) and P01 HL98050 (to V. N.) and American Diabetes Association Grant 7-11-JF-21 (to T. E. H.).
- DAG
- diacylglycerol
- AGPAT
- acylglycerol-3-phosphate acyltransferase
- DGK
- diacylglycerol kinase
- EGFP
- enhanced green fluorescent protein
- GPAT
- glycerol-3-phosphate acyltransferase
- mTOR
- mammalian target of rapamycin
- mTORC
- mTOR complex
- NEM
- N-ethylmaleimide
- PA
- phosphatidic acid
- PLD
- phospholipase D
- PMA
- phorbol 12-myristate 12-acetate
- IRS
- insulin receptor substrate.
REFERENCES
- 1. Zhang C., Klett E. L., Coleman R. A. (2013) Lipid signals and insulin resistance. Clin. Lipidol. 8, 659–667 [DOI] [PMC free article] [PubMed] [Google Scholar]
- 2. Birkenfeld A. L., Shulman G. I. (2014) Nonalcoholic fatty liver disease, hepatic insulin resistance, and type 2 diabetes. Hepatology 59, 713–723 [DOI] [PMC free article] [PubMed] [Google Scholar]
- 3. De Fea K., Roth R. A. (1997) Protein kinase C modulation of insulin receptor substrate-1 tyrosine phosphorylation requires serine 612. Biochemistry 36, 12939–12947 [DOI] [PubMed] [Google Scholar]
- 4. Li Y., Soos T. J., Li X., Wu J., Degennaro M., Sun X., Littman D. R., Birnbaum M. J., Polakiewicz R. D. (2004) Protein kinase C Theta inhibits insulin signaling by phosphorylating IRS1 at Ser1101. J. Biol. Chem. 279, 45304–45307 [DOI] [PubMed] [Google Scholar]
- 5. Jornayvaz F. R., Shulman G. I. (2012) Diacylglycerol activation of protein kinase Cε and hepatic insulin resistance. Cell Metab. 15, 574–584 [DOI] [PMC free article] [PubMed] [Google Scholar]
- 6. Magkos F., Su X., Bradley D., Fabbrini E., Conte C., Eagon J. C., Varela J. E., Brunt E. M., Patterson B. W., Klein S. (2012) Intrahepatic diacylglycerol content is associated with hepatic insulin resistance in obese subjects. Gastroenterology 142, 1444–1446.e2 [DOI] [PMC free article] [PubMed] [Google Scholar]
- 7. Minehira K., Young S. G., Villanueva C. J., Yetukuri L., Oresic M., Hellerstein M. K., Farese R. V., Jr., Horton J. D., Preitner F., Thorens B., Tappy L. (2008) Blocking VLDL secretion causes hepatic steatosis but does not affect peripheral lipid stores or insulin sensitivity in mice. J. Lipid Res. 49, 2038–2044 [DOI] [PMC free article] [PubMed] [Google Scholar]
- 8. Monetti M., Levin M. C., Watt M. J., Sajan M. P., Marmor S., Hubbard B. K., Stevens R. D., Bain J. R., Newgard C. B., Farese R. V., Sr., Hevener A. L., Farese R. V., Jr. (2007) Dissociation of hepatic steatosis and insulin resistance in mice overexpressing DGAT in the liver. Cell Metab. 6, 69–78 [DOI] [PubMed] [Google Scholar]
- 9. Monetti M., Levin M. C., Watt M. J., Hubbard B. K., Newgard C., Farese R. V., Sr., Hevener A. L., Farese R. V., Jr. (2011) Hepatic acyl-CoA:diacylglcyerol acyltransferase (DGAT) overexpression, diacylglycerol, and insulin sensitivity. Proc. Natl. Acad. Sci. U.S.A. 108, E523; author reply E524 [DOI] [PMC free article] [PubMed] [Google Scholar]
- 10. Rector R. S., Morris E. M., Ridenhour S., Meers G. M., Hsu F. F., Turk J., Ibdah J. A. (2013) Selective hepatic insulin resistance in a murine model heterozygous for a mitochondrial trifunctional protein defect. Hepatology 57, 2213–2223 [DOI] [PMC free article] [PubMed] [Google Scholar]
- 11. Cantley J. L., Yoshimura T., Camporez J. P., Zhang D., Jornayvaz F. R., Kumashiro N., Guebre-Egziabher F., Jurczak M. J., Kahn M., Guigni B. A., Serr J., Hankin J., Murphy R. C., Cline G. W., Bhanot S., Manchem V. P., Brown J. M., Samuel V. T., Shulman G. I. (2013) CGI-58 knockdown sequesters diacylglycerols in lipid droplets/ER-preventing diacylglycerol-mediated hepatic insulin resistance. Proc. Natl. Acad. Sci. U.S.A. 110, 1869–1874 [DOI] [PMC free article] [PubMed] [Google Scholar]
- 12. Zhang C., Wendel A. A., Keogh M. R., Harris T. E., Chen J., Coleman R. A. (2012) Glycerolipid signals alter mTOR complex 2 (mTORC2) to diminish insulin signaling. Proc. Natl. Acad. Sci. U.S.A. 109, 1667–1672 [DOI] [PMC free article] [PubMed] [Google Scholar]
- 13. Zhang C., Cooper D. E., Grevengoed T. J., Li L. O., Klett E. L., Eaton J. M., Harris T. E., Coleman R. A. (2014) Glycerol-3-phosphate acyltransferase-4-deficient mice are protected from diet-induced insulin resistance by the enhanced association of mTOR and rictor. Am. J. Physiol. Endocrinol. Metab. 307, E305–E315 [DOI] [PMC free article] [PubMed] [Google Scholar]
- 14. Fang Y., Vilella-Bach M., Bachmann R., Flanigan A., Chen J. (2001) Phosphatidic acid-mediated mitogenic activation of mTOR signaling. Science 294, 1942–1945 [DOI] [PubMed] [Google Scholar]
- 15. Zhang J., Gao Z., Yin J., Quon M. J., Ye J. (2008) S6K directly phosphorylates IRS-1 on Ser-270 to promote insulin resistance in response to TNF-α signaling through IKK2. J. Biol. Chem. 283, 35375–35382 [DOI] [PMC free article] [PubMed] [Google Scholar]
- 16. Toschi A., Lee E., Xu L., Garcia A., Gadir N., Foster D. A. (2009) Regulation of mTORC1 and mTORC2 complex assembly by phosphatidic acid: competition with rapamycin. Mol. Cell Biol. 29, 1411–1420 [DOI] [PMC free article] [PubMed] [Google Scholar]
- 17. Shulga Y. V., Topham M. K., Epand R. M. (2011) Regulation and functions of diacylglycerol kinases. Chem. Rev. 111, 6186–6208 [DOI] [PubMed] [Google Scholar]
- 18. Mérida I., Avila-Flores A., Merino E. (2008) Diacylglycerol kinases: at the hub of cell signalling. Biochem. J. 409, 1–18 [DOI] [PubMed] [Google Scholar]
- 19. Chibalin A. V., Leng Y., Vieira E., Krook A., Björnholm M., Long Y. C., Kotova O., Zhong Z., Sakane F., Steiler T., Nylén C., Wang J., Laakso M., Topham M. K., Gilbert M., Wallberg-Henriksson H., Zierath J. R. (2008) Downregulation of diacylglycerol kinase delta contributes to hyperglycemia-induced insulin resistance. Cell 132, 375–386 [DOI] [PubMed] [Google Scholar]
- 20. Usatyuk P. V., Kotha S. R., Parinandi N. L., Natarajan V. (2013) Phospholipase D signaling mediates reactive oxygen species-induced lung endothelial barrier dysfunction. Pulm. Circ. 3, 108–115 [DOI] [PMC free article] [PubMed] [Google Scholar]
- 21. Lewin T. M., Wang S., Nagle C. A., Van Horn C. G., Coleman R. A. (2005) Mitochondrial glycerol-3-phosphate acyltransferase-1 directs the metabolic fate of exogenous fatty acids in hepatocytes. Am. J. Physiol. Endocrinol. Metab. 288, E835–E844 [DOI] [PubMed] [Google Scholar]
- 22. Nagle C. A., Vergnes L., Dejong H., Wang S., Lewin T. M., Reue K., Coleman R. A. (2008) Identification of a novel sn-glycerol-3-phosphate acyltransferase isoform, GPAT4, as the enzyme deficient in Agpat6−/− mice. J. Lipid Res. 49, 823–831 [DOI] [PMC free article] [PubMed] [Google Scholar]
- 23. Gorshkova I., He D., Berdyshev E., Usatuyk P., Burns M., Kalari S., Zhao Y., Pendyala S., Garcia J. G., Pyne N. J., Brindley D. N., Natarajan V. (2008) Protein kinase C-epsilon regulates sphingosine 1-phosphate-mediated migration of human lung endothelial cells through activation of phospholipase D2, protein kinase C-zeta, and Rac1. J. Biol. Chem. 283, 11794–11806 [DOI] [PMC free article] [PubMed] [Google Scholar]
- 24. Folch J., Lees M., Sloane Stanley G. H. (1957) A simple method for the isolation and purification of total lipides from animal tissues. J. Biol. Chem. 226, 497–509 [PubMed] [Google Scholar]
- 25. Murphy R. C., James P. F., McAnoy A. M., Krank J., Duchoslav E., Barkley R. M. (2007) Detection of the abundance of diacylglycerol and triacylglycerol molecular species in cells using neutral loss mass spectrometry. Anal. Biochem. 366, 59–70 [DOI] [PMC free article] [PubMed] [Google Scholar]
- 26. Coleman R. A., Mashek D. G. (2011) Mammalian triacylglycerol metabolism: synthesis, lipolysis, and signaling. Chem. Rev. 111, 6359–6386 [DOI] [PMC free article] [PubMed] [Google Scholar]
- 27. Fang Y., Park I. H., Wu A. L., Du G., Huang P., Frohman M. A., Walker S. J., Brown H. A., Chen J. (2003) PLD1 regulates mTOR signaling and mediates Cdc42 activation of S6K1. Curr. Biol. 13, 2037–2044 [DOI] [PubMed] [Google Scholar]
- 28. Du G., Altshuller Y. M., Kim Y., Han J. M., Ryu S. H., Morris A. J., Frohman M. A. (2000) Dual requirement for rho and protein kinase C in direct activation of phospholipase D1 through G protein-coupled receptor signaling. Mol. Biol. Cell 11, 4359–4368 [DOI] [PMC free article] [PubMed] [Google Scholar]
- 29. Epand R. M., Topham M. K. (2007) Measurement of mammalian diacylglycerol kinase activity in vitro and in cells. Methods Enzymol. 434, 293–304 [DOI] [PubMed] [Google Scholar]
- 30. Walsh J. P., Bell R. M. (1992) Diacylglycerol kinase from Escherichia coli. Methods Enzymol. 209, 153–162 [DOI] [PubMed] [Google Scholar]
- 31. Sarbassov D. D., Guertin D. A., Ali S. M., Sabatini D. M. (2005) Phosphorylation and regulation of Akt/PKB by the rictor-mTOR complex. Science 307, 1098–1101 [DOI] [PubMed] [Google Scholar]
- 32. Sun Y., Chen J. (2008) mTOR signaling: PLD takes center stage. Cell Cycle 7, 3118–3123 [DOI] [PubMed] [Google Scholar]
- 33. Foster D. A., Salloum D., Menon D., Frias M. (2014) Phospholipase D and the maintenance of phosphatidic acid levels for regulation of mammalian target of rapamycin (mTOR). J. Biol. Chem. 289, 22583–22588 [DOI] [PMC free article] [PubMed] [Google Scholar]
- 34. Loewith R., Jacinto E., Wullschleger S., Lorberg A., Crespo J. L., Bonenfant D., Oppliger W., Jenoe P., Hall M. N. (2002) Two TOR complexes, only one of which is rapamycin sensitive, have distinct roles in cell growth control. Mol. Cell 10, 457–468 [DOI] [PubMed] [Google Scholar]
- 35. Gulati P., Thomas G. (2007) Nutrient sensing in the mTOR/S6K1 signalling pathway. Biochem. Soc. Trans. 35, 236–238 [DOI] [PubMed] [Google Scholar]
- 36. Nagle C. A., An J., Shiota M., Torres T. P., Cline G. W., Liu Z.-X., Wang S., Catlin R. L., Shulman G. I., Newgard C. B., Coleman R. A. (2007) Hepatic overexpression of glycerol-sn-3-phosphate acyltransferase 1 in rats causes insulin resistance. J. Biol. Chem. 282, 14807–14815 [DOI] [PMC free article] [PubMed] [Google Scholar]
- 37. Wilfling F., Wang H., Haas J. T., Krahmer N., Gould T. J., Uchida A., Cheng J. X., Graham M., Christiano R., Fröhlich F., Liu X., Buhman K. K., Coleman R. A., Bewersdorf J., Farese R. V., Jr., Walther T. C. (2013) Triacylglycerol synthesis enzymes mediate lipid droplet growth by relocalizing from the ER to lipid droplets. Dev. Cell 24, 384–399 [DOI] [PMC free article] [PubMed] [Google Scholar]
- 38. Chen Y. Q., Kuo M. S., Li S., Bui H. H., Peake D. A., Sanders P. E., Thibodeaux S. J., Chu S., Qian Y. W., Zhao Y., Bredt D. S., Moller D. E., Konrad R. J., Beigneux A. P., Young S. G., Cao G. (2008) AGPAT6 is a novel microsomal glycerol-3-phosphate acyltransferase. J. Biol. Chem. 283, 10048–10057 [DOI] [PMC free article] [PubMed] [Google Scholar]
- 39. Hall A. M., Soufi N., Chambers K. T., Chen Z., Schweitzer G. G., McCommis K. S., Erion D. M., Graham M. J., Su X., Finck B. N. (2014) Abrogating monoacylglycerol acyltransferase activity in liver improves glucose tolerance and hepatic insulin signaling in obese mice. Diabetes 63, 2284–2296 [DOI] [PMC free article] [PubMed] [Google Scholar]
- 40. Takai Y., Kishimoto A., Iwasa Y., Kawahara Y., Mori T., Nishizuka Y. (1979) Calcium-dependent activation of a multifunctional protein kinase by membrane phospholipids. J. Biol. Chem. 254, 3692–3695 [PubMed] [Google Scholar]
- 41. Farese R. V., Jr., Zechner R., Newgard C. B., Walther T. C. (2012) The problem of establishing relationships between hepatic steatosis and hepatic insulin resistance. Cell Metab. 15, 570–573 [DOI] [PMC free article] [PubMed] [Google Scholar]
- 42. Lu B., Jiang Y. J., Kim P., Moser A., Elias P. M., Grunfeld C., Feingold K. R. (2010) Expression and regulation of GPAT isoforms in cultured human keratinocytes and rodent epidermis. J. Lipid Res. 51, 3207–3216 [DOI] [PMC free article] [PubMed] [Google Scholar]
- 43. Prasad S. S., Garg A., Agarwal A. K. (2011) Enzymatic activities of the human AGPAT isoform 3 and isoform 5: localization of AGPAT5 to mitochondria. J. Lipid Res. 52, 451–462 [DOI] [PMC free article] [PubMed] [Google Scholar]
- 44. Freyberg Z., Sweeney D., Siddhanta A., Bourgoin S., Frohman M., Shields D. (2001) Intracellular localization of phospholipase D1 in mammalian cells. Mol. Biol. Cell 12, 943–955 [DOI] [PMC free article] [PubMed] [Google Scholar]
- 45. Goto K., Hozumi Y., Nakano T., Saino-Saito S., Martelli A. M. (2008) Lipid messenger, diacylglycerol, and its regulator, diacylglycerol kinase, in cells, organs, and animals: history and perspective. Tohoku J. Exp. Med. 214, 199–212 [DOI] [PubMed] [Google Scholar]
- 46. Rando R. R., Young N. (1984) The stereospecific activation of protein kinase C. Biochem. Biophys. Res. Commun. 122, 818–823 [DOI] [PubMed] [Google Scholar]
- 47. Kishimoto A., Takai Y., Mori T., Kikkawa U., Nishizuka Y. (1980) Activation of calcium and phospholipid-dependent protein kinase by diacylglycerol, its possible relation to phosphatidylinositol turnover. J. Biol. Chem. 255, 2273–2276 [PubMed] [Google Scholar]
- 48. Donnelly R., Chang H., Azhar S., Reaven G. M. (1995) Tissue-dependent activation of protein kinase C in fructose-induced insulin resistance. Endocrine 3, 129–133 [DOI] [PubMed] [Google Scholar]
- 49. Qu X., Seale J. P., Donnelly R. (1999) Tissue- and isoform-specific effects of aging in rats on protein kinase C in insulin-sensitive tissues. Clin. Sci. 97, 355–361 [DOI] [PubMed] [Google Scholar]
- 50. Samuel V. T., Liu Z.-X., Qu X., Elder B. D., Bilz S., Befroy D., Romanelli A. J., Shulman G. I. (2004) Mechanism of hepatic insulin resistance in non-alcoholic fatty liver disease. J. Biol. Chem. 279, 32345–32353 [DOI] [PubMed] [Google Scholar]