

Abstract
Cell mass, volume and growth rate are tightly controlled biophysical parameters in cellular development and homeostasis, and pathological cell growth defines cancer in metazoans. The first measurements of cell mass were made in the 1950s, but only recently have advances in computer science and microfabrication spurred the rapid development of precision mass-quantifying approaches. Here we discuss available techniques for quantifying the mass of single live cells with an emphasis on relative features, capabilities and drawbacks for different applications.
The regulation of cell mass, volume and growth rate is essential for life, but the mechanisms that control cell size are still poorly understood1. A standard approach for measuring cell growth is to count the number of cells at different times as a measure of proliferation, taking into account concurrent cell death. Cell counting works well for exponentially proliferating, symmetrically dividing cells such as pluripotent stem cells or immortalized cells, for which both cell size and number double over the course of the cell cycle. It is increasingly clear, however, that cell mass, volume and number are often differentially regulated in metazoans both during development and after the body plan is established2.
Cell size has usually been reported as either cell volume or mass. There are many established techniques to measure cell volume, including the use of a Coulter Counter3,4 or image analysis for cells of relatively fixed spherical3 or rod-like5 shapes, which have yielded new insights into how cells regulate growth. For example, measuring the size of budding yeast from photographs provided evidence for a cell cycle–linked size threshold6, whereas volume measurements of mammalian cells have revealed a similar trend of increasing growth rate with increasing size3. However, cell volume can be affected by osmotic forces and water content, and cell shape may be highly variable, as is the case for most adherent mammalian cells, making accurate size determinations from cellular geometry alone difficult. Cell mass, by contrast, is the direct result of biosynthetic and degradative processes within a cell and is therefore a more precise indicator of cell size2. Cell mass measurements may also be the preferred approach when the outcome of interest is tightly linked to changes in cell mass: for example, during cell death7 or in response to drug treatments affecting anabolic8 or degradative9 pathways. Because the factors that regulate size are still not fully understood, cell mass measurements should be used in conjunction with volume measurements to study the regulation of cell size10,11.
A primary motivation for quantifying cell size is to evaluate the regulation of size and growth of individual cells during the cell cycle5, an issue of fundamental importance in development. The first approach for determining single-cell mass, reported in 1952 (refs. 12,13), was based on an interference microscopy platform12–15. This general approach was also used in 1957 to study the mass accumulation of single, live yeast cells throughout the cell cycle5. Early work on the growth of yeast showed evidence of cell size checkpoints that prevent cells from growing bigger once they have reached a certain size6. In cells that accumulate mass exponentially, these mechanisms keep the size of individual cells in the population from diverging from the mean.
Major limitations of this early work were that the optical systems were entirely custom built14 and, without software approaches for image processing, were labor intensive, were not widely used, and lacked the precision and throughput of more modern methods. These limitations are being overcome by recent advances in microfabrication16 and image processing17,18. A growing number of studies using these recently developed methods to study mammalian cells suggest a more complicated picture of cell size regulation, pointing to a balance of internal biosynthetic and degradative processes and to extracellular cues that coordinately control cell size1. In particular, a classic study showed that individual rat Schwann cells exhibit a nearly constant (linear) increase in size19, which would not require size checkpoints to prevent the size of individual cells from diverging away from the population mean20. On the other hand, recent mass and volume measurements of a wide variety of mammalian cell types point to an increase in growth rate with size consistent with exponential growth3,21,22, or to a more complicated picture than simple linear or exponential growth, with crucial regulation occurring primarily at the G1-to-S phase transition11,23.
Ideally, mass quantification should be precise and rapid enough to capture the details of growth over the cell cycle while tracking many individual cells or cell clusters over multiple days and cell cycles. Smaller cells, such as those of bacteria or other microorganisms, generally require higher absolute accuracy and resolution than mammalian cells owing to their smaller size. There are a variety of methods based on microfabricated resonators or optical methods24 that approach these ideals. In this Review, we summarize and discuss methods to quantify the mass of cells, provide guidance to help inform choice for particular applications, and end with an outlook for future work in this rapidly expanding area.
Microfabricated resonators
The resonant frequency of a microelectromechanical systems (MEMS) resonator can be measured to very high precision and is a function of its total mass16, allowing, for example, affinity-capture detection of individual Escherichia coli cells based on the increase in total resonator mass when they bind to the resonator25. Early applications of this approach to measure the growth rate of cells measured the mass of adherent cells attached to the top of microfabricated pedestals26. These measurements, however, had limited resolution because of damping of the resonator by surrounding fluid, which reduces the resonator quality (Q)-factor, a measure of how fast the resonator loses energy (higher resonator Q-factors enable higher resolution of resonator frequency and, therefore, of cell mass). A breakthrough in the microfabricated resonator approach for cell mass measurement was the placement of the cell and cell culture medium inside a fluid microchannel through a silicon cantilever suspended in a vacuum (Fig. 1a). Single cells can be passed through this fluid channel, with the resulting shift in resonant frequency due to each cell used to determine the mass of that cell22. This approach allows for a very high Q-factor, resulting in a sensitivity of better than 100 attograms when optimized for measurements of single nanoparticles or subcellular particles27,28. This system can also be optimized for the study of small or large cells by changing the channel size, with a smaller channel size giving a higher sensitivity at the expense of excluding larger cells.
Figure 1.
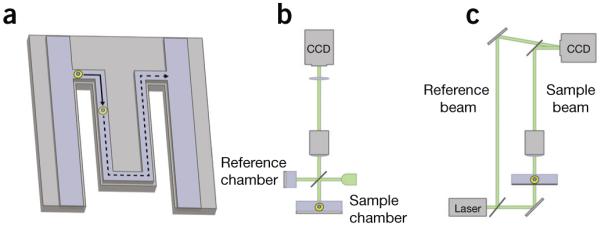
Some methods for single-cell or single-cluster mass measurements. (a) In a microfluidic cantilever, single nonadherent cells (yellow circle) pass through a microchannel contained within a vibrating cantilever. The cell buoyant mass is detected as a shift in the vibration frequency of the cantilever22,31. (b) Example of phase-shifting interferometry based on a Michelson interferometer. Incoherent light incident on the sample is split into two paths and passes through the reference and sample chambers. The phase shift of light as it passes through a cell is determined from the interference of light from these two paths when they are reflected back and recombine at a charge-coupled device (CCD) camera9. (c) Example of digital holographic microscopy using an off-axis Mach-Zehnder interferometer. Coherent light from a reference beam interferes with light from a sample beam in an off-axis configuration as the reference beam is tilted relative to the sample beam. This forms a hologram at a CCD camera that can be interrogated computationally to generate images of the phase shift of light as it passed through a biological sample46.
Microfabricated microfluidic resonators have been used for growth-rate measurements of single bacterial and mammalian cells and typically show a trend of increasing growth rate with increasing cell mass22,26, suggesting the existence of a mechanism to regulate cell mass during the cell cycle. The high precision of these measurements provides statistically meaningful comparisons between different models of cell growth (for example, linear versus exponential), with important implications for the mechanisms that control cell growth or size29. Microfluidic resonators have also been combined with volume measurements made with a Coulter Counter to quantify the growth of yeast volume and mass over time30. This work showed that the density of individual yeast cells increased at the G1-to-S transition and that this density increase was dependent on basic cell physiological processes including ATP production and protein synthesis as well as on an intact actin cytoskeleton. This density increase was independent of DNA replication, suggesting an origin based on the regulation of protein mass or water content.
On its own, the microfluidic resonator approach measures the buoyant mass, meaning the net change of mass within the resonator due to the presence of a cell (for glossary, see Box 1). This quantity can be negative: for example, with low-density particles (polystyrene) in water or for cells measured in dense fluids. The microfluidic resonator system also allows for easy exchange of the fluid surrounding the cell, enabling the introduction of fluids of different density for quantifying both cell mass and volume. This technique was used to measure the change in density of individual leukemia cells in the early stages of response to a drug treatment31. Fast fluid exchange within microfluidic resonators has also been used to quickly apply drug treatments to cells. For example, medium containing sodium azide, a respiratory system poison, was quickly washed over mouse lymphoblast cells to quantify the effect of altered energy metabolism on mass accumulation rate8, an approach that can be applied more broadly to study the ability of cells to take up nutrients in response to drug treatments.
BOX 1. GLOSSARY.
Buoyant mass: cell mass minus the mass of the fluid displaced by the cell; can be negative in dense fluids
Dry mass: mass of all the components of the cell (for example, proteins, nucleic acids, lipids, etc.) other than water; sometimes referred to as biomass
Growth rate: increase in cell mass per unit time
Proliferation rate: increase in the number of cells per unit time
Q-factor: quality factor; dimensionless parameter related to how precisely a resonator’s frequency can be measured
Size: broadly used term encompassing cell volume, diameter, area or mass
An important limitation of microfluidic resonators is that for maximum measurement stability, cells must be in suspension, which excludes adherent cells or cells that grow in irregularly shaped clusters or colonies. Parallelization of this approach can be achieved for simultaneous studies of multiple single cells, but this requires extensive microfabrication and fluid-handling modifications to the basic device. The microfluidic resonator approach does not require computationally intensive image processing, but it is also more difficult to integrate with imaging modalities such as fluorescence microscopy, although this capability has been demonstrated and was used to show a critical growth-rate threshold at the G1-to-S transition in mammalian cells23. With microfluidic resonators there is generally a trade-off between the number of cells that can be tracked and the length of time that each cell can be followed. Many cells can be passed through the system to get a snapshot of population mass over time in a synchronized population30, or individual cells can be tracked over longer times to assess growth over a complete cell cycle23. Achieving both high-throughput and longitudinal measurements is limited by the number of sensors that can be fabricated and used in parallel, and to date microfluidic resonators have not matched the capability of the imaging methods that will be discussed in the next section (Table 1). Overall, microfabricated microfluidic resonators are best suited for nonadherent single-cell mass and volume measurements for a small number of cells requiring extraordinarily high sensitivity and precision.
Table 1.
A comparison of available single-cell mass measurement methods
| Class | Method | Cell mass resolution (pg) |
Frequency (Hz) |
Duration (h) | Throughput (cells/trial) |
Adherent or suspension cells |
Refs. |
|---|---|---|---|---|---|---|---|
| MEMS | Resonator platform | 8.5 | 0.01 | 60 | 30 | Adherent | 26 |
| Microfluidic resonator | 0.02–0.10 | 1–10 | 0.1 | 1 | Suspension | 22 | |
| Microfluidic resonator | 0.02 | 0.03 | 110 | 1 | Suspension | 23 | |
| Optical | Phase-shifting interferometry | 1 | 3 | 12 | 400 | Both | 9 |
| Digital holographic microscopya | 10 | 0.02 | 48 | 20 | Adherent (compatible with both) | 21 | |
| Quadriwave lateral shearing interferometry | NR | 10 | NR | NR | Adherent (compatible with both) | 40,41 | |
| Quantitative phase tomography | NR | 0.004 | NR | 2 | Both | 56 |
Cell mass resolution is reported for single mammalian cells and is different for nonmammalian cells. Throughput refers to the number of cells measured simultaneously per experimental trial. MEMS, microelectromechanical systems; NR, not reported.
Via spatial light-interference microscopy.
Optical approaches
There are a variety of optical approaches that have been developed to quantify cell mass. These are applicable to a wide variety of cell types and can, in principle, be used alongside other imaging modalities such as fluorescence microscopy. In the next sections we first discuss interferometry and the general approach of quantitative phase microscopy (QPM); then we discuss digital holography and quantitative phase tomography (QPT), two important subclasses of interferometric QPM methods; finally, we conclude with other, non-interferometric optical approaches to measure live-cell mass.
Interferometry
In an interference microscope, a light source is split into two paths, which are recombined to generate interference fringes that can be used to quantify the phase shift, that is, the amount that light is slowed down while passing through a transparent object (such as a cell) as the light interacts with its matter32 (Fig. 1b,c). This phase shift in the light wave passing through a cell12,13 is a measure of the integrated refractive index through its thickness and can be related to cell mass using the known relationship between refractive index and density32 (Fig. 2). Summing the phase shift across the area of the cell and applying a conversion factor (Box 2) yields measurements of the cell dry mass, or biomass, which is the mass of everything making up the cell (proteins, nucleic acids, lipids, sugars, metabolites, ions and so forth) other than water.
Figure 2.
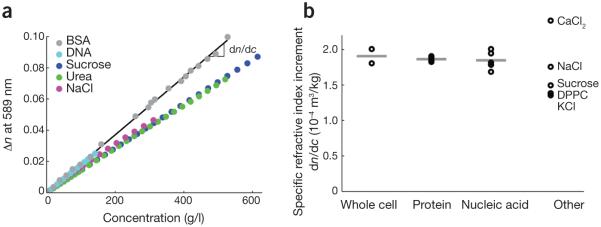
Specific refractive index increment of biomolecules. (a) Changes in refractive index, n, of various biomolecules in solution relative to that of the solvent (water) as a function of biomolecule mass concentration. The slope of this line, dn/dc, is the specific refractive increment used in determinations of cell dry mass from quantitative phase images. (b) Representative specific refractive index increments of selected biomolecule groups, with the averages of these selected values indicated as horizontal bars. Data are shown for whole-cell average values73,74, proteins (multiprotein average75–78, bovine serum albumin (BSA)79 and Evans bacteriological peptone79), nucleic acids (DNA80–82 and RNA83,84) and other components (CaCl285, NaCl85, KCl85, sucrose85 and dipalmitoyl phosphatidylcholine (DPPC), a common phospolipid86).
Box 2. REFRACTIVE INDEX CALIBRATION AND DETERMINATION OF CELL DRY MASS.
In quantitative phase microscopy, the relationship between mass and refractive index is used to convert cell refractive index distributions to dry mass measurements. Most biomolecules exhibit a linear relationship between refractive index and concentration (Fig. 2a). The slope of this relationship, dn/dc, is called the specific refractive increment, which relates the refractive index change to increases in biomolecule mass density. Specific refractive increments for most biomolecules, particularly those for proteins and nucleic acids that make up the majority of a typical cell’s mass88, fall within a very narrow range (Fig. 2b), allowing a meaningful average value to be used to compute cell mass. This average value is typically taken as approximately 1.8 × 10⁻⁴ m3/kg (refs. 9,32,76) and can be used to convert phase shifts to dry mass using equation (1)
| (1) |
where m is the cell dry mass; α, the specific refractive increment, is equal to dn/c (Fig. 2); ϕ is the measured phase shift as a fraction of wavelength; λ is the illumination wavelength; and integration is performed across the entire cell area, A. However, assuming that cell composition does not vary dramatically among treatment groups, the specific value of a is often not important. This is a reasonable assumption, for example, when making relative measurements of cell mass between populations37 or when measuring the rate of increase in mass over time, which is often normalized to cell mass21,35.
QPM methods have stemmed from many applications including optical profilometry for characterizing object surfaces, wavefront sensing based on a Hartmann mask for adaptive optics or to characterize optical components, and digital holography to improve the electron microscope33, all of which have been used to measure single-cell mass. We can summarize several representative QPM methods on the basis of key system parameters: the general class of interferometry (phase shifting versus off-axis), with phase-shifting or phase-modulation techniques requiring acquisition of multiple frames, thus reducing speed; the specific interferometric geometry; the cell substrate requirements, such as reflection or transmission properties, which dictate whether ordinary cell culture dishes can be used; and the coherence of the light source, with coherent sources resulting in increased measurement noise (Table 2).
Table 2.
Classification of representative optical interferometry approaches relative to critical performance-related parameters
| Method | Interference method | Geometry | Reflection or transmission |
Light source | Refs. |
|---|---|---|---|---|---|
| Phase-shifting interferometry | Phase shifting | Michelson-Linnik | Both | Low coherence | 34 |
| Digital holographic microscopy | Off-axis | Mach-Zehnder | Transmission | Coherent | 46 |
| Diffraction-phase microscopy | Common path | Diffraction gratinga | Transmission | Coherent87 or low coherence38 | 38,87 |
| Quadriwave lateral shearing interferometry |
Lateral shearing | Modified Hartmann mask | Transmission | Low coherence | 40,41 |
| Spatial light-interference microscopy |
Phase modulation | Modified phase contrast | Transmission | Low coherence | 70 |
| Live-cell interferometry | Phase shifting | Michelson | Reflection | Low coherence | 9 |
| Quantitative phase imaging | Pixelated phase mask | Michelson-Linnik | Reflection | Low coherence | 69 |
| Quantitative phase tomography | Off-axis | Mach-Zehnder | Transmission | Coherent | 56 |
Low-spatial frequency image used as reference.
One method for generating quantitative phase images is phase-shifting interferometry. In this approach, fringes generated by interference between the reference and sample arms of the interferometer are shifted by precise amounts while a camera captures a series of images. These images are then combined to compute the optical path length distribution across the cell with subnanometer precision34 (Table 1). This approach has been used to longitudinally track the effects of drug treatments on the growth rate of dozens to hundreds of individual cells within a population in order to assess drug efficacy and variability and quantify drug sensitivity or resistance9,35. Phase-shifting interferometry has also been used to track shifts in mass distribution within individual cells during mechanical stimulation36 and to study the mass accumulation and intracolony mass redistribution characteristics of human pluripotent stem cells during self-renewal and early differentiation37 (Fig. 3).
Figure 3.
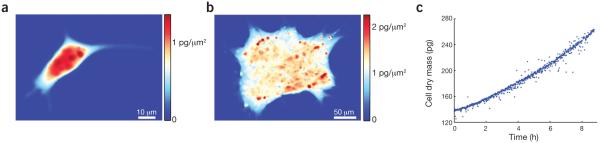
Live-cell mass quantification with interference microscopy. (a,b) Mass distributions within a single, adherent mouse L-cell fibroblast (a) and a multicellular human pluripotent stem cell colony (b) measured with phase-shifting interferometry. The color scale corresponds to mass per unit area, showing the intracellular or intracolony distribution of mass (red, high mass; blue, low mass or background level). (c) Mass distribution images captured by time-lapse interference microscopy can be integrated over the area of a cell or colony to yield mass over time data. A mass-versus-time plot is shown for a single, nonadherent mouse CH12 erythroleukemia cell measured with phase-shifting interferometry.
Diffraction-phase microscopy (DPM) is an interference microscopy method in which light passes through a phase grating and interference between light fields from the first (imaging) and zeroth (reference) diffraction patterns are used to compute the quantitative phase image from a single acquired image. Early work with this method used lasers, which induced speckle artifacts, limiting sensitivity; however, this limitation has been removed with recent work that modified the DPM system for use with white-light halogen lamps38. DPM has slightly higher reported background noise than some other methods (1.1 nm (ref. 38) vs. 0.4–0.7 nm with phase-shifting interferometry). However, this noise increase is negligible for imaging mammalian cells, which have typical phase shifts in the range of 100–400 nm. Overall, DPM is well suited for imaging biological samples and has been used to study fast membrane-fluctuation dynamics in red blood cells during morphological changes39 as well as to quantify changes in chondrocyte dry mass10. The latter work revealed multiple differentially regulated phases of chondrocyte enlargement, with the third, Igf1-dependent phase possibly responsible for most of the observed variation in skeletal elongation rate during organismal growth; the study suggests that chondrocytes may be useful as a general model of cell mass and volume regulation.
An additional interferometric method involves the use of a wavefront sensor built around a charge-coupled device (CCD) camera40. As in differential interference contrast (DIC) or Nomarski microscopy, this method, called quadriwave lateral shearing interferometry, shears light such that light passing through adjacent regions of a cell interferes with itself, creating interference patterns from which a phase distribution can be computed40. Unlike DIC, wavefront sensing uses a detector to measure phase gradients in two orthogonal directions, is optimized to reduce sensitivity to image noise after processing, and captures the phase distribution from a single image. An important advantage of wavefront sensing is that the sensor can be built around an ordinary CCD camera and is therefore easily integrated with conventional microscope hardware, allowing, for example, quantification of the refractive index of lyso-somes relative to that of other intracellular vesicles41.
An important disadvantage shared by all optical interferometric techniques is that in their raw form, the phase-shift measurements contain ambiguities that must be resolved computationally. For example, consider two pixels in an image. If both have the same apparent phase, perhaps at the brightness maximum owing to positive interference between the reference and sample arm in phase-shifting interferometry, then one cannot say on the basis of the intensity information alone whether these two pixels are perfectly in phase or out of phase by exactly a multiple of one wavelength (2π radians). This problem is particularly acute when the phase shift exceeds the wavelength of light used for imaging, as is common when cells physically overlap. Phase unwrapping is the computational process used to remove these 2π phase-shift ambiguities42 and often requires substantial computational time. Phase-unwrapping issues can be mitigated somewhat by imaging at longer wavelengths, at the cost of lower resolution.
Other challenges of interferometric imaging approaches include the requirement for image processing to segment cells and determine total cellular mass, which can be computationally intensive, and the reliance on calibration data for the determination of absolute cell dry mass (Fig. 2 and Box 2). Additionally, imaging approaches often require custom optical assemblies, which can limit laboratory adoption, although some recently developed commercial products integrate into existing microscopy systems. Live-cell imaging can damage samples via phototoxicity, which needs to be carefully monitored43. Overall, interference microscopy is well suited to studies requiring high-throughput and high-precision longitudinal measurements of single cells or irregularly shaped cell clusters.
Digital holography
A related subclass of optical interferometric methods is digital holographic microscopy (DHM), which has recently been applied for the study of live biological samples44,45. Holography is an imaging process in which the entire light field, consisting of phase and intensity, is recorded through comparison of a sample and a reference beam. In traditional holography, a stored hologram must then be illuminated to reconstruct an image of the sample. In DHM, a hologram of the sample is recorded digitally and processed computationally to produce an intensity image or a quantitative map of light-wave phase shifts in a biological sample46 (Fig. 1c). These phase-shift maps can be processed to quantify cell dry mass, as in other interferometric methods (Box 2). Cell dry-mass measurements using DHM have been used to monitor growth of U2OS osteosarcoma cells during the cell cycle21 and to provide an early indicator of cell death in primary mouse glial cells47. DHM quantitative phase measurements have also been correlated with GABAA-mediated chloride-channel conductance48, an approach that may be used as a contact-free, high-throughput method to screen for new drugs that modulate neuronal function.
Like other imaging methods, DHM can quantify the intracellular distribution of dry mass. Accordingly, it has been used for longitudinal tracking of single cells to measure intracellular transport of organelles without labeling49 and to sensitively quantify the motion of cardiomyocytes, revealing the rapid motion of cell organelles50. Because most published DHM systems are custom built, they are well suited to modifications and extensions that enable new biological questions to be addressed; as such, there is a wide variety of DHM approaches currently being explored45,51. DHM also allows for numerical focusing on different imaging planes within a sample after acquisition, as well as compensation for lens aberrations46. Single-shot DHM methods, which reconstruct the phase shift from a single image acquisition, can be used for rapid mass profiling. This enables the study of, for example, membrane fluctuations in single red blood cells in order to calculate the mechanical properties of the plasma membrane52–an approach that may be useful for developing diagnostics for sickle cell disease.
However, the need to build custom optical systems for DHM, often requiring the use of lasers, may impede widespread usage until suitable commercial alternatives are available. Unlike other methods, in DHM, phase information is generally obtained without requiring moving optical components. This means that DHM requires more involved computational processing than alternative techniques do.
Quantitative phase tomography
Tomography refers to imaging by optical or virtual sectioning through a sample, similar to a microtome blade physically cutting thin sections from a tissue sample. QPT acquires three-dimensional measurements of the phase shift of light as it passes through a biological sample53. In contrast to two-dimensional methods, which measure the optical path length and determine cell mass using the integral of the refractive index over the two-dimensional area of a cell, QPT recovers the three-dimensional refractive index distribution throughout the volume of a cell54. This distribution can then be integrated to determine cell mass (Box 2) or the mass of a subcellular fraction. QPT has been used, for example, to measure the refractive index within single HeLa cells during mitosis as an indicator of chromosome condensation and to differentiate cells using either the dry mass of their chromosomes or the ratio of chromosome to cytoplasmic dry mass55. Another study of HeLa cells, which examined subcellular properties by QPT, suggests that the characteristic whitening of precancerous cervical lesions after treatment with acetic acid is caused by scattering from an increase in the refractive index of the nucleolus, hinting at a possible mechanism of action for this cancer screening method54.
Recently, a modified, three-dimensional DHM method was demonstrated that applies the concepts used in super-resolution imaging techniques to QPM. This approach captures multiple digital holograms at slight rotations of the incident laser beam angle in order to achieve a lateral resolution of 90 nm and an axial resolution of 150 nm. This approach was used to perform label-free time-lapse imaging of synaptic contacts and remodeling between neurons as well as to generate three-dimensional refractive index maps of single E. coli cells56. In another application of super-resolution techniques to QPT, E. coli subcellular architecture was visualized57, revealing coiled structures similar to those previously found via fluorescence microscopy.
In general, QPT approaches require complex data acquisition and processing and rely on custom optical assemblies. However, their three-dimensional capabilities make these approaches very promising for studies requiring measurements at specific locations throughout the thickness of a cell or for any study requiring separate mass determinations for overlapping cells.
Other optical approaches
Additional optical approaches have been used to measure cell mass. In DIC imaging, light is split in a Wollaston prism into two polarized rays offset from each other by a small shear distance. After passing through a sample, these rays recombine in a second Wollaston prism, generating contrast based on the interference between the two recombined rays. The intensity at each point in the resulting image is proportional to the difference in phase shift between two adjacent regions of a cell separated by the known shear distance imparted by the Wollaston prism; the intensity of this image is therefore proportional to the gradient of the phase shift of light. Quantitative phase images have been obtained with modified DIC imaging58 by integrating the phase gradients in the DIC image59 or by processing DIC images with an approach based on the transport-of-intensity equation60. The transport-of-intensity method can also be applied to bright-field imaging without DIC optics and was proposed for the identification of rare circulating tumor cells, although throughput is limited by the number of acquisitions necessary to compute the phase, which in this case was 300 bright-field images61. DIC approaches use standard microscopy hardware available to most labs but are generally computationally intensive, are especially sensitive to noise fluctuations in the raw data, and may require calibration to obtain quantitative results59.
Another approach to acquire quantitative phase images that has recently been applied to biological samples is ptychography62, in which scattered light from many overlapping areas of a specimen is captured as a series of diffraction patterns. These diffraction patterns are then processed to yield a quantitative phase map of a sample. The major drawback of this approach is its slow speed, but it can scan large fields of view without requiring stitching of independently acquired images.
Measurements of UV light absorption are commonly used to quantify the amount of protein contaminating a solution of nucleic acids63. Recently, sensitive detectors have enabled quantitative absorption measurements in living mammalian cells in the deep UV range64,65. Successive images at two different wavelengths (for example, 260 and 280 nm) can be used to quantify the mass of protein and the mass of nucleic acids from the average extinction coefficients at these wavelengths. Live-cell imaging can be performed as well, within certain limits to avoid phototoxicity65. Live-cell UV absorption measurements indicate that the ratio of protein to nucleic acids is moderately consistent within individual cell lines across the cell cycle, or within cells from the same mouse embryo, although it is more highly variable among different cell lines or cells from different embryos. The genetic or epigenetic origins of this trait remain unknown but may be relevant for the regulation of cell size, which has generally been observed to correlate with nucleic acid content or chromosome ploidy66,67.
The quantity of protein or nucleic acids in fixed cells can be assessed using fluorescent dyes. Recently, an approach called ergodic rate analysis11 was used to obtain results analogous to live-cell mass measurements, albeit from measurements in fixed cells. In this approach, succinimidyl ester dye conjugation to proteins in fixed mammalian cells was used to calculate the steady-state dynamics of cell growth over the course of the cell cycle at high temporal resolution and identified a size-dependent growth regulation mechanism operating in the late G1 phase. The accuracy of the protein quantification approach was validated by QPM, and cell cycle–dependent growth-rate estimates were checked against measurements made with microfluidic resonators. Ergodic rate analysis is a flexible technique that can measure any cell characteristic that can be labeled fluorescently over the course of the cell cycle—for example, the levels of phosphoproteins—and has significant promise for elucidating the relationships among cell volume, mass and cell-cycle progression. The ergodicity requirement, however, means this approach cannot measure mass responses of single cells to discrete perturbations7,35.
Summary and future directions
Live-cell mass profiling has the potential to revolutionize our understanding of basic biological processes that control cell size and growth. It may also function as a tool for development of disease treatments, especially when coupled with a molecular understanding of cellular physiology and pathology. For example, the sensitivity of phase-shifting interferometry has been leveraged to effect a 30-fold reduction in the time required to detect the growth-rate sensitivity of HER2+ breast cancer cell lines to trastuzumab (Herceptin)35. Similarly, recent QPM work measured the growth-rate response of a breast cancer cell line to the hormone estradiol and the estrogen-receptor antagonist Faslodex68. Phase-shifting interferometry has also been used to characterize T cell–target cell interactions and target-cell killing for potential applications in cancer immunotherapy7. For clinical applications, in which the population-level response of delicate primary cells must be measured, throughput is of primary importance. Optical approaches generally have the highest throughput of the available methods (Table 1).
Broader adoption of sensitive mass-quantifying approaches will require commercial alternatives to the custom-built systems that have defined the field thus far, and a variety of systems have recently become available that implement various mass-measurement techniques. Affinity Biosensors (USA) markets the Archimedes system based on the microfluidic resonator technique27. Phasics (France) markets the SID4bio system, which implements quadriwave lateral shearing interferometry40 in a camera that adapts to most available microscopes using a C-mount camera port. Bruker (USA) sells a white-light interferometer system intended for optical profilometry, which, together with a cell culture chamber and an add-on allowing imaging through aqueous media, has been used for QPM of individual cells and cell clusters9. 4D Technology (USA) is developing QPM for biological applications by using a pixelated mask to perform phase-shifting interference measurements from single image acquisitions69. Phasefocus (UK) is selling a system based on ptychography for quantitative phase imaging of biological samples62. There are several DHM systems available through Phase Holographic Imaging (Sweden), Lyncée Tec (Switzerland), 4Deep Inwater Imaging (Canada) and Ovizio Imaging Systems (Belgium).
Future technological developments will likely focus on resolution improvement, integration with other imaging modalities and the use of quantitative phase information in new ways, as has been done in the past with extensions to the measurement of intracellular transport49,70. The development of quantitative phase imaging in living tissue would be a remarkable advance, as it would allow for cell growth quantification within whole organisms. Single-cell mass measurements with cell tracking over periods from multiple hours to days provide a unique opportunity to investigate the heritability of cell size and the heterogeneity of cell growth in response to stimuli. Some work has started to address these questions9,71, although future work should examine this further. Finally, recent work on whole-cell modeling used cell dry mass as a global readout over the cell cycle72, suggesting that cell mass measurements may play a role in validating computational modeling efforts. Overall, recent advances in live-cell mass profiling enable a variety of powerful, quantitative approaches that will continue to inform the study of fundamental processes in biology and human disease.
ACKNOWLEDGMENTS
We thank P. Bon for helpful discussions. The authors are supported by a University of California (UC) Discovery/NantWorks Bioscience Biotechnology Award (Bio07–10663), a California Institute for Regenerative Medicine (CIRM) Basic Biology 1 Award (RB1–01397), the Broad Stem Cell Research Center at UCLA Innovator Award, the US National Institutes of Health (NIH) Roadmap for Medical Research Nanomedicine Initiative (PN2EY018228), NIH grants (R01CA185189, P01GM081621, K25CA157940, R01GM073981, R01CA156674, R01CA90571) and, partially, a Translational Acceleration Grant from the Caltech-UCLA Joint Center for Translational Medicine.
Footnotes
COMPETING FINANCIAL INTERESTS
The authors declare no competing financial interests.
References
- 1.Lloyd AC. The regulation of cell size. Cell. 2013;154:1194–1205. doi: 10.1016/j.cell.2013.08.053. Recent review summarizing the current understanding of cell size control mechanisms. [DOI] [PubMed] [Google Scholar]
- 2.O’Farrell PH. In: Cell Growth: Control of Cell Size. Hall MN, Raff M, Thomas G, editors. Cold Spring Harbor Press; 2004. pp. 1–22. Ch. 1. [Google Scholar]
- 3.Tzur A, Kafri R, LeBleu VS, Lahav G, Kirschner MW. Cell growth and size homeostasis in proliferating animal cells. Science. 2009;325:167–171. doi: 10.1126/science.1174294. [DOI] [PMC free article] [PubMed] [Google Scholar]
- 4.Bryan AK, Engler A, Gulati A, Manalis SR. Continuous and long-term volume measurements with a commercial coulter counter. PLoS ONE. 2012;7:e29866. doi: 10.1371/journal.pone.0029866. [DOI] [PMC free article] [PubMed] [Google Scholar]
- 5.Mitchison JM. The growth of single cells: I. Schizosaccharomyces pombe. Exp. Cell Res. 1957;13:244–262. doi: 10.1016/0014-4827(57)90005-8. [DOI] [PubMed] [Google Scholar]
- 6.Johnston GC, Pringle JR, Hartwell LH. Coordination of growth with cell division in the yeast Saccharomyces cerevisiae. Exp. Cell Res. 1977;105:79–98. doi: 10.1016/0014-4827(77)90154-9. [DOI] [PubMed] [Google Scholar]
- 7.Zangle TA, Burnes D, Mathis C, Witte ON, Teitell MA. Quantifying biomass changes of single CD8+ T cells during antigen specific cytotoxicity. PLoS ONE. 2013;8:e68916. doi: 10.1371/journal.pone.0068916. [DOI] [PMC free article] [PubMed] [Google Scholar]
- 8.Weng Y, et al. Mass sensors with mechanical traps for weighing single cells in different fluids. Lab Chip. 2011;11:4174–4180. doi: 10.1039/c1lc20736a. [DOI] [PubMed] [Google Scholar]
- 9.Reed J, et al. Rapid, massively parallel single-cell drug response measurements via live cell interferometry. Biophys. J. 2011;101:1025–1031. doi: 10.1016/j.bpj.2011.07.022. First paper demonstrating the combination of automated microscopy systems with quantitative phase imaging to make simultaneous drug-response measurements of hundreds of cells. [DOI] [PMC free article] [PubMed] [Google Scholar]
- 10.Cooper KL, et al. Multiple phases of chondrocyte enlargement underlie differences in skeletal proportions. Nature. 2013;495:375–378. doi: 10.1038/nature11940. [DOI] [PMC free article] [PubMed] [Google Scholar]
- 11.Kafri R, et al. Dynamics extracted from fixed cells reveal feedback linking growth to cell cycle. Nature. 2013;494:480–483. doi: 10.1038/nature11897. [DOI] [PMC free article] [PubMed] [Google Scholar]
- 12.Barer R. Interference microscopy and mass determination. Nature. 1952;169:366–367. doi: 10.1038/169366b0. First use of QPM to determine the dry mass of single cells. [DOI] [PubMed] [Google Scholar]
- 13.Davies HG, Wilkins MHF. Interference microscopy and mass determination. Nature. 1952;169:541. doi: 10.1038/169541a0. [DOI] [PubMed] [Google Scholar]
- 14.Mitchison JM, Passano LM, Smith FH. An integration method for the interference microscope. Q. J. Microsc. Sci. 1956;s3-97:287–302. [Google Scholar]
- 15.Dyson J. An interferometer microscope. Proc. R. Soc. Lond. A Math. Phys. Sci. 1950;204:170–187. [Google Scholar]
- 16.Johnson BN, Mutharasan R. Biosensing using dynamic-mode cantilever sensors: a review. Biosens. Bioelectron. 2012;32:1–18. doi: 10.1016/j.bios.2011.10.054. [DOI] [PubMed] [Google Scholar]
- 17.Zicha D, Dunn GA. An image processing system for cell behaviour studies in subconfluent cultures. J. Microsc. 1995;179:11–21. [Google Scholar]
- 18.Levin GG, Kovalev AA, Minaev VL, Sukhorukov KA. Error in measuring dry cell mass with a computerized interference microscope. Meas. Tech. 2004;47:412–416. [Google Scholar]
- 19.Conlon IJ, Dunn GA, Mudge AW, Raff MC. Extracellular control of cell size. Nat. Cell Biol. 2001;3:918–921. doi: 10.1038/ncb1001-918. [DOI] [PubMed] [Google Scholar]
- 20.Conlon I, Raff M. Differences in the way a mammalian cell and yeast cells coordinate cell growth and cell-cycle progression. J. Biol. 2003;2:7. doi: 10.1186/1475-4924-2-7. [DOI] [PMC free article] [PubMed] [Google Scholar]
- 21.Mir M, et al. Optical measurement of cycle-dependent cell growth. Proc. Natl. Acad. Sci. USA. 2011;108:13124–13129. doi: 10.1073/pnas.1100506108. Combination of DHM with fluorescence reporters for tracking cell-cycle progression, demonstrating measurement of cell cycle–dependent growth rate. [DOI] [PMC free article] [PubMed] [Google Scholar]
- 22.Godin M, et al. Using buoyant mass to measure the growth of single cells. Nat. Methods. 2010;7:387–390. doi: 10.1038/nmeth.1452. [DOI] [PMC free article] [PubMed] [Google Scholar]
- 23.Son S, et al. Direct observation of mammalian cell growth and size regulation. Nat. Methods. 2012;9:910–912. doi: 10.1038/nmeth.2133. [DOI] [PMC free article] [PubMed] [Google Scholar]
- 24.Popescu G, Park K, Mir M, Bashir R. New technologies for measuring single cell mass. Lab Chip. 2014;14:646–652. doi: 10.1039/c3lc51033f. [DOI] [PubMed] [Google Scholar]
- 25.Ilic B, et al. Single cell detection with micromechanical oscillators. J. Vac. Sci. Technol. B. 2001;19:2825–2828. [Google Scholar]
- 26.Park K, et al. Measurement of adherent cell mass and growth. Proc. Natl. Acad. Sci. USA. 2010;107:20691–20696. doi: 10.1073/pnas.1011365107. [DOI] [PMC free article] [PubMed] [Google Scholar]
- 27.Burg TP, et al. Weighing of biomolecules, single cells and single nanoparticles in fluid. Nature. 2007;446:1066–1069. doi: 10.1038/nature05741. Early demonstration of the microfluidic cantilever approach, which allows for unparalleled sensitivity in mass measurements of single cells or particles. [DOI] [PubMed] [Google Scholar]
- 28.Lee J, Shen W, Payer K, Burg TP, Manalis SR. Toward attogram mass measurements in solution with suspended nanochannel resonators. Nano Lett. 2010;10:2537–2542. doi: 10.1021/nl101107u. [DOI] [PubMed] [Google Scholar]
- 29.Jorgensen P, Tyers M. How cells coordinate growth and division. Curr. Biol. 2004;14:R1014–R1027. doi: 10.1016/j.cub.2004.11.027. [DOI] [PubMed] [Google Scholar]
- 30.Bryan AK, Goranov A, Amon A, Manalis SR. Measurement of mass, density, and volume during the cell cycle of yeast. Proc. Natl. Acad. Sci. USA. 2010;107:999–1004. doi: 10.1073/pnas.0901851107. [DOI] [PMC free article] [PubMed] [Google Scholar]
- 31.Grover WH, et al. Measuring single-cell density. Proc. Natl. Acad. Sci. USA. 2011;108:10992–10996. doi: 10.1073/pnas.1104651108. [DOI] [PMC free article] [PubMed] [Google Scholar]
- 32.Ross KFA. Phase Contrast and Interference Microscopy for Cell Biologists. Edward Arnold; 1967. [Google Scholar]
- 33.Gabor D. A new microscopic principle. Nature. 1948;161:777–778. doi: 10.1038/161777a0. [DOI] [PubMed] [Google Scholar]
- 34.Iwai H, et al. Quantitative phase imaging using actively stabilized phase-shifting low-coherence interferometry. Opt. Lett. 2004;29:2399–2401. doi: 10.1364/ol.29.002399. [DOI] [PubMed] [Google Scholar]
- 35.Chun J, et al. Rapidly quantifying drug sensitivity of dispersed and clumped breast cancer cells by mass profiling. Analyst. 2012;137:5495–5498. doi: 10.1039/c2an36058f. [DOI] [PMC free article] [PubMed] [Google Scholar]
- 36.Reed J, et al. Live cell interferometry reveals cellular dynamism during force propagation. ACS Nano. 2008;2:841–846. doi: 10.1021/nn700303f. [DOI] [PMC free article] [PubMed] [Google Scholar]
- 37.Zangle TA, Chun J, Zhang J, Reed J, Teitell MA. Quantification of biomass and cell motion in human pluripotent stem cell colonies. Biophys. J. 2013;105:593–601. doi: 10.1016/j.bpj.2013.06.041. [DOI] [PMC free article] [PubMed] [Google Scholar]
- 38.Bhaduri B, Pham H, Mir M, Popescu G. Diffraction phase microscopy with white light. Opt. Lett. 2012;37:1094–1096. doi: 10.1364/OL.37.001094. [DOI] [PubMed] [Google Scholar]
- 39.Park Y, et al. Measurement of red blood cell mechanics during morphological changes. Proc. Natl. Acad. Sci. USA. 2010;107:6731–6736. doi: 10.1073/pnas.0909533107. [DOI] [PMC free article] [PubMed] [Google Scholar]
- 40.Bon P, Maucort G, Wattellier B, Monneret S. Quadriwave lateral shearing interferometry for quantitative phase microscopy of living cells. Opt. Express. 2009;17:13080–13094. doi: 10.1364/oe.17.013080. [DOI] [PubMed] [Google Scholar]
- 41.Bon P, Savatier J, Merlin M, Wattelier B, Monneret S. Optical detection and measurement of living cell morphometric features with single-shot quantitative phase microscopy. J. Biomed. Opt. 2012;17:076004. doi: 10.1117/1.JBO.17.7.076004. Application of quadriwave lateral shearing interferometry to biological samples, enabling single-shot measurement of quantitative phase images in a system that can be easily adapted to standard microscope configurations. [DOI] [PubMed] [Google Scholar]
- 42.Ghiglia DC, Pritt MD. Two-Dimensional Phase Unwrapping: Theory, Algorithms, and Software. Wiley; 1998. [Google Scholar]
- 43.Khodjakov A, Rieder CL. Imaging the division process in living tissue culture cells. Methods. 2006;38:2–16. doi: 10.1016/j.ymeth.2005.07.007. [DOI] [PMC free article] [PubMed] [Google Scholar]
- 44.Carl D, Kemper B, Wernicke G, von Bally G. Parameter-optimized digital holographic microscope for high-resolution living-cell analysis. Appl. Opt. 2004;43:6536–6544. doi: 10.1364/ao.43.006536. [DOI] [PubMed] [Google Scholar]
- 45.Mir M, Bhaduri B, Wang R, Zhu R, Popescu G. In: Progress in Optics. Wolf E, editor. Vol. 57. Elsevier; 2012. pp. 133–217. Ch. 3. [Google Scholar]
- 46.Marquet P, et al. Digital holographic microscopy: a noninvasive contrast imaging technique allowing quantitative visualization of living cells with subwavelength axial accuracy. Opt. Lett. 2005;30:468–470. doi: 10.1364/ol.30.000468. [DOI] [PubMed] [Google Scholar]
- 47.Pavillon N, et al. Early cell death detection with digital holographic microscopy. PLoS ONE. 2012;7:e30912. doi: 10.1371/journal.pone.0030912. [DOI] [PMC free article] [PubMed] [Google Scholar]
- 48.Jourdain P, et al. Simultaneous optical recording in multiple cells by digital holographic microscopy of chloride current associated to activation of the ligand-gated chloride channel GABAA receptor. PLoS ONE. 2012;7:e51041. doi: 10.1371/journal.pone.0051041. [DOI] [PMC free article] [PubMed] [Google Scholar]
- 49.Wang Z, et al. Label-free intracellular transport measured by spatial light interference microscopy. J. Biomed. Opt. 2011;16:026019. doi: 10.1117/1.3549204. [DOI] [PMC free article] [PubMed] [Google Scholar]
- 50.Shaked NT, Satterwhite LL, Bursac N, Wax A. Whole-cell analysis of live cardiomyocytes using wide-field interferometric phase microscopy. Biomed. Opt. Express. 2010;1:706–719. doi: 10.1364/BOE.1.000706. [DOI] [PMC free article] [PubMed] [Google Scholar]
- 51.Ferraro P, Wax A, Zalevsky Z. Coherent Light Microscopy. Springer; 2011. [Google Scholar]
- 52.Shaked NT, Satterwhite LL, Telen MJ, Truskey GA, Wax A. Quantitative microscopy and nanoscopy of sickle red blood cells performed by wide field digital interferometry. J. Biomed. Opt. 2011;16:030506. doi: 10.1117/1.3556717. [DOI] [PubMed] [Google Scholar]
- 53.Barty A, Nugent KA, Roberts A, Paganin D. Quantitative phase tomography. Opt. Commun. 2000;175:329–336. [Google Scholar]
- 54.Choi W, et al. Tomographic phase microscopy. Nat. Methods. 2007;4:717–719. doi: 10.1038/nmeth1078. [DOI] [PubMed] [Google Scholar]
- 55.Sung Y, Choi W, Lue N, Dasari RR, Yaqoob Z. Stain-free quantification of chromosomes in live cells using regularized tomographic phase microscopy. PLoS ONE. 2012;7:e49502. doi: 10.1371/journal.pone.0049502. [DOI] [PMC free article] [PubMed] [Google Scholar]
- 56.Cotte Y, et al. Marker-free phase nanoscopy. Nat. Photonics. 2013;7:113–117. Application of super-resolution techniques to DHM tomography, enabling precise, three-dimensional refractive index measurements within single cells. [Google Scholar]
- 57.Mir M, et al. Visualizing Escherichia coli sub-cellular structure using sparse deconvolution spatial light interference tomography. PLoS ONE. 2012;7:e39816. doi: 10.1371/journal.pone.0039816. [DOI] [PMC free article] [PubMed] [Google Scholar]
- 58.Arnison MR, Larkin KG, Sheppard CJR, Smith NI, Cogswell CJ. Linear phase imaging using differential interference contrast microscopy. J. Microsc. 2004;214:7–12. doi: 10.1111/j.0022-2720.2004.01293.x. [DOI] [PubMed] [Google Scholar]
- 59.King SV, Libertun A, Piestun R, Cogswell CJ, Preza C. Quantitative phase microscopy through differential interference imaging. J. Biomed. Opt. 2008;13:024020. doi: 10.1117/1.2907328. [DOI] [PubMed] [Google Scholar]
- 60.Kou SS, Waller L, Barbastathis G, Sheppard CJR. Transport-of-intensity approach to differential interference contrast (TI-DIC) microscopy for quantitative phase imaging. Opt. Lett. 2010;35:447–449. doi: 10.1364/OL.35.000447. [DOI] [PubMed] [Google Scholar]
- 61.Phillips KG, et al. Optical quantification of cellular mass, volume, and density of circulating tumor cells identified in an ovarian cancer patient. Front. Oncol. 2012;2:72. doi: 10.3389/fonc.2012.00072. [DOI] [PMC free article] [PubMed] [Google Scholar]
- 62.Marrison J, Raty L, Marriott P, O’Toole P. Ptychography—a label free, high-contrast imaging technique for live cells using quantitative phase information. Sci. Rep. 2013;3:2369. doi: 10.1038/srep02369. [DOI] [PMC free article] [PubMed] [Google Scholar]
- 63.Wilfinger WW, Mackey K, Chomczynski P. Effect of pH and ionic strength on the spectrophotometric assessment of nucleic acid purity. Biotechniques. 1997;22:474–476. doi: 10.2144/97223st01. 478–481. [DOI] [PubMed] [Google Scholar]
- 64.Zeskind BJ, et al. Nucleic acid and protein mass mapping by live-cell deep-ultraviolet microscopy. Nat. Methods. 2007;4:567–569. doi: 10.1038/nmeth1053. [DOI] [PubMed] [Google Scholar]
- 65.Cheung MC, et al. Intracellular protein and nucleic acid measured in eight cell types using deep-ultraviolet mass mapping. Cytometry A. 2013;83:540–551. doi: 10.1002/cyto.a.22277. [DOI] [PubMed] [Google Scholar]
- 66.Gregory TR. Coincidence, coevolution, or causation? DNA content, cell size, and the C-value enigma. Biol. Rev. Camb. Philos. Soc. 2001;76:65–101. doi: 10.1017/s1464793100005595. [DOI] [PubMed] [Google Scholar]
- 67.Schmidt EV. In: Cell Growth: Control of Cell Size. Hall MN, Raff M, Thomas G, editors. Cold Spring Harbor Press; 2004. pp. 101–137. Ch. 4. [Google Scholar]
- 68.Mir M, Bergamaschi A, Katzenellenbogen BS, Popescu G. Highly sensitive quantitative imaging for monitoring single cancer cell growth kinetics and drug response. PLoS ONE. 2014;9:e89000. doi: 10.1371/journal.pone.0089000. [DOI] [PMC free article] [PubMed] [Google Scholar]
- 69.Creath K, Goldstein G. Dynamic quantitative phase imaging for biological objects using a pixelated phase mask. Biomed. Opt. Express. 2012;3:2866–2880. doi: 10.1364/BOE.3.002866. [DOI] [PMC free article] [PubMed] [Google Scholar]
- 70.Wang Z, et al. Spatial light interference microscopy. Opt. Express. 2011;19:1016–1026. doi: 10.1364/OE.19.001016. [DOI] [PMC free article] [PubMed] [Google Scholar]
- 71.Sung Y, et al. Size homeostasis in adherent cells studied by synthetic phase microscopy. Proc. Natl. Acad. Sci. USA. 2013;110:16687–16692. doi: 10.1073/pnas.1315290110. [DOI] [PMC free article] [PubMed] [Google Scholar]
- 72.Karr JR, et al. A whole-cell computational model predicts phenotype from genotype. Cell. 2012;150:389–401. doi: 10.1016/j.cell.2012.05.044. [DOI] [PMC free article] [PubMed] [Google Scholar]
- 73.Barer R. Determination of dry mass, thickness, solid and water concentration in living cells. Nature. 1953;172:1097–1098. doi: 10.1038/1721097a0. [DOI] [PubMed] [Google Scholar]
- 74.Popescu G, et al. Optical imaging of cell mass and growth dynamics. Am. J. Physiol. Cell Physiol. 2008;295:C538–C544. doi: 10.1152/ajpcell.00121.2008. [DOI] [PMC free article] [PubMed] [Google Scholar]
- 75.Zhao H, Brown PH, Schuck P. On the distribution of protein refractive index increments. Biophys. J. 2011;100:2309–2317. doi: 10.1016/j.bpj.2011.03.004. [DOI] [PMC free article] [PubMed] [Google Scholar]
- 76.Barer R, Joseph S. Refractometry of living cells. Q. J. Microsc. Sci. 1954;s3-95:399–423. [Google Scholar]
- 77.Wen J, Arakawa T. Refractive index of proteins in aqueous sodium chloride. Anal. Biochem. 2000;280:327–329. doi: 10.1006/abio.2000.4524. [DOI] [PubMed] [Google Scholar]
- 78.Armstrong SH, Budka MJE, Morrison KC, Hasson M. Preparation and properties of serum and plasma proteins. XII. The refractive properties of the proteins of human plasma and certain purified fractions. J. Am. Chem. Soc. 1947;69:1747–1753. doi: 10.1021/ja01199a050. [DOI] [PubMed] [Google Scholar]
- 79.Barer R, Tkaczyk S. Refractive index of concentrated protein solutions. Nature. 1954;173:821–822. doi: 10.1038/173821b0. [DOI] [PubMed] [Google Scholar]
- 80.Chincholi BS, Havlik AJ, Vold RD. Specific refractive index increments of polymer systems at four wavelengths. J. Chem. Eng. Data. 1974;19:148–152. [Google Scholar]
- 81.Brown GL, McEwan MB, Pratt MI. Macromolecular weight and size of deoxypentose nucleic acids. Nature. 1955;176:161–162. doi: 10.1038/176161a0. [DOI] [PubMed] [Google Scholar]
- 82.Northrop TG, Nutter RL, Sinsheimer RL. Refractive increment of thymus nucleic acid. J. Am. Chem. Soc. 1953;75:5134–5135. [Google Scholar]
- 83.Northrop TG, Sinsheimer RL. Light scattering by tobacco mosaic virus nucleic acid. J. Chem. Phys. 1954;22:703–707. [Google Scholar]
- 84.Davies HG. In: General Cytochemical Methods. Danielli JF, editor. Academic Press; 1958. pp. 55–161. [PubMed] [Google Scholar]
- 85.Hayes WM. CRC Handbook of Chemistry and Physics. 94th CRC Press; 2013. [Google Scholar]
- 86.Erbe A, Sigel R. Tilt angle of lipid acyl chains in unilamellar vesicles determined by ellipsometric light scattering. Eur. Phys. J. E. 2007;22:303–309. doi: 10.1140/epje/e2007-00038-5. [DOI] [PubMed] [Google Scholar]
- 87.Popescu G, Ikeda T, Dasari RR, Feld MS. Diffraction phase microscopy for quantifying cell structure and dynamics. Opt. Lett. 2006;31:775–777. doi: 10.1364/ol.31.000775. [DOI] [PubMed] [Google Scholar]
- 88.Prescher JA, Bertozzi CR. Chemistry in living systems. Nat. Chem. Biol. 2005;1:13–21. doi: 10.1038/nchembio0605-13. [DOI] [PubMed] [Google Scholar]