

Abstract
Background
Self-report may not be an accurate method of determining cervical, breast and colorectal cancer screening rates due to recall, acquiescence and social desirability biases, particularly for certain sociodemographic groups. Therefore, the aims of this study were to determine the validity of self-report of cancer screening in Ontario, Canada, both for people in the general population and for socially disadvantaged groups based on immigrant status, ethnicity, education, income, language ability, self-rated health, employment status, age category (for cervical cancer screening), and gender (for fecal occult blood testing).
Methods
We linked multiple data sources for this study, including the Canadian Community Health Survey and provincial-level health databases. Using administrative data as our gold standard, we calculated validity measures for self-report (i.e. sensitivity, specificity, positive and negative likelihood ratios, positive and negative predictive values), calculated report-to-record ratios, and conducted a multivariable regression analysis to determine which characteristics were independently associated with over-reporting of screening.
Results
Specificity was less than 70% overall and for all subgroups for cervical and breast cancer screening, and sensitivity was lower than 80% overall and for all subgroups for fecal occult blood testing FOBT. Report-to-record ratios were persistently significantly greater than 1 across all cancer screening types, highest for the FOBT group: 1.246 [1.189-1.306]. Regression analyses showed no consistent patterns, but sociodemographic characteristics were associated with over-reporting for each screening type.
Conclusions
We have found that in Ontario, as in other jurisdictions, there is a pervasive tendency for people to over-report their cancer screening histories. Sociodemographic status also appears to influence over-reporting. Public health practitioners and policymakers need to be aware of the limitations of self-report and adjust their methods and interpretations accordingly.
Keywords: Self-report, Validity, Cancer screening, Socioeconomic status
Background
Screening for cervical, breast and colorectal cancer (CRC) using the Papanicolaou (Pap) test, mammography, and the fecal occult blood test (FOBT) respectively are commonly accepted practices in primary care in Canada. Because of the effectiveness of the Pap test and its widespread use, Canada currently has one of the world’s lowest annual incidence and mortality rates for invasive cervical cancer [1-3]. Mammography is associated with significant reductions in the relative risk of death from breast cancer and has long been recommended by the Canadian Task Force on Preventive Health Care [4]. Colorectal screening rates in Canada are currently low, but it has been estimated that if 70% of the eligible population participated in screening, mortality due to CRC could drop by 13-15% [5].
Despite the known benefits of screening, the literature suggests that people who are members of certain sociodemographic groups are subject to cancer screening inequities, particularly ethnoracial minorities, immigrants, people with low levels of education, people with complex medical conditions, and those of low income [6-12]. The benefits of screening combined with the apparent inequalities in screening based on social disadvantage demonstrate the need for valid methods of determining and monitoring screening rates. It is therefore concerning to consider that self-report, a commonly used method for determining screening history, may have validity issues and that people from certain sociodemographic groups might be more likely to inaccurately report cancer screening than their peers [13-16]. Under-estimating screening prevalence or over-estimating screening inequalities could lead to wasted resources, and conversely, over-estimating screening prevalence or under-estimating screening inequalities could lead to missed opportunities for improving screening. Self-report is potentially vulnerable to acquiescence bias (the tendency to give positive responses to questions when in doubt) and social desirability bias (the tendency to respond in a manner that respondents believe will be viewed favourably), and both types of bias may be more common among socially disadvantaged groups [14,16,17].
Literature from the US suggests that these biases in self-report might exist differentially, and that Hispanics and African-Americans may be more likely to over-report screening [14,15]. However, little is known about the validity of self-report of cancer screening in Canadian populations or among particular Canadian sociodemographic groups. Therefore, the objectives of this study were: i) to determine the validity of self-report of cervical, breast and CRC screening in Ontario for people in the general population, and ii) to determine the validity of self-report for socially disadvantaged groups based on: immigrant status, ethnicity, education, income, language ability, self-reported health, employment status, age category (for cervical cancer screening), and gender (for CRC screening).
Methods
Data sources
Multiple data sources were used for this study. The Canadian Community Health Survey (CCHS) is a national, biennial, cross-sectional survey conducted by Statistics Canada that collects information related to health status and health care utilization, including questions on cervical, breast, and CRC screening, as well as demographic characteristics such as visible minority status, immigrant status, language ability, education, age and gender. The CCHS data to which we had access contain responses from approximately 30,000 Ontarians (approximately 60% of Ontario respondents) per cycle who agreed to data linkage with administrative health data and whose data were able to be linked. We used data from four cycles of CCHS data (2000–2001, 2003, 2005, 2007). The Ontario Health Insurance Plan (OHIP) Claims’ Database contains claims for physician and hospital services as part of the provincial universal health insurance plan and includes approximately 95% of physician claims in the province [18]. The Canadian Institute of Health Information Discharge Abstract Database consists of fee codes and diagnostic codes claimed by Ontario physicians for hospital stays and procedures. Cytobase is Ontario’s electronic Pap test registry. Finally, the Ontario Breast Screening Program data record the date of mammogram for all women who participate in the provincial screening program. Using a unique encoded identifying number that allows individuals to be tracked through multiple databases, we linked respondents from the four cycles of CCHS with the aforementioned health databases. This study was approved by the Research Ethics Board of Sunnybrook Health Sciences Centre.
Inclusion/exclusion criteria
We created three groups in this study. Survey respondents were included if they had answered the questions about cancer screening and were eligible for cervical cancer screening (cervix group), breast cancer screening (breast group), or fecal occult blood testing (FOBT group) respectively. Cervical cancer screening eligibility consisted of being 24 to 69 years of age on the date that they completed the CCHS, being continuously eligible for health insurance coverage for the three years prior to the CCHS interview, no history of hysterectomy, and no previous diagnosis of cervical cancer. Similarly, breast cancer screening eligibility consisted of being 52 to 69 years of age on the date that they completed the CCHS, being continuously eligible for Ontario’s universal health insurance coverage for the two years prior to the CCHS interview, and no previous diagnosis of breast cancer. Women were excluded if they reported on the CCHS that they had a mammogram for diagnostic (as opposed to screening) purposes. Eligibility for screening with FOBT was defined as being 52 to 74 years of age on the date of the CCHS, being continuously eligible for health insurance coverage for the two years prior to the CCHS interview, no history of barium enema or sigmoidoscopy in the preceding five years, no history of colonoscopy in the preceding ten years, and no previous diagnosis of CRC. People were excluded if they reported on the CCHS that they had an FOBT as follow-up of a problem or follow-up of CRC treatment. Ages and time periods for each cancer screening type were determined by provincial guidelines [19-21].
Validity measures
We calculated validity measures i.e. sensitivity, specificity, positive and negative likelihood ratios, positive and negative predictive values, and simple kappa statistics for each cancer screening type. A kappa of 0.6 to 0.79 indicates substantial agreement, whereas a kappa of 0.4 to 0.59 indicates only moderate agreement [22]. Specifically, we assessed if those eligible self-reported or had a record of a Pap test within the three years prior to the CCHS, a mammogram within two years, and FOBT within the two years prior to the CCHS. A record of a test in administrative data was viewed as the gold standard against which self-report was validated. Only the latter three cycles of the CCHS asked respondents about history of FOBT.
We then calculated these validity measures for various demographic subgroups, specifically by self-perceived health (excellent, very good, good, fair, poor), household income ($30,000 or less, more than $30,000), highest education obtained (less than high school, high school or higher), mother tongue (English, non-English), immigrant status (Canadian-born, foreign-born), recent immigrant status among the foreign-born (immigrated 5 years or less from the date of interview vs. immigrated more than 5 years prior), employment status (currently employed vs. not), racial group (White, non-White), age category for the cervix group (24–52 years vs. 53–69 years), and gender for the FOBT group.
We calculated report-to-record ratios (the ratio of the proportion of women who reported a screening test during the relevant time period to the proportion of women who had a record of a screening test during that time period) and their confidence intervals for each screening group and for each subgroup within each screening group [23].
Finally, we conducted a multivariable regression analysis. We limited each screening group to those members who had no screening test during the appropriate time frame in administrative records, and then determined the adjusted relative risk of over-reporting (i.e. falsely reporting a screening test during that time frame), using the variables described above, with the exception of recency of immigration.
Results
Table 1 describes the demographics of the three screening groups. All three groups were predominantly White, Canadian-born, and at least high school graduates. The majority of women (68.2%) in the cervix group were in the younger age category. In the FOBT group, 53.3% of men were employed whereas 41.5% of women were employed.
Table 1.
Demographic characteristics of the 39027 women in the cervical cancer screening group, 15877 women in the breast cancer screening group, and 14297 people in the FOBT screening group
| Cervical group | Breast group | FOBT group | FOBT group (male) | FOBT group (female) | |||||||
|---|---|---|---|---|---|---|---|---|---|---|---|
| Response | No. | % | No. | % | No. | % | No. | % | No. | % | |
| Gender | Male | n/a | n/a | 6705 | 46.9 | 6705 | 100.0 | n/a | |||
| Female | 39027 | 100.0 | 15877 | 100.0 | 7592 | 53.1 | 7592 | 100.0 | |||
| Age | 24-52 years | 26622 | 68.2 | n/a | n/a | n/a | n/a | ||||
| 53-69 years | 12405 | 31.8 | n/a | n/a | n/a | n/a | |||||
| missing | 0.0 | ||||||||||
| Birthplace | Foreign born | 7737 | 19.8 | 3835 | 24.2 | 3547 | 24.8 | 1679 | 25.0 | 1868 | 24.6 |
| Canadian born | 31268 | 80.1 | 12030 | 75.8 | 10739 | 75.1 | 5021 | 74.9 | 5718 | 75.3 | |
| missing | 22 | 0.1 | 12 | 0.1 | 11 | 0.1 | 5 | 0.1 | 6 | 0.1 | |
| Immigrant status* | Immigrated ≤5 yrs ago | 390 | 1.0 | 42 | 0.3 | 46 | 0.3 | 20 | 0.3 | 26 | 0.3 |
| Immigrated >5 yrs ago | 7087 | 18.2 | 3700 | 23.3 | 3410 | 23.9 | 1613 | 24.1 | 1797 | 23.7 | |
| missing | 31550 | 80.8 | 12135 | 76.4 | 10841 | 75.8 | 5072 | 75.6 | 5769 | 76.0 | |
| Ethnicity | Non-White | 3509 | 9.0 | 882 | 5.6 | 820 | 5.7 | 414 | 6.2 | 406 | 5.3 |
| White | 34905 | 89.4 | 14771 | 93.0 | 13185 | 92.2 | 6148 | 91.7 | 7037 | 92.7 | |
| missing | 613 | 1.6 | 224 | 1.4 | 292 | 2.0 | 143 | 2.1 | 149 | 2.0 | |
| Education status | Less than high school | 4909 | 12.6 | 3852 | 24.3 | 3546 | 24.8 | 1685 | 25.1 | 1861 | 24.5 |
| High school or higher | 33939 | 87.0 | 11928 | 75.1 | 10661 | 74.6 | 4974 | 74.2 | 5687 | 74.9 | |
| missing | 179 | 0.5 | 97 | 0.6 | 90 | 0.6 | 46 | 0.7 | 44 | 0.6 | |
| Employment | Not employed | 12159 | 31.2 | 8875 | 55.9 | 7557 | 52.9 | 3124 | 46.6 | 4433 | 58.4 |
| Employed | 26832 | 68.8 | 6986 | 44.0 | 6720 | 47.0 | 3572 | 53.3 | 3148 | 41.5 | |
| missing | 36 | 0.1 | 16 | 0.1 | 20 | 0.1 | 9 | 0.1 | 11 | 0.1 | |
| Mother tongue | Non-English | 8849 | 22.7 | 3831 | 24.1 | 3561 | 24.9 | 1707 | 25.5 | 1854 | 24.4 |
| English | 30151 | 77.3 | 12035 | 75.8 | 10722 | 75.0 | 4991 | 74.4 | 5731 | 75.5 | |
| missing | 27 | 0.1 | 11 | 0.1 | 14 | 0.1 | 7 | 0.1 | 7 | 0.1 | |
| Household income | $30,000 or less | 19692 | 50.5 | 9129 | 57.5 | 6606 | 46.2 | 2224 | 33.2 | 4382 | 57.7 |
| More than $30,000 | 16838 | 43.1 | 5197 | 32.7 | 6456 | 45.2 | 4008 | 59.8 | 2448 | 32.2 | |
| missing | 2497 | 6.4 | 1551 | 9.8 | 1235 | 8.6 | 473 | 7.1 | 762 | 10.0 | |
| Self-perceived health | Poor | 1078 | 2.8 | 757 | 4.8 | 625 | 4.4 | 316 | 4.7 | 309 | 4.1 |
| Fair | 3112 | 8.0 | 2066 | 13.0 | 1759 | 12.3 | 868 | 12.9 | 891 | 11.7 | |
| Good | 10043 | 25.7 | 4595 | 28.9 | 4242 | 29.7 | 2030 | 30.3 | 2212 | 29.1 | |
| Very Good | 15227 | 39.0 | 5519 | 34.8 | 5030 | 35.2 | 2317 | 34.6 | 2713 | 35.7 | |
| Excellent | 9555 | 24.5 | 2933 | 18.5 | 2630 | 18.4 | 1166 | 17.4 | 1464 | 19.3 | |
| missing | 12 | 0.0 | 7 | 0.0 | 11 | 0.1 | 8 | 0.1 | 3 | 0.0 | |
| Overall | 39027 | 100.0 | 15877 | 100.0 | 14297 | 100.0 | 6705 | 100.0 | 7592 | 100.0 | |
*Among those who were foreign-born.
The measures of validity of self-report for the three groups are reported in Table 2. Sensitivity was overall quite high for the cervix (96.5% [95% confidence interval 96.3-96.7%]) and breast (96.6% [96.3-97.0%]) groups, but was noticeably lower for the FOBT group (77.4% [75.7-79.0%]). Specificity was lowest for the cervix group (49.5% [48.6-50.5%]) and highest for the FOBT group (89.8% [89.2-90.3%]). The FOBT group had the lowest overall positive predictive value (62.1% [60.4-63.8%] and highest overall negative predictive value (94.8% [94.4-95.2%]. The highest kappa statistic value was for women in the breast group who reported excellent self-perceived health (0.677) and the lowest was for women in the cervix group who were foreign-born (0.505).
Table 2.
Measures of validity of self-report for cervical cancer screening, breast cancer screening, and fecal occult blood testing, using administrative data as the gold standard
| Sensitivity (%) | Specificity (%) | Positive predictive value (%) | Negative predictive value (%) | Kappa statistic | |
|---|---|---|---|---|---|
| Cervix group | |||||
| Overall | 96.5 (96.3-96.7) | 49.5 (48.6-50.5) | 82.7 (82.3-83.1) | 84.9 (84.0-85.8) | 0.526 |
| AGE | |||||
| 24-52 years | 96.8 (96.6-97.1) | 46.6 (45.4-47.8) | 84.4 (83.9-84.8) | 83.1 (81.9-84.3) | 0.508 |
| 53-69 years | 95.6 (95.2-96.1) | 54.0 (52.5-55.5) | 78.7 (77.9-79.5) | 87.4 (86.2-88.7) | 0.542 |
| Birthplace | |||||
| Canadian-born | 97.3 (97.1-97.5) | 48.5 (47.5-49.6) | 82.9 (82.4-83.3) | 87.7 (86.7-88.6) | 0.531 |
| Foreign-born | 92.9 (92.2-93.6) | 53.3 (51.3-55.3) | 81.9 (80.9-82.8) | 76.8 (74.8-78.8) | 0.505 |
| Immigrant Status* | |||||
| Immigrated >5 yrs ago | 93.4 (92.7-94.1) | 52.8 (50.7-54.9) | 81.6 (80.6-82.6) | 78.0 (75.9-80.1) | 0.507 |
| Immigrated ≤5 yrs ago | 83.8 (79.4-88.1) | 68.1 (59.6-76.7) | 86.6 (82.5-90.6) | 63.1 (54.6-71.7) | 0.507 |
| Ethnicity | |||||
| White | 97.1 (96.9-97.3) | 48.6 (47.6-49.6) | 82.6 (82.2-83.1) | 86.8 (85.9-87.7) | 0.527 |
| Non-white | 90.7 (89.6-91.9) | 57.4 (54.5-60.4) | 83.2 (81.8-84.6) | 72.7 (69.6-75.7) | 0.512 |
| Education Status | |||||
| High school or higher | 96.8 (96.6-97.1) | 47.9 (46.9-49.0) | 83.8 (83.3-84.2) | 84.5 (83.5-85.5) | 0.520 |
| Less than high school | 93.3 (92.4-94.2) | 56.6 (54.5-58.8) | 74.1 (72.6-75.5) | 86.4 (84.6-88.2) | 0.522 |
| Employment | |||||
| Employed | 97.1 (96.9-97.4) | 47.1 (45.9-48.3) | 84.2 (83.7-84.6) | 85.1 (83.9-86.2) | 0.518 |
| Not employed | 94.8 (94.3-95.3) | 53.5 (52.0-55.0) | 79.1 (78.3-79.9) | 84.7 (83.4-86.1) | 0.528 |
| Mother Tongue | |||||
| English | 97.4 (97.1-97.6) | 48.0 (47.0-49.1) | 82.8 (82.3-83.2) | 87.6 (86.7-88.6) | 0.526 |
| Non-English | 93.4 (92.8-94.0) | 54.3 (52.4-56.1) | 82.3 (81.4-83.2) | 78.3 (76.4-80.2) | 0.522 |
| Household Income | |||||
| More than $30,000 | 97.6 (97.3-97.8) | 45.9 (44.4-47.5) | 85.3 (84.7-85.9) | 85.4 (84.0-86.9) | 0.517 |
| $30,000 or less | 95.6 (95.3-96.0) | 51.1 (49.9-52.3) | 80.5 (79.8-81.1) | 84.8 (83.6-85.9) | 0.522 |
| Self-Perceived Health | |||||
| Excellent | 97.1 (96.8-97.4) | 47.7 (45.7-49.7) | 85.0 (84.2-85.8) | 84.0 (82.1-86.0) | 0.523 |
| Very good | 97.1 (96.8-97.4) | 47.1 (45.5-48.6) | 83.7 (83.0-84.3) | 85.4 (83.9-86.9) | 0.516 |
| Good | 95.5 (95.0-96.0) | 51.4 (49.7-53.2) | 81.3 (80.5-82.2) | 83.9 (82.2-85.5) | 0.525 |
| Fair | 94.9 (93.9-95.9) | 54.3 (51.5-57.1) | 76.8 (75.1-78.5) | 86.9 (84.5-89.3) | 0.529 |
| Poor | 93.8 (91.9-95.6) | 55.5 (50.9-60.1) | 74.3 (71.3-77.4) | 86.6 (82.7-90.5) | 0.518 |
| Breast group | |||||
| Overall | 96.6 (96.3-97.0) | 64.3 (63.1-65.5) | 82.1 (81.4-82.8) | 91.8 (91.0-92.6) | 0.649 |
| Birthplace | |||||
| Canadian-born | 96.8 (96.4-97.2) | 64.9 (63.4-66.3) | 82.5 (81.8-83.3) | 92.1 (91.2-93.1) | 0.657 |
| Foreign-born | 96.1 (95.3-96.9) | 62.7 (60.2-65.1) | 80.7 (79.2-82.1) | 90.9 (89.1-92.7) | 0.625 |
| Immigrant Status* | |||||
| Immigrated >5 yrs ago | 96.2 (95.4-97.0) | 62.7 (60.2-65.3) | 80.9 (79.4-82.3) | 91.0 (89.2-92.8) | 0.628 |
| Immigrated ≤5 yrs ago | 89.5 (75.7-100.0) | 69.6 (50.8-88.4) | 70.8 (52.6-89.0) | 88.9 (74.4-100.0) | 0.578 |
| Ethnicity | |||||
| White | 96.7 (96.3-97.1) | 64.3 (63.1-65.6) | 82.3 (81.5-83.0) | 92.0 (91.1-92.8) | 0.651 |
| Non-white | 94.6 (92.7-96.5) | 62.1 (57.0-67.2) | 79.7 (76.6-82.8) | 88.0 (83.9-92.1) | 0.599 |
| Education status | |||||
| More than high school | 96.9 (96.5-97.2) | 63.4 (62.0-64.9) | 83.1 (82.4-83.9) | 91.6 (90.5-92.6) | 0.649 |
| High school or less | 95.8 (94.9-96.6) | 66.4 (64.2-68.7) | 78.6 (77.0-80.1) | 92.4 (90.9-93.9) | 0.642 |
| Employment | |||||
| Employed | 96.6 (96.0-97.1) | 63.6 (61.8-65.4) | 81.5 (80.5-82.6) | 91.8 (90.5-93.1) | 0.641 |
| Not employed | 96.6 (96.2-97.1) | 64.9 (63.2-66.5) | 82.5 (81.6-83.5) | 91.8 (90.7-92.9) | 0.655 |
| Mother Tongue | |||||
| English | 96.7 (96.3-97.1) | 64.5 (63.1-66.0) | 82.5 (81.8-83.3) | 91.9 (91.0-92.9) | 0.654 |
| Non-English | 96.2 (95.4-97.0) | 63.7 (61.2-66.1) | 80.7 (79.2-82.1) | 91.4 (89.7-93.1) | 0.634 |
| Household Income | |||||
| More than $30,000 | 97.4 (96.9-97.9) | 60.4 (58.1-62.7) | 83.1 (81.9-84.2) | 92.1 (90.5-93.6) | 0.632 |
| $30,000 or less | 96.1 (95.6-96.6) | 66.3 (64.7-67.8) | 81.2 (80.3-82.2) | 91.8 (90.8-92.9) | 0.655 |
| Self-Perceived Health | |||||
| Excellent | 97.1 (96.3-97.8) | 65.9 (63.0-68.9) | 84.6 (83.1-86.1) | 92.2 (90.2-94.2) | 0.677 |
| Very good | 96.8 (96.3-97.4) | 63.3 (61.1-65.5) | 84.3 (83.2-85.4) | 90.8 (89.2-92.4) | 0.651 |
| Good | 96.4 (95.7-97.1) | 63.9 (61.6-66.1) | 81.3 (80.0-82.6) | 91.6 (90.1-93.2) | 0.640 |
| Fair | 96.4 (95.3-97.5) | 64.9 (61.8-68.0) | 77.4 (75.2-79.5) | 93.6 (91.7-95.5) | 0.632 |
| Poor | 93.8 (91.2-96.3) | 65.6 (61.0-70.2) | 70.4 (66.3-74.6) | 92.3 (89.3-95.4) | 0.582 |
| FOBT group | |||||
| Overall | 77.4 (75.7-79.0) | 89.8 (89.2-90.3) | 62.1 (60.4-63.8) | 94.8 (94.4-95.2) | 0.612 |
| Gender | |||||
| Female | 77.6 (75.4-79.7) | 90.7 (90.0-91.5) | 66.1 (63.8-68.4) | 94.5 (94.0-95.1) | 0.640 |
| Male | 77.1 (74.6-79.6) | 88.7 (87.8-89.5) | 57.5 (55.0-60.1) | 95.1 (94.5-95.7) | 0.579 |
| Birthplace | |||||
| Canadian-born | 78.3 (76.4-80.2) | 89.7 (89.0-90.3) | 61.4 (59.5-63.4) | 95.2 (94.7-95.6) | 0.613 |
| Foreign-born | 74.8 (71.5-78.0) | 90.0 (88.9-91.1) | 64.0 (60.7-67.3) | 93.7 (92.8-94.7) | 0.609 |
| Immigrant Status* | |||||
| Immigrated >5 yrs ago | 75.3 (72.0-78.7) | 90.1 (89.0-91.2) | 64.4 (61.0-67.8) | 93.9 (93.0-94.8) | 0.615 |
| Immigrated ≤5 yrs ago | 54.5 (25.1-84.0) | 88.6 (78.0-99.1) | 60.0 (29.6-90.4) | 86.1 (74.8-97.4) | 0.445 |
| Ethnicity | |||||
| White | 77.4 (75.7-79.1) | 89.9 (89.3-90.4) | 62.3 (60.5-64.1) | 94.8 (94.4-95.3) | 0.615 |
| Non-white | 73.5 (66.5-80.5) | 89.4 (87.1-91.7) | 61.0 (53.9-68.1) | 93.7 (91.8-95.6) | 0.583 |
| Education Status | |||||
| More than high school | 77.7 (75.9-79.5) | 89.4 (88.7-90.0) | 62.9 (61.0-64.8) | 94.5 (94.0-95.0) | 0.615 |
| High school or less | 75.4 (71.8-79.1) | 90.8 (89.8-91.8) | 59.0 (55.3-62.7) | 95.5 (94.7-96.2) | 0.594 |
| Employment | |||||
| Employed | 76.7 (74.1-79.2) | 90.7 (89.9-91.4) | 61.2 (58.6-63.7) | 95.3 (94.7-95.9) | 0.611 |
| Not employed | 77.8 (75.7-80.0) | 88.9 (88.1-89.7) | 62.8 (60.5-65.0) | 94.3 (93.7-94.9) | 0.611 |
| Mother Tongue | |||||
| English | 79.2 (77.3-81.0) | 89.4 (88.8-90.1) | 61.6 (59.7-63.5) | 95.2 (94.8-95.7) | 0.617 |
| Non-English | 72.1 (68.7-75.5) | 90.7 (89.6-91.7) | 63.6 (60.1-67.0) | 93.5 (92.6-94.4) | 0.597 |
| Household Income | |||||
| More than $30,000 | 78.3 (76.0-80.7) | 89.1 (88.2-89.9) | 61.6 (59.1-64.0) | 94.8 (94.2-95.4) | 0.610 |
| $30,000 or less | 76.0 (73.5-78.5) | 90.2 (89.4-91.0) | 61.8 (59.2-64.3) | 94.8 (94.2-95.4) | 0.607 |
| Self-Perceived Health | |||||
| Excellent | 79.4 (75.8-82.9) | 89.6 (88.3-90.9) | 63.7 (59.9-67.5) | 94.9 (94.0-95.9) | 0.630 |
| Very good | 79.2 (76.7-81.7) | 89.3 (88.3-90.2) | 65.0 (62.4-67.7) | 94.4 (93.7-95.2) | 0.633 |
| Good | 75.9 (72.8-79.1) | 90.7 (89.8-91.7) | 62.6 (59.4-65.8) | 94.9 (94.1-95.6) | 0.615 |
| Fair | 73.3 (67.8-78.8) | 89.7 (88.2-91.3) | 54.3 (49.0-59.6) | 95.3 (94.2-96.4) | 0.545 |
| Poor | 65.7 (54.6-76.8) | 87.9 (85.2-90.6) | 40.7 (31.6-49.8) | 95.3 (93.5-97.1) | 0.423 |
*Among those who were foreign-born.
Figures 1, 2 and 3 describe the report-to-record ratios for each screening group and demographic subgroup. Ratios were persistently significantly greater than 1, suggesting pervasive over-reporting, except for more recent immigrants where confidence intervals crossed unity for each screening type. For the cervix group (Figure 1), women who were older, less educated, and of fair or poor self-perceived health had report-to-record ratios that were higher than the overall estimate, and women who were younger, foreign-born, recent immigrants, non-White, and non-English speaking had ratios lower than the overall estimate. For the breast group (Figure 2), women of poor self-perceived health had a report-to-record ratio higher than the range of the overall estimate. For the FOBT group (Figure 3), no group had a report-to-record ratio outside of the range of the overall estimate. The FOBT group (Figure 3) had the highest overall report-to-record ratio (1.246 [1.189-1.306]) of the three groups.
Figure 1.
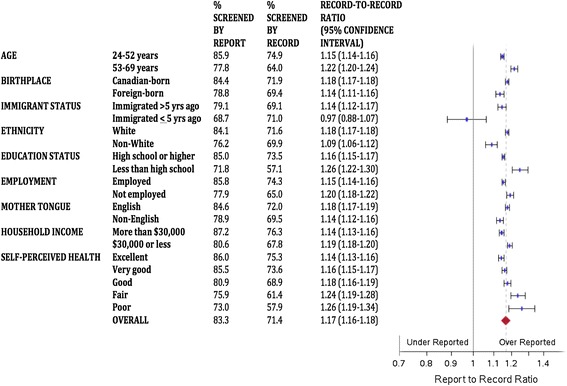
Report-to-record ratios for cervical cancer screening.
Figure 2.
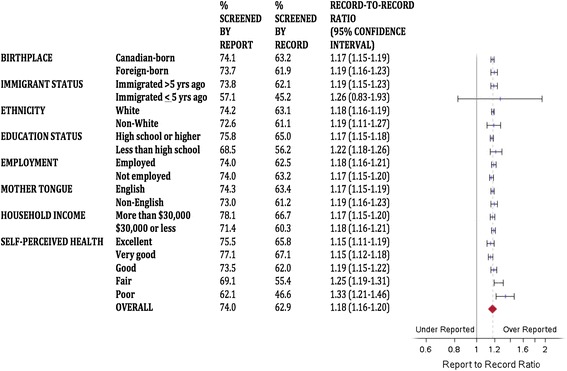
Report-to-record ratios for breast cancer screening.
Figure 3.
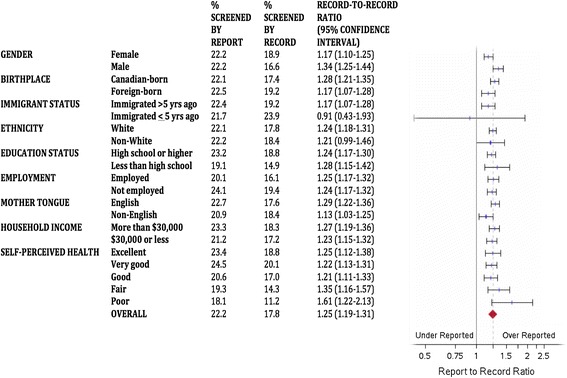
Report-to-record ratios for fecal occult blood testing.
In multivariable regression analyses, women who were younger, White, higher educated, English native speakers, and of higher income were less likely to over-report cervical cancer screening. Higher income women were less likely to over-report breast cancer screening. Men were less likely to over-report FOBT use, whereas employed people were more likely to over-report FOBT use (adjusted relative risk 1.18 [95% confidence interval 1.03-1.36] (Table 3)).
Table 3.
Adjusted relative risks [with 95% confidence intervals] of over-reporting, defined as reporting a Pap test in the past 3 years (cervix group), a mammogram in the past 2 years (breast group), and a fecal occult blood test in the past 2 years (FOBT group), but with no record of same in administrative data
| Cervix group | Breast group | FOBT group | ||
|---|---|---|---|---|
| Age | 24-52 years vs. 53–69 years | 0.88 [0.84-0.92]* | n/a | n/a |
| Gender | Male vs. female | n/a | n/a | 0.81 [0.71-0.92]* |
| Birthplace | Canadian-born vs. foreign-born | 0.99 [0.94-1.06] | 1.06 [0.96-1.16] | 1.00 [0.84-1.19] |
| Ethnicity | White vs. non-White | 0.85 [0.78-0.92]* | 1.00 [0.85-1.18] | 1.17 [0.90-1.53] |
| Education Status | High school or higher vs. less than high school | 0.89 [0.84-0.94]* | 0.95 [0.87-1.03] | 0.89 [0.76-1.05] |
| Employment | Employed vs. not employed | 0.98 [0.94-1.03] | 1.02 [0.94-1.10] | 1.18 [1.03-1.36]* |
| Mother Tongue | English vs. non-English | 0.92 [0.87-0.97]* | 1.00 [0.91-1.10] | 0.91 [0.77-1.08] |
| Household Income | More than $30,000 vs. $30,000 or less | 0.96 [0.92-1.00]* | 0.84 [0.77-0.91]* | 0.89 [0.77-1.03] |
| Self-Perceived Health | Excellent vs. poor | 1.02 [0.97-1.07] | 1.10 [0.99-1.23] | 0.99 [0.83-1.17] |
| Very good vs. poor | 0.97 [0.92-1.02] | 1.09 [0.97-1.22] | 0.84 [0.69-1.01] | |
| Good vs. poor | 0.94 [0.87-1.02] | 1.07 [0.94-1.23] | 0.90 [0.71-1.14] | |
| Fair vs. poor | 0.93 [0.82-1.04] | 1.08 [0.91-1.29] | 1.13 [0.83-1.54] |
Adjusted for variables listed in table.
*Statistically significant result.
Discussion
In this study of the validity of self-report of up-to-date cancer screening among Ontarians, using administrative health data as our gold standard, we found that there is cause for concern when using self-report as the sole method of quantifying cancer screening rates. Specificity was less than 70% overall and for all subgroups for cervical and breast cancer screening and sensitivity was lower than 80% overall and for all subgroups for screening with FOBT. Report-to-record ratios were pervasively significantly greater than 1, indicating that over-reporting of cancer screening is common in Ontario.
Self-report of FOBT stood out among the three cancer screening types for having the highest report-to-record ratios, the lowest sensitivity and positive predictive values, and the highest specificity and negative predictive values. Taken together, these results suggest that false positives and true negatives are both quite high for FOBT use, with true negatives predominating. The high false positive rate implies that estimates of FOBT utilization based on self-report could be particularly erroneous and should be avoided where possible, and our finding of high true negatives is in line with the known low prevalence of CRC screening by FOBT in Ontario [24].
There was no clear pattern suggesting that Ontarians with social disadvantage were consistently more likely to over-report than their more advantaged peers. For example, in regression analyses, women who were White, higher educated, English native speakers and of higher income were less likely to over-report cervical cancer screening in Ontario than their respective counterparts, but this did not hold true for the other screening types. The higher sample size in the cervix group may have driven the higher number of significant results for cervical cancer screening than for the other two forms of screening. However, we have demonstrated that sociodemographic characteristics do appear to play a role in Ontario populations and should be considered when examining cancer screening gaps based on self-reported data.
Report-to-record ratios indicated that people of poorer self-rated health tended to be more likely to over-report up-to-date screening than those of better self-rated health for both cervical and breast cancer screening. The reason for this finding is unclear, but it has been reported elsewhere in the literature [25]. It may reflect more frequent contact with the health care system for people of poorer self-rated health, and therefore a more difficult time differentiating which medical tests and procedures one has received. Distinct event are easier for patients to remember, and screening may be less likely to be a distinct event for patients of worse health status [26].
Our findings have implications for public health researchers, practitioners and policymakers who are interested in cancer screening in Ontario. It is apparent that self-report of cancer screening is not the most accurate way to determine cervical, breast and colorectal cancer screening rates in Ontario, and will over-estimate screening rates. Where possible, the use of more objective data should be encouraged. Where not possible, the pervasive over-reporting that we demonstrated should be remembered and considered. The results we have presented could be used in the Ontario or Canadian setting as correction factors to determine more accurate screening rates [27]. Also, our findings suggest that there are opportunities to increase patients’ basic knowledge about screening, and their understanding of which screening tests they have and have not received. Many women mistake any pelvic examination for a Pap test [28-30], and it is feasible that patients may similarly mistake digital rectal exams for FOBT screening [31]. Better provider-patient communication and patient education may improve the accuracy of self-report, and may be of particular importance for disadvantaged populations [14,28].
Few Canadian studies have examined the validity of self-report of cancer screening for cervical, breast, and colorectal cancer. In their 2009 study, Wang et al. demonstrated that rates in Ontario administrative data were consistently lower for breast and cervical cancer screening and for influenza vaccination than rates in self-reported CCHS data [32]. Khoja et al. compared self-report of any form of CRC screening to medical records from physicians’ offices and found a kappa of 0.66. They reported that it was common for study participants to believe a test had occurred more recently than records showed [33]. Fehringer et al. compared cervical cancer screening rates in Cytobase, Ontario’s Pap test registry, with self-reported CCHS rates across 37 public health units in the province and found that Cytobase rates were consistently lower, concluding this was likely due to over-reporting [34]. Walker et al. found that women at high familial risk of breast cancer accurately reported mammogram use within the previous 12 months [35]; however, Larouche et al. assessed validity of self-reported mammography among women who had undergone breast cancer-specific genetic testing and concluded that self-report overestimates mammography use in this population [36].
This study has several limitations. First, administrative data are not a perfect gold standard [13,32]. For example, Pap tests performed and interpreted solely within hospitals in Ontario may not be captured by either administrative data or by Cytobase. However, the number of screening Pap tests to which this would apply is expected to be quite small. As well, we used a variety of databases (OHIP, OBSP, Cytobase) to find objective records of screening. Second, the CCHS is voluntary. Therefore, CCHS respondents, particularly those who agreed to have their survey answers linked to administrative health data, may systematically differ from the general population. However, they are likely to be representative of any sample who would agree to self-report cancer screening. Third, the CCHS has some missing data, particularly around income levels. Although these missing data affect the power of our results, they are unlikely to affect the veracity of our findings. Finally, we dichotomized many of the characteristics that we examined, such as race, recent immigrant status, and education, which may not have provided enough detail to uncover differences. For example, ethnicity has been reported as a factor affecting self-report in the US literature, with African-Americans and Hispanics highlighted [14,15]. Although we did examine racial group in this study, we only looked at White vs. non-White. However, sample size often would not allow for more detailed categorization.
Conclusions
In this work, we have found that in Ontario as in other jurisdictions, there is a pervasive tendency for people to over-report their cancer screening histories. Sociodemographic status also appears to influence the likelihood of over-reporting screening. Public health practitioners and policymakers need to be aware of the limitations of self-report and adjust their methods and interpretations accordingly.
Acknowledgements
This study was funded by the Ontario Ministry of Health and Long-Term Care (MOHLTC) as an Applied Health Research Question. This study was also supported by the Institute for Clinical Evaluative Sciences (ICES), which is funded by an annual grant from the MOHLTC. The opinions, results and conclusions reported in this paper are those of the authors and are independent from the funding sources. No endorsement by ICES or the Ontario MOHLTC is intended or should be inferred. At the time of this study, Aisha Lofters was supported by a Canadian Institutes of Health Research Strategic Training Fellowship, Transdisciplinary Understanding and Training on Research - Primary Health Care Program (TUTOR-PHC). Aisha Lofters is supported by a Canadian Cancer Society Career Development Award in Cancer Prevention (grant #702114). The authors also thank Dr. David Mowat for his input and Diane Green for providing technical and analytic support.
Footnotes
Competing interests
The authors declare that they have no competing interests.
Authors’ contributions
AL took primary responsibility for drafting and revising the manuscript. She gave final approval of the version to be published. She accepts full responsibility for the work and the conduct of the study, had access to the data, and controlled the decision to publish. MV provided advice and direction for the study design and contributed to data analysis and interpretation. She revised the manuscript critically for important intellectual content. RG took primary responsibility for the conception of the study. He provided advice and direction for the study design, and data acquisition, analysis and interpretation. He revised the manuscript critically for important intellectual content. All authors read and approved the final manuscript.
Contributor Information
Aisha Lofters, Email: Aisha.lofters@utoronto.ca.
Mandana Vahabi, Email: mvahabi@ryerson.ca.
Richard H Glazier, Email: Rick.glazier@ices.on.ca.
References
- 1.Duarte-Franco E, Franco EL. Cancer of the uterine cervix. BMC Womens Health. 2004;4(Suppl 1):S13. doi: 10.1186/1472-6874-4-S1-S13. [DOI] [PMC free article] [PubMed] [Google Scholar]
- 2.Franco EL, Duarte-Franco E, Ferenczy A. Cervical cancer: epidemiology, prevention and the role of human papillomavirus infection. CMAJ. 2001;164(7):1017–25. [PMC free article] [PubMed] [Google Scholar]
- 3.Canadian Cancer Society/National Cancer Institute of Canada. Canadian Cancer Statistics2006, Toronto, Canada, 2006.
- 4.Canadian Task Force on Preventive Health C. Tonelli M, Connor Gorber S, Joffres M, Dickinson J, Singh H, et al. Recommendations on screening for breast cancer in average-risk women aged 40–74 years. CMAJ. 2011;183(17):1991–2001. doi: 10.1503/cmaj.110334. [DOI] [PMC free article] [PubMed] [Google Scholar]
- 5.Wilkins K, Shields M. Colorectal cancer testing in Canada--2008. Health reports / Statistics Canada, Canadian Centre for Health Information = Rapports sur la sante / Statistique Canada, Centre canadien d’information sur la sante. 2009;20(3):21–30. [PubMed] [Google Scholar]
- 6.Lofters AK, Hwang SW, Moineddin R, Glazier RH. Cervical cancer screening among urban immigrants by region of origin: a population-based cohort study. Prev Med. 2010;51(6):509–16. doi: 10.1016/j.ypmed.2010.09.014. [DOI] [PubMed] [Google Scholar]
- 7.Finney MF, Tumiel-Berhalter LM, Fox C, Jaen CR. Breast and cervical cancer screening for Puerto Ricans, African Americans, and non-Hispanic whites attending inner-city family practice centers. Ethn Dis. 2006;16(4):994–1000. [PubMed] [Google Scholar]
- 8.Carrasquillo O, Pati S. The role of health insurance on Pap smear and mammography utilization by immigrants living in the United States. Prev Med. 2004;39(5):943–50. doi: 10.1016/j.ypmed.2004.03.033. [DOI] [PubMed] [Google Scholar]
- 9.Maxwell CJ, Bancej CM, Snider J, Vik SA. Factors important in promoting cervical cancer screening among Canadian women: findings from the 1996–97 National Population Health Survey (NPHS) Canadian journal of public health = Revue canadienne de sante publique. 2001;92(2):127–33. doi: 10.1007/BF03404946. [DOI] [PMC free article] [PubMed] [Google Scholar]
- 10.Spadea T, Bellini S, Kunst A, Stirbu I, Costa G. The impact of interventions to improve attendance in female cancer screening among lower socioeconomic groups: a review. Prev Med. 2010;50(4):159–64. doi: 10.1016/j.ypmed.2010.01.007. [DOI] [PubMed] [Google Scholar]
- 11.Cobigo V, Ouellette-Kuntz H, Balogh R, Leung F, Lin E, Lunsky Y. Are cervical and breast cancer screening programmes equitable? The case of women with intellectual and developmental disabilities. J Intellectual Disability Res: JIDR. 2013;57(5):478–88. doi: 10.1111/jir.12035. [DOI] [PubMed] [Google Scholar]
- 12.Honein-Abouhaidar GN, Baxter NN, Moineddin R, Urbach DR, Rabeneck L, Bierman AS. Trends and inequities in colorectal cancer screening participation in Ontario, Canada, 2005–2011. Cancer epidemiology. 2013;37(6):946–56. doi: 10.1016/j.canep.2013.04.007. [DOI] [PubMed] [Google Scholar]
- 13.Howland J, Sakellariou C. Wage discrimination, occupational segregation and visible minorities in Canada. Appl Econ. 1993;25(11):1413–22. doi: 10.1080/00036849300000146. [DOI] [Google Scholar]
- 14.Burgess DJ, Powell AA, Griffin JM, Partin MR. Race and the validity of self-reported cancer screening behaviors: development of a conceptual model. Prev Med. 2009;48(2):99–107. doi: 10.1016/j.ypmed.2008.11.014. [DOI] [PubMed] [Google Scholar]
- 15.Rauscher GH, Johnson TP, Cho YI, Walk JA. Accuracy of self-reported cancer-screening histories: a meta-analysis. Cancer Epidemiol Biomarkers Prev. 2008;17(4):748–57. doi: 10.1158/1055-9965.EPI-07-2629. [DOI] [PubMed] [Google Scholar]
- 16.Vernon SW, Abotchie PN, McQueen A, White A, Eberth JM, Coan SP. Is the accuracy of self-reported colorectal cancer screening associated with social desirability? Cancer Epidemiol Biomarkers Prev. 2012;21(1):61–5. doi: 10.1158/1055-9965.EPI-11-0552. [DOI] [PMC free article] [PubMed] [Google Scholar]
- 17.Fiscella K, Holt K, Meldrum S, Franks P. Disparities in preventive procedures: comparisons of self-report and Medicare claims data. BMC Health Serv Res. 2006;6:122. doi: 10.1186/1472-6963-6-122. [DOI] [PMC free article] [PubMed] [Google Scholar]
- 18.Chan B, Anderson GM. Trends in Physician Fee-for-service Billing Patterns. In: Goel V, Williams JI, Anderson GM, Blackstein-Hirsch P, Fooks C, Naylor CD, editors. Patterns of Health Care in Ontario The ICES Practice Atlas. 2. Ottawa: Canadian Medical Association; 1996. [Google Scholar]
- 19.Cervical Screening - CCO. Cancer Care Ontario; 2012 [October 28, 2013]; Available from: http://www.cancercare.on.ca/pcs/screening/cervscreening/.
- 20.Ontario Breast Screening Program . 20th Anniversary Report 1990–2010. Toronto: Cancer Care Ontario; 2010. [Google Scholar]
- 21.What is the ColonCancerCheck program?. Ministy of Health and Long-Term Care; [updated November 6, 2012]; Available from: http://www.health.gov.on.ca/en/public/programs/coloncancercheck/program.aspx.
- 22.McGinn T, Wyer PC, Newman TB, Keitz S, Leipzig R, For GG, et al. Tips for learners of evidence-based medicine: 3. Measures of observer variability (kappa statistic) CMAJ. 2004;171(11):1369–73. doi: 10.1503/cmaj.1031981. [DOI] [PMC free article] [PubMed] [Google Scholar]
- 23.Smith TMF. Ratios of ratios and their applications. J R Stat Soc. 1966;129(4):531–3. [Google Scholar]
- 24.Colorectal Screening Participation - CSQI 2013. Cancer Quality Council of Ontario; [December 16, 2013]; Available from: http://www.csqi.on.ca/cms/one.aspx?portalId=258922&pageId=273238 - .Uq80MZFRT_0.
- 25.Reiter PL, Katz ML, Oliveri JM, Young GS, Llanos AA, Paskett ED. Validation of self-reported colorectal cancer screening behaviors among Appalachian residents. Public Health Nurs. 2013;30(4):312–22. doi: 10.1111/phn.12038. [DOI] [PMC free article] [PubMed] [Google Scholar]
- 26.Warnecke RB, Sudman S, Johnson TP, O’Rourke D, Davis AM, Jobe JB. Cognitive aspects of recalling and reporting health-related events: papanicolaou smears, clinical breast examinations, and mammograms. Am J Epidemiol. 1997;146(11):982–92. doi: 10.1093/oxfordjournals.aje.a009226. [DOI] [PubMed] [Google Scholar]
- 27.McGovern PG, Lurie N, Margolis KL, Slater JS. Accuracy of self-report of mammography and Pap smear in a low-income urban population. Am J Prev Med. 1998;14(3):201–8. doi: 10.1016/S0749-3797(97)00076-7. [DOI] [PubMed] [Google Scholar]
- 28.McPhee SJ, Nguyen TT, Shema SJ, Nguyen B, Somkin C, Vo P, et al. Validation of recall of breast and cervical cancer screening by women in an ethnically diverse population. Prev Med. 2002;35(5):463–73. doi: 10.1006/pmed.2002.1096. [DOI] [PubMed] [Google Scholar]
- 29.Pizarro J, Schneider TR, Salovey P. A source of error in self-reports of pap test utilization. J Community Health. 2002;27(5):351–6. doi: 10.1023/A:1019888627113. [DOI] [PubMed] [Google Scholar]
- 30.Michielutte R, Dignan MB, Wells HB, Bahnson J, Smith M, Wooten R, et al. Errors in reporting cervical screening among public health clinic patients. J Clin Epidemiol. 1991;44(4–5):403–8. doi: 10.1016/0895-4356(91)90078-N. [DOI] [PubMed] [Google Scholar]
- 31.Baier M, Calonge N, Cutter G, McClatchey M, Schoentgen S, Hines S, et al. Validity of self-reported colorectal cancer screening behavior. Cancer Epidemiol Biomarkers Prev. 2000;9(2):229–32. [PubMed] [Google Scholar]
- 32.Li Wang X, Nie J, Upshur REG. Determining use of preventive health care in Ontario: comparison of rates of 3 maneuvers in administrative and survey data. Can Fam Physician. 2009;55:178–9. [PMC free article] [PubMed] [Google Scholar]
- 33.Khoja S, McGregor SE, Hilsden RJ. Validation of self-reported history of colorectal cancer screening. Can Fam Physician. 2007;53(7):1192–7. [PMC free article] [PubMed] [Google Scholar]
- 34.Fehringer G, Howlett R, Cotterchio M, Klar N, Majpruz-Moat V, Mai V. Comparison of papanicolaou (Pap) test rates across Ontario and factors associated with cervical screening. Canadian J Public Health Revue Canadienne de Sante Publique. 2005;96(2):140–4. doi: 10.1007/BF03403678. [DOI] [PMC free article] [PubMed] [Google Scholar]
- 35.Walker MJ, Chiarelli AM, Mirea L, Glendon G, Ritvo P, Andrulis IL, et al. Accuracy of self-reported screening mammography Use: examining recall among female relatives from the Ontario site of the breast cancer family registry. ISRN oncology. 2013;2013:810573. doi: 10.1155/2013/810573. [DOI] [PMC free article] [PubMed] [Google Scholar]
- 36.Larouche G, Bouchard K, Chiquette J, Desbiens C, Simard J, Dorval M. Self-reported mammography use following BRCA1/2 genetic testing may be overestimated. Familial Cancer. 2012;11(1):27–32. doi: 10.1007/s10689-011-9490-6. [DOI] [PubMed] [Google Scholar]