

Abstract
Central norepinephrine producing neurons comprise a diverse population of cells differing in anatomical location, connectivity, function and response to disease and environmental insult. At present, the mechanisms that generate this diversity are unknown. Here we elucidate the lineal relationship between molecularly distinct progenitor populations in the developing mouse hindbrain and mature norepinephrine neuron subtype identity. We have identified four genetically separable subpopulations of mature norepinephrine neurons differing in their anatomical location, axon morphology and efferent projection pattern. One of the subpopulations revealed an unexpected projection to the prefrontal cortex, challenging the long-held belief that the locus coeruleus (LoC) is the sole source of norepinephrine projections to the cortex. These findings reveal the embryonic origins of central norepinephrine neurons and provide for the first time multiple molecular points of entry for future study of individual norepinephrine circuits in complex behavioral and physiological processes including arousal, attention, mood, memory, appetite, and homeostasis.
Introduction
Brainstem norepinephrine neurons comprise a small yet diverse population of cells that project to virtually all areas of the central nervous system. Through release of norepinerphrine, these neurons play an essential role in a wide range of behavioral and physiological processes including arousal, attention, mood, memory, appetite, and homeostasis1-3. Reflecting this functional diversity, norepinephrine neurons vary in their anatomical location4, connectivity5, and response to disease6-11 and environmental insult12-15. The mechanisms that determine this diversity are unknown, as are molecular markers capable of identifying functionally distinct subpopulations of norepinephrine neurons. Such knowledge is fundamental to understanding the basis of selective norepinephrine neuron subtype vulnerability to disease and environmental insult and for gaining selective access to individual subpopulations of norepinephrine neurons for experimental study.
Current tract tracing and lesioning techniques used to study norepinephrine neuron diversity rely solely on anatomical subdivision of the mature system into six nuclei: A1, A2, A5, A7, LoC and subcoeruleus (SubC). The utility of these subdivisions is undeniable, but upon closer inspection, norepinephrine neurons in the brainstem appear as a continuum of cells that blur the boundaries between nuclei and make them difficult to target by viral injection or chemical lesioning. Furthermore, there is evidence that functional heterogeneity exists within these nuclei5,16. Unlike the anatomical subdivisions, classification of norepinephrine neurons based on molecular criteria would permit the use of new genetically encoded tools to map, monitor, and manipulate individual norepinephrine subpopulations in vivo17.
Over the past decade, the importance of molecular programs enacted during early development to the organization and function of mature neuronal circuitry has been demonstrated for a number of cell-types, including those controlling respiration and locomotion18-21. In the present study, we adopted a similar approach, resolving the mature norepinephrine system into molecularly separable subpopulations by exploiting the differences in gene expression that distinguish progenitor populations in the developing hindbrain. Through the process of segmentation, the developing hindbrain is transiently subdivided into eight segmental units, termed rhombomeres (r)22. Each rhombomere is distinguished by a unique gene expression code23,24 so norepinephrine neurons derived from a given rhombomere will share a common developmental gene expression history and constitute a genetic lineage. The presumptive norepinephrine progenitor domain appears to span r1-625,26; therefore, six distinct rhombomere-based genetic lineages may exist. Previous reports have indicated that the LoC is populated by neurons originating in r125,27, but the fates of norepinephrine progenitors from the remaining rhombomeres are unknown. Because the final fate of a neuron is determined, at least in part, by the cumulative effect of lineage-specific gene expression, dividing the norepinephrine system according to genetic lineage is likely to reveal functionally distinct subpopulations neurons.
To elucidate the embryonic origins of norepinephrine neurons and the role of genetic lineage in defining subtype identity, we applied a recombinase based intersectional genetic strategy in mice28-30. We selectively labeled four discrete subpopulations of norepinephrine neurons, each defined by the overlapping expression domains of a norepinephrine neuron marker, dopamine β-hydroxylase (Dbh), and a marker of r1, r2, r3&5, or r4. We mapped each subpopulation onto the adult brain and carried out whole brain mapping of their axon targets. We found that each subpopulation is distinct in its anatomical distribution and efferent projection pattern, revealing previously unrecognized lineal relationships between norepinephrine neurons located in distant regions of the brainstem. In addition, we uncovered an unexpected projection to the prefrontal cortex arising from outside of the LoC, contradicting the dogmatic view that the LoC alone projects to the cortex. Thus, we not only identify the embryonic origins of the central norepinephrine system but provide evidence that rhombomeric origin and concomitant developmental gene expression history contribute to mature norepinephrine neuron subtype identity. Together, these findings provide a novel platform for studying the contribution of individual subpopulations of norepinephrine neurons to circuits governing complex behaviors and physiological processes.
Results
To visualize r-derived subpopulations of norepinephrine neurons in isolation, we generated a norepinerphrine-specific Flpo recombinase driver line, DbhFlpo (Supplementary Fig. 1 and Supplementary Fig. 2a) and crossed it with a dual recombinase-responsive indicator line, RC∷FrePe31,32 and one of four cre driver lines, each expressed in a different rhombomere: r1(En1cre)33, r2(Hoxa2-cre)28, r3&5(Krox20cre)34, or r4(Hoxb1cre)35. The expression of these cre drivers outside of the hindbrain is not confounding, because norepinephrine neurons arise only within the hindbrain. In mice that inherit the indicator and both driver alleles (Fig. 1a), only cells that have expressed both Flpo and cre (i.e. norepinephrine neurons derived from a given rhombomere) will be labeled with enhanced green fluorescent protein (eGFP). Cells that have expressed Flpo alone (norepinephrine neurons derived from outside of that rhombomere) will be labeled with mCherry. Cells that have expressed only cre recombinase (non-norepinephrine cells from a given rhombomere) will not be labeled with either fluorophore. Co-labeling of the same cell with eGFP and mCherry cannot occur with these combinations of alleles, because of the order in which driver expression occurs. Dbh is expressed only in postmitotic neurons36, and the earliest we detected DbhFlpo-mediated recombination is at E12.5 (Supplementary Fig. 2a), several days after the cre drivers are first active in progenitor cells28,33-35. Therefore, cre activity will delete the mCherry in RC∷FrePe before Flp-dependent removal of a stop cassette that would permit mCherry expression.
Fig. 1. Intersectional genetic fate mapping strategy distinguishes r1(En1cre)-derived from non-r1-derived norepinephrine neurons.

(a) Visualization of r1-derived norepinephrine neurons in isolation requires a r1-specific cre driver line (En1cre), a norepinephrine-specific Flpo driver line (DbhFlpo, see Supplementary Fig. 1), and a dual recombinase-responsive indicator line (RC∷FrePe). In mice that inherit all three alleles, norepinephrine neurons from r1 will express both Flpo and cre resulting in eGFP expression (green neuron in schematic), and all non-r1-derived norepinephrine neurons will express only Flpo resulting in mCherry expression (red neuron in schematic). Non-norepinephrine neurons will not express Flpo and are not marked by a fluorophore regardless of Cre expression (white cells in schematic). (b) Sections from En1Cre;DbhFlpo;RC∷FrePe adult mouse brainstem immunostained for eGFP and mCherry reveal the contribution of r1(En1cre)-derived norepinephrine neurons (green) to A7, LoC, and SubCD nuclei, and non-r1-derived norepinephrine neurons (red) to A7, LoC, SubCD, A5, C2/A2 and C1/A1 nuclei. Scale bar indicates 200 μm (A7, LoC, SubCD, and A5 coronal images) and 218 μm (C2/A2 and C1/A1 sagittal images).
Each r-derived subpopulation of norepinephrine neurons was tracked into the adult brain and mapped onto the anatomically defined nuclei in the pons (LoC, SubC, A7, A5) and medulla (A2, A1) according to an adult mouse brain atlas37. For each anatomically defined nucleus, we counted the number of mCherry- and eGFP-positive cells to determine the contribution from the different r-derived subpopulations. In the medulla, the A2 and A1 nuclei are closely associated with two nuclei (C2, C1) that express epinephrine, and because Dbh is also expressed in those neurons, our analyses did not distinguish C2 from A2 or C1 from A1.
By mapping r1(En1cre)-derived norepinephrine neurons onto the adult brainstem, we found that they populate the LoC, the dorsal SubC (SubCD), and A7 nuclei (Fig.1b). These findings confirm and extend previous reports that r1-derived neurons populate the LoC25,27. No r1-derived norepinephrine neurons were found in the ventral portion of the SubC (SubCV), or anywhere in the A5, C2/A2 and C1/A1 nuclei (Fig. 1b). Interestingly, we identified a small but consistent subset of ventral LoC norepinephrine neurons that are non-r1-derived (Fig. 1b). To determine the origin of this subset, we compared the fate map of the r1(En1cre)-derived subpopulation with that of the r2(Hoxa2-cre)-, r3&5(Krox20cre)-, and r4(Hoxb1cre)-derived norepinephrine subpopulations (Fig. 2). As the complementary fate maps revealed, this small subset of norepinephrine neurons in the ventral LoC is r2(Hoxa2-cre)-derived (Fig. 2a). Examination of the other norepinephrine nuclei demonstrated that, as in the LoC, the r2-derived subpopulation constitutes a small proportion of all brainstem norepinephrine neurons. Despite their small numbers, however, r2-derived norepinephrine neurons were consistently observed in the LoC, SubCD, SubCV, A7, and A5 nuclei (Fig. 2b).
Fig. 2. Complementary fate maps reveal the distribution of r-derived norepinephrine subpopulations in the pontine norepinephrine nuclei.

(a) Coronal sections from adult mouse brainstems reveal the contribution of r1(En1cre;DbhFlpo;RC∷FrePe)-, r2(Hoxa2-cre;DbhFlpo;RC∷FrePe)-, r3&5(Krox20cre;DbhFlpo;RC∷FrePe)-, and r4(Hoxb1cre;DbhFlpo;RC∷FrePe)-derived norepinephrine neurons to the SubCV, LoC, and A5 nuclei. eGFP (green) marks the r-derived norepinephrine population and mCherry (red) marks all other norepinephrine neurons in the representative sections corresponding to the boxed areas within the schematics (left). Scale bar indicates 200 μm (LoC) and 166 μm (SubCV and A5). (b) Cell counts of eGFP and mCherry positive neurons reveal the contribution of norepinephrine neurons derived from r1, r2, r3&5 and r4 to the LoC, SubCD, SubCV, A7, and A5 pontine nuclei. Numbers are the sum of bilateral counts from 30 μm sections spaced 120 μm apart from the brainstem of four animals for each fate map (error bars are mean ± s.e.m). Green bars represent counts of eGFP positive r-derived norepinephrine neurons, and red bars represent the counts of mCherry positive norepinephrine neurons (all other non-r-derived norepinephrine neurons). Total cell counts (mCherry plus eGFP positive cells) for each norepinephrine nucleus were not significantly different between fate maps (One-way ANOVA analysis p > 0.05; df=3 and 12; LoC F=0.6073; SubCD F=2.727; SubCV F=2.203; A7 F=0.7999; A5 F=2.694).
As contributions from the r1- and r2-derived norepinephrine subpopulations diminished in more ventral and caudal regions of the brainstem, we observed an increased contribution from the r3&5(Krox20cre)-, and r4(Hoxb1cre)-derived subpopulations. We found that r3&5-derived norepinephrine neurons populate the SubCV and A5 pontine nuclei (Fig. 2), as well as a small portion of the C2/A2 and C1/A1 medullary nuclei (Fig. 3). While the r3&5-derived subpopulation constitutes a larger percentage of the total norepinephrine system than the r2-derived, the contribution is still relatively minor when compared with the r1-derived subpopulation. Indeed, only upon mapping r4(Hoxb1cre)-derived norepinephrine neurons did we uncover another subpopulation that rivals r1(En1cre)-derived neurons in overall contribution to the norepinephrine system. We found that the r4-derived subpopulation provides the largest contribution of norepinephrine neurons to both the SubCV and A5 pontine nuclei (Fig. 2). In addition, we observed r4-derived norepinephrine neurons in caudal portions of the C1/A1 and C2/A2 medullary nuclei (Fig. 3), which are predominately norepinephrine rather than epinephrine-producing neurons38. The location of these r4-derived norepinephrine neurons in the caudal medulla implies a long migratory path from their origin similar to the migration of the r4-derived facial branchiomotor neurons39.
Fig. 3. r3&5(Krox20cre)- and r4(Hoxb1cre)-derived norepinephrine neurons populate the medullary C1/A1 and C2/A2 brainstem nuclei.

(a) Sagittal sections from adult mouse brainstems reveal the contribution of norepinephrine neurons derived from r3&5(Krox20cre;DbhFlpo;RC∷FrePe) and r4(Hoxb1cre;DbhFlpo;RC∷FrePe) to the caudal regions of the C1/A1 and C2/A2 nuclei. Our analyses do not distinguish epinephrine neurons in C2 and C1 from norepinephrine neurons in A2 and A1. eGFP (green) marks the r-derived population and mCherry (red) marks all other norepinephrine and epinephrine neurons in the representative sections corresponding to the boxed areas within the schematics (left). Scale bar indicates 100 μm. (b) Cell counts of r-derived norepinephrine and epinephrine neurons in the C1/A1 and C2/A2 medullary nuclei (r3&5 n=5; r4 n=6 mice; error bars are mean ± s.e.m.). Unpaired, two-tailed t-tests demonstrate that total numbers of norepinephrine and epinephrine neurons (sum of eGFP- and mCherry-positive cells) were not significantly different between genotypes (p>0.05; df=9; C2/A2 t=1.571; C1/A1 t=1.631).
Collectively, the above findings revealed that the organization of norepinephrine neurons defined by rhombomeric origin and associated genetic lineage differs remarkably from traditional anatomical subdivisions of the adult system (Fig. 4 and Supplementary Table 1). Each of the anatomically defined norepinephrine nuclei is populated by neurons derived from more than one rhombomere, and each of the r-derived populations contributes to more than one anatomically defined nucleus. Given that this new classification is based on genetic lineage, we predicted it would reveal functionally distinct subpopulations of norepinephrine neurons.
Fig. 4. Distribution of central norepinephrine neurons defined by genetic lineage differs from the traditional anatomical subdivisions.

Schematic sagittal views of the embryonic brain (left), and the adult brain (right) compressed along the mediolateral axis. The shaded regions of the embryonic brain correspond to r1-8 of the hindbrain, and are labeled with genes used to define each rhombomere. In the adult brainstem the anatomically defined nuclei are designated as LoC, SubCD, SubCV, A7, A5, C2/A2 and C1/A137. r1(En1cre)-derived norepinephrine neurons (purple circles) contribute to the LoC, SubCD, and A7. r2(Hoxa2-cre)-derived norepinephrine neurons (orange circles) contribute to the LoC, SubCD, SubCV, A7, and A5. r3&5(Krox20cre)-derived norepinephrine neurons (yellow circles) contribute to SubCD, SubCV, A5, C2/A2, and C1/A1. r4(Hoxb1cre)-derived norepinephrine neurons (blue circles) contribute to the SubCD, SubCV, A5, C2/A2, and C1/A1. Gray circles indicate presumptive r6-derived norepinephrine neurons.
Because the ultimate function of a neuron depends on its axonal targets, we began to test this prediction by mapping efferent projections from each genetically defined norepinephrine subpopulation (Supplementary Table 2). We confirmed that eGFP expressed from RC∷FrePe fills the axon terminals of norepinephrine neurons by co-staining with an antibody against the norepinephrine transporter (NET) (Supplementary Fig. 2b). Consistent with our finding that the r1(En1cre)-derived subpopulation comprised the largest fraction of norepinephrine neurons, their projections were widespread (Supplementary Table 2). In general, r1-derived norepinephrine neurons, which encompassed the LoC and portions of SubCD and A7, gave rise to fine axon fibers that project throughout the neuroaxis. These axons most densely innervated regions involved in higher order cognition and sensory perception, including the cortex, thalamus, and hippocampus (Supplementary Table 2). This pattern of input is in agreement with published reports of LoC efferents in the rat brain40.
In comparison to the r1-derived norepinephrine neurons, the relatively small populations of r2(Hoxa2-cre)-, r3&5(Krox20cre)-derived norepinephrine neurons projected to limited targets. r2-derived norepinephrine neurons provided a sparse yet consistently observed input to the somatosensory cortex (Fig. 5), LoC, parvicellular and intermediate reticular nuclei, and the cerebellum (Supplementary Table 2). Projections from r3&5-derived norepinephrine neurons were restricted to the hindbrain, providing sparse to moderate input to the LoC, parabrachial nucleus (PBN), and the parvicellular and intermediate reticular nuclei; as well as substantial input to the solitary nucleus (NTS) (Fig. 5 and Supplementary Table 2). Though we were unable to distinguish norepinephrine neurons derived from r3 from those originating in r5, the narrow focus of their projections, together with their shared expression of Krox20, suggests that the r3&5-derived norepinephrine neurons form a single, functionally distinct subpopulation.
Fig. 5. r2(Hoxa2-cre)- and r3&5(Krox20cre)-derived norepinephrine neurons project to limited targets.

Coronal sections from adult mouse brains immunostained for eGFP to detect axonal inputs from r1(En1cre;DbhFlpo;RC∷FrePe)- and r2(Hoxa2-cre;DbhFlpo;RC∷FrePe)- derived norepinephrine neurons to the somatosensory cortex (top panel), and r3&5(Krox20cre;DbhFlpo;RC∷FrePe)- and r4(Hoxb1cre;DbhFlpo;RC∷FrePe)-derived norepinephrine neurons to the commissural solitary nucleus (bottom panel). The representative sections correspond to the boxed areas within the brain schematics (left). Sparse but specific projections from r2(Hoxa2-cre)-derived norepinephrine neurons are seen in the somatosensory cortex (top row, arrowheads in second panel), which is also targeted by the r1(En1cre)-derived subpopulation (top row, first panel). Strong innervation of the solitary nucleus by r3&5(Krox20cre)-derived norepinephrine neurons (bottom row, first panel) and r4(Hoxb1cre)-derived norepinephrine neurons (bottom row, second panel) is observed in the brainstem. Scale bar indicates 25 μm (cortex) and 100 μm (solitary nucleus).
Similar to the r1(En1cre)-derived population, axons from r4(Hoxb1cre)-derived norepinephrine neurons projected throughout the brain (Supplementary Table 2). We observed overlapping inputs, arising from both subpopulations, to multiple target areas. Within these target areas, our ability to visualize the inputs from r1- and r4-derived neurons in complete isolation revealed unique insights into the architecture of norepinephrine efferents. The morphology, density, and regional distribution of inputs arising from these two subpopulations were distinct (Fig. 6 and Supplementary Table 2). In comparison with the fine axons characteristic of the r1-derived subpopulation, r4-derived norepinephrine neurons had axons that were considerably thicker with larger varicosities. Quantification of the average pixel intensity of the two fiber types in the insular cortex and the posterior basolateral amygdaloid nucleus (BLP) confirmed that this difference was significant (Fig. 6b).
Fig. 6. r1(En1cre)- and r4(Hoxb1cre)-derived norepinephrine neurons differ in their axon morphology at multiple target sites.
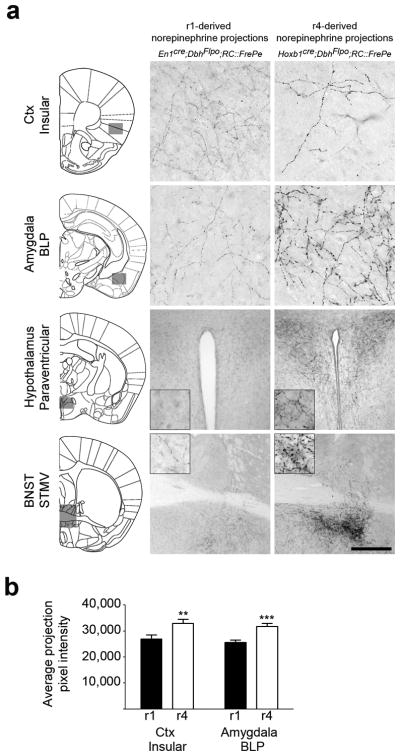
(a) Coronal sections from adult mouse brains immunostained for eGFP to detect axonal inputs from r1(En1cre;DbhFlpo;RC∷FrePe)- and r4(Hoxb1cre;DbhFlpo;RC∷FrePe)-derived norepinephrine neurons to the insular cortex, basolateral amygdala posterior part (BLP), paraventricular hypothalamus, and the bed nucleus of the stria terminalis (BNST) medial division ventral part (STMV). In the representative sections, corresponding to the boxed areas within the brain schematics (left), axons from r4(Hoxb1cre)-derived norepinephrine neurons appear thicker and have larger varicosities than those of r1(En1cre)-derived neurons. Scale bar indicates 56 μm (cortex, amygdala), 222 μm (hypothalamus), and 500 μm (BNST). (b) Quantitative comparison of projection fiber type from r1(En1cre)- and r4(Hoxb1cre)-derived norepinephrine neurons, confirms the link between genetic lineage and fiber morphology. The average projection pixel intensity of eGFP-positive axon fibers from r1(En1cre)- and r4(Hoxb1cre)-derived norepinephrine neurons projecting to the insular cortex and BLP amygdala is shown (insular cortex n=15 and BLP amygdala n=10 images from four mice; error bars are mean ± s.e.m.). A two tailed, unpaired t-test was used to determine significance **p=0.009 t=6.801 df =14 (insular Ctx), ***p=0.0006 t=2.808 df=28 (BLP amygdala).
Additionally, r4-derived neurons provided the highest density of inputs to regions that for the most part received sparse input from r1-derived subpopulations, including the hypothalamus, NTS, PBN, BLP, and the bed nucleus of the stria terminalis (BNST) (Fig. 6 and Supplementary Table 2). This finding highlights the propensity of r4(Hoxb1cre)-derived neurons to project to key components of the central autonomic nervous system (Fig. 7 and Supplementary Table 2). Consistent with these observations, we also uncovered inputs from the r4(Hoxb1cre)-derived norepinephrine subpopulation to the insular and orbital prefrontal cortex, regions known to be involved in visceral sensory perception. These results challenge the long-held belief that the LoC is the sole-source of norepinephrine projections to the cortex1,3,41.
Fig. 7. Genetically defined norepinephrine subpopulations project to unique sets of targets.

Selected axonal projections from r-derived norepinephrine neuron subpopulations located in the brainstem are illustrated as colored lines on a schematic of the adult mouse brain compressed along the mediolateral axis. Approximate positions of the subpopulations from which the projections originate are illustrated as colored circles (bottom panel). Thickness of the colored lines encircling target regions of interest qualitatively represent the density of innervation from the genetically defined subpopulation of the same color (r1 purple; r2 orange; r3&5 yellow; r4 blue). r1(En1cre)-derived neurons (purple) project throughout the neuroaxis, providing the most dense innervation to regions involved in higher order cognition and sensory perception, including the cortex (Ctx), thalamus (Thal), and hippocampus (Hippo). r2(Hoxa2-cre)-derived norepinephrine neurons (orange) project to limited targets, including a sparse projection to the somatosensory cortex (Ctx somato) and the cerebellum (Cereb). Projections from r3&5(Krox20cre)-derived norepinephrine neurons (yellow) are restricted to the hindbrain, including a sparse to moderate input to the parabrachial nucleus (PBN) and Cereb, as well as a substantial input to the NTS. r4(Hoxb1cre)-derived norepinephrine neurons (blue) project to key components of the central autonomic nervous system, including regions of the amygdala (Amyg), hypothalamus (Hyp), bed nucleus of the stria terminalis (BNST), and insular cortex (Ctx ins).
To precisely determine which of the r4(Hoxb1cre)-derived norepinephrine neurons situated in the SubC, A5, C1/A1 and C2/A2 nuclei provided this non-LoC input to the insular cortex, we performed in vivo retrograde labeling with FluoroGold in mature Hoxb1cre;DbhFlpo;RC∷FrePe mice. Notably, we found eGFP-positive r4(Hoxb1cre)-derived neurons co-labeled with FluoroGold in the SubC, C2/A2, and C1/A1 nuclei (Fig. 8 and Supplementary Fig. 3). To confirm the identity of these neurons we stained with an antibody against NET, which is expressed by norepinephrine neurons but not by the epinephrine neurons that populate C2 and C142. In each of the three nuclei, we observed norepinephrine neurons co-labeled with eGFP, FluoroGold, and NET (Fig. 8). The identification of a shared projection to the insular cortex by r4(Hoxb1cre)-derived norepinephrine neurons distributed throughout the hindbrain, supports the hypothesis that developmental gene expression history contributes to neuronal function. These findings underscore both the strength of the intersectional genetic strategy and the importance of genetic lineage in determining norepinephrine neuron subtype identity.
Fig. 8. Identification of a shared projection to the insular cortex from r4(Hoxb1cre)-derived norepinephrine neurons residing in the C2/A2, C1/A1 and SubC nuclei.

(a) Schematic sagittal view of adult mouse brain compressed along the mediolateral axis (left) and representative coronal section from Hoxb1cre;DbhFlpo;RC∷FrePe mouse brain (right) injected with FluoroGold into the insular cortex. Scale bar indicates 2.5 mm. (b) Sagittal sections from adult animals corresponding to the boxed regions in (a). eGFP-positive r4(Hoxb1cre)-derived norepinephrine neurons (green) co-labeled (*) with FluoroGold (blue) and NET (red) in C2/A2 (top panel), C1/A1 (middle panel), and SubC (bottom panel). Scale bar indicates 20 μm.
Discussion
In the present study, we reclassified the norepinephrine system into molecularly separable subdivisions permitting, for the first time, non-invasive and reproducible genetic access to distinct subpopulations of norepinephrine neurons for experimental study. Using differences in rhombomeric origin and associated gene expression history as the basis for this subdivision, we have provided evidence that these early developmental events contribute to mature norepinephrine neuron subtype identity. We defined four subpopulations of norepinephrine neurons that differ in their anatomical distribution and have revealed previously unappreciated lineal relationships between neurons located in distant regions of the brainstem (Fig. 4). We also found that these subpopulations differ in their axon morphology and that each projects to a unique set of targets (Fig. 7). The intersectional genetic strategy used to define these subpopulations enables visualization of innervation at a resolution that cannot be achieved with traditional retrograde and anterograde tracing studies, thereby revealing unique insight into the organization of central norepinephrine efferents. Notably, we uncovered a projection to the prefrontal cortex by genetically related norepinephrine neurons located outside of the LoC.
This novel subdivision of the norepinephrine system based on genetic lineage differs from the classically defined anatomical subdivisions. With the exception of the LoC, which is >99% populated by r1(En1cre)-derived norepinephrine neurons, we found that the anatomically defined nuclei are populated by two or more r-derived subpopulations. This result revealed underlying heterogeneity within each anatomically defined nucleus that had not previously been appreciated, as well as unexpected lineal relationships shared by neurons in different anatomical nuclei. Even within the LoC, our analysis revealed a small but consistent subpopulation of r2(Hoxa2-cre)-derived norepinephrine neurons. The functional relevance of this subpopulation is of particular interest, and perhaps these neurons are the source of the sparse r2-derived projection we identified in the somatosensory cortex (Fig. 5).
In each of the anatomically defined nuclei except the LoC, there are some neurons that are not labeled by any cre driver and cannot be assigned to a rhombomere. The highest proportion of unlabeled neurons are in the C2/A2 and C1/A1 medullary nuclei (Supplementary Table 1), and because the norepinephrine progenitor domain appears to span r1-625,26, it is likely that these neurons originate in r6. The cre drivers for r1-5 appear to recapitulate the expression of the wild-type genes28,33-35, and our cell counts indicate that they consistently label the same number of neurons. However, we cannot rule out the possibility that one or more of the cre drivers fail to express in 100% of cells of a given rhombomere. Development of cre driver lines that selectively mark r6 or even more caudal rhombomeres will be necessary to confirm the origin of the unassigned norepinephrine neurons and would allow for isolation of another subpopulation that is likely to have its own specific and unique projection patterns.
Initial insight into the functional significance of the genetically defined norepinephrine subpopulations was revealed by whole brain mapping of their efferent projections. Norepinephrine circuitry encompasses virtually every domain of the brain, and decoding its intricacy using conventional tract tracing methods has required a monumental effort over several decades5,43-45. Yet, limitations in resolution due to injection site variability and non-specific uptake of tracers often generate conflicting results dependent on the precise experimental paradigm. Our ability to reproducibly label and visualize each of the genetically defined subpopulations in complete isolation has revealed unique insights into the structure and organization of the norepinephrine efferent system.
Several target regions are known to receive inputs from norepinephrine neurons located in multiple anatomically defined nuclei. For example, the BNST, a critical node of the brain for the regulation of stress-induced physiological and behavioral responses, receives dense norepinephrine innervation from both the pons (LoC) and medulla (A1, A2)46,47. Due to limitations of current tract tracing technologies, visualizing the full complement of inputs from each anatomically defined nucleus and their distribution within the BNST is not possible. In the present study, we determined that r1- and r4- derived subpopulations provide norepinephrine input to the BNST. Given that r1-derived norepinephrine neurons populate only the LoC, SubCD, and A7 pontine nuclei, we are now able to discriminate their inputs to the BNST from those arising from the A1 and A2 medullary nuclei. Not only can we unambiguously assess the contribution of the subpopulations to distinct regions of the BNST (Supplementary Table 2), but we can also identify the source of morphologically distinct norepinephrine fibers (Fig. 6). This new view of norepinephrine input to the BNST provides a vital foundation for understanding the modulatory influence of norepinephrine in stress and anxiety related circuitry.
Our ability to label r4(Hoxb1cre)-derived norepinephrine efferents in isolation also revealed a never before reported projection to the cortex from a non-LoC source. Consensus in the field, based on conventional tract tracing, has been that the LoC is the sole source of norepinephrine projections to the cortex where it heavily influences states of arousal and vigilance1,3,41. Our genetic analysis, combined with retrograde tracing, reveals that r4-derived norepinephrine neurons from the SubC, C1/A1, and C2/A2 innervate the prefrontal insular cortex. This shared projection from r4(Hoxb1cre)-derived neurons located in different nuclei in the pons and medulla highlights the importance of genetic lineage in norepinephrine circuit formation. As noted above, r4(Hoxb1cre)-derived norepinephrine neurons have a propensity to innervate central autonomic centers, and given their anatomical location they likely receive corresponding visceral sensory input from the peripheral nervous system2, such as respiratory related afferents. The identification of projections from these r4(Hoxb1cre)-derived norepinephrine neurons directly to the insular cortex, a prefrontal region that is important for the perception of unpleasant respiratory sensations, hints at a role for r4-derived norepinephrine neurons in driving behavioral responses to respiratory discomfort48. In other words, r4-derived inputs to the cortex may serve as sensory relays that bypass the LoC to directly convey interoceptive information about the homeostatic state of the body to prefrontal regions capable of modulating arousal and attention states, endocrine and behavioral stress responses, and emotional learning.
In summary, by defining norepinephrine neurons based on rhombomeric origin and developmental gene expression we have gained unprecedented access to the central norepinephrine system and revealed previously unrecognized diversity within the system. We identified the contribution of neurons originating in r1-5 to the mature central norepinephrine system, and inferred the contribution from r6 or more caudal rhombomeres. The unique set of features that define each of these subpopulations provides evidence that rhombomeric origin and early developmental gene expression history contribute to mature norepinephrine neuron subtype diversity. Additional determinants of diversity, including differences in intrinsic genetic programs, extracellular signals and experience-dependent activity, all likely contribute to further heterogeneity in the norepinephrine system. Nevertheless, our findings for the first time provide multiple molecular points of entry to the norepinephrine system that will enable the functional manipulation of individual circuits at all stages of development. Phenotypes resulting from such manipulation promise unique insights into the function and differential response of norepinephrine neurons to disease and environmental insult.
Methods
Generation of DbhFlpo mice
To generate a norepinephrine neuron-specific Flp driver line, we used the dopamine β-hydroxylase promoter, taking a gene targeting rather than transgenic approach to minimize the possibility of ectopic expression. By searching the Ensembl mouse genome browser (http://www.ensembl.org), we identified BAC bMQ 351i2249, containing the Dbh locus from a 129/SvEv mouse. We PCR amplified an Em7-galK cassette from pGalK50 using primers 5′-TGGACAGGCATAAATGGCAGAGTGGGGTTGGGGTGCTCATCCCTGCCATGCCTGTTGACAATTAATCATCGGCA (DbhGalKF) and 5′-CTGGGGCTTGGGAGGCTGCTCCA ACAAGGCTGGTGGCTGAGATGAGCTTGTCAGCACTGTCCTGCTCCTT (DbhGalKR), and inserted it via homologous recombination at the start codon of Dbh in bMQ351i22. In primer DbhGalKF, the start codon of Dbh is underlined and galK sequence is italicized. We identified recombinant BACs by their ability to grow on minimal medium with galactose as the sole carbon source, and we confirmed the galK insertion by PCR at the 5′ end with primers 5′-GCCAATTAGGGGAGATGTGTTTGC (Dbh5′F), and 5′-TCTGCCTCCTGGGTTTAGTTCC (GalK5′R) and at the 3′ end with 5′-GCAAGCTGTCGCTGAACAATATG (GalK3′F) and 5′-TGGATGATCTCCT GGACATAGCTG (Dbhex1R). We then replaced the galK gene with a Flpo-polyA cassette amplified from pPGKFlpobpA51 using primers 5′-TGGACAGGCATAAATGGCAGAGTGGGG TTGGGGTGCTCATCCCTGCCATGGCTCCTAAGAAGAAGAGGAAGGTG (DbhFlpoF) and 5′-GGTAGGGGAAGGGGCTCTCTGGAGGCTCCGAGCCCCGCAGTGCAGCCACCCCATAGAGCCCACCGCATCCCCAG (DbhFlpoR3). In primer DbhFlpoF, the start codon of Dbh is underlined and Flpo sequence is italicized. The Flpo cassette replaces 107 bp within Dbh exon 1, and we selected the recombinant BAC, 351DbhFlpo, by its ability to grow in the presence of 2-deoxygalactose.
We amplified fragments of genomic DNA corresponding to the desired ends of the targeting vector homology arms from BAC bMQ351i22 using primer pairs 5′-GACTGCGGCCGCTCACTCCTCAGGCTTCCTGTAG (DbhFlpoN1F), 5′-ATGCAAGCTTGTTCTCAGAACTGCATG (DbhFlpoH3R) and 5′-ATGCAAGCTTCTGAAGTCTGAGGTCCCCAC (DbhFlpoH3F), 5′-GACTGGATCCTTCGTGACTTTTGTGATGAAGTC (DbhFlpoB1R) and cloned them between the NotI and BamHI sites of pL25352. We linearized the plasmid with HindIII and used homologous recombination to subclone an 11.8 KB fragment of 351-DbhFlpo, including the Flpo cassette and approximately 5 Kb of genomic sequence on each flank, thus generating pL253-DbhFlpo. To generate the final targeting vector, pL253-DFN, we amplified a loxP-flanked PGK/Em7-Neo cassette from pL45252 with 5′-TAGGCAGCAGTATGCTCAGGTCTGCACTGTAGCTTCCCAGCAGCAATGCCGTCGACAATTCCGATCATATTCAATAACC (DbhLoxNeoF) and 5′-GGCTCCTGTTGGGGTT GCTGCTGACTCACAGCAGGACCAGCCAGGCAGTTCTAGAACTAGTGGATCCCCTCGAG (DbhLoxNeoR) and inserted it into Dbh intron 1 of pL253-DbhFlpo.
We linearized pL253-DFN with NotI and electroporated it into Ab2.2 mouse embryonic stem cells. To identify recombinant ES cell clones, we employed long-range PCR using the Expand Long Range dNTP Pack (Roche Applied Science) and primer pairs 5′-CTTTGTCATCTAGGGAAGATCCAGGGCTGC (DbhFlp5′longF), 5′-CACAGGATGTCGAACTGGCTCATCACCTTC (DbhFlp5′longR) and 5′-ATGGAGCTAGGAAGGCAGCTATCTTTGTGC (DbhFlp3′longF), 5′-ATGGAGCTAGGAAGGCAGCTATCTTTGTGC (DbhFlp3′longR). Chimeras were produced by injecting the targeted ES cells into blastocysts of B6(Cg)-Tyrc-2J/J mice, and bred to C57BL6/J mice to establish the DbhFlpo line.
Characterization of DbhFlpo mice
As expected, heterozygous DbhFlpo mice were indistinguishable from wild type animals upon gross inspection. The rate limiting step in norepinephrine synthesis is conversion of tyrosine to L-DOPA by tyrosine hydroxylase, so loss of one Dbh allele does not affect levels of norepinephrine53. To confirm that the DbhFlpo allele is a recessive loss of function mutation, we intercrossed heterozygotes and genotyped offspring at weaning and at E12.5. At weaning, no homozygotes were observed among 32 surviving pups. At E12.5, we observed 4 homozygotes among 25 embryos, and the homozygotes were growth retarded and dead or dying. These results are consistent with previous observations of a knockout allele54.
To characterize the expression pattern of Flp recombinase from the DbhFlpo allele, we crossed DbhFlpo heterozygotes with B6;129-Gt(ROSA)26Sortm8(CAG-mCherry,-EGFP)Dym (RC∷FrePe)31,32 homozygotes to obtain double heterozygotes and assessed mCherry expression (corresponding to the history of Flpo expression) in sagittal sections from adult brain and E14.5 embryos (n=3). We visualized the pattern of mCherry expression by immunofluorescence using a rabbit anti-dsRed antibody (1:1000; 632496 Clontech) and Alexa Fluor 568 goat anti-rabbit secondary antibody (1:1000; A11036 Invitrogen) as described in the immunohistochemistry section below. We confirmed the identification of norepinephrine neurons by labeling with a chicken anti-tyrosine hydroxylase antibody (1:100; CH23006 Neuromics) and Alexa Fluor 488 goat anti-chicken secondary antibody (1:1000; A11039 Invitrogen). To detect Flpo activity earlier in development, we crossed Tg(ACTB-cre)2Mrt (hβactin-cre)55 heterozygotes with mice heterozygous for DbhFlpo and homozygous for RC∷FrePe. We visualized eGFP expression in sagittal sections of E12.5 embryos (n=5) by labeling with chicken anti-GFP (1:10,000; ab13970 Abcam) and Alexa Fluor 488 goat anti-chicken (1:1000; A11039 Invitrogen). There were no limitations in the repeatability of these observations.
Breeding and genotyping of mice
For intersectional genetic fate mapping of norepinephrine neurons, we backcrossed DbhFlpo heterozygotes with homozygous RC∷FrePe mice to generate mice heterozygous for DbhFlpo and homozygous for RC∷FrePe. We then crossed these DbhFlpo; RC∷FrePe mice with animals heterozygous or hemizygous for the various cre alleles. We obtained RC∷FrePe and STOCK Tg(Hoxa2-cre)1Dym (Hoxa2-cre)28 mice from Susan Dymecki (Harvard Medical School), and B6;129-Egr2tm2(cre)Pch (Krox20cre)34 mice from Patrick Charnay (INSERM). We purchased FVB/N-Tg(ACTB-cre)2Mrt55 (hβactin-cre), STOCK En1tm2(cre)Wrst (En1cre)56, and B6;129-Hoxb1tm1(cre)Og (Hoxb1cre) 35 mice from the Jackson Laboratory. We maintained colonies of all mouse strains by backcrossing to C57BL/6J. For routine genotyping, we carried out PCR amplification of DNA prepared from ear-punch biopsies by the hot sodium hydroxide method. Flpo-specific genotyping primers were 5′-AGAGCATCTGGGAGATCACCGAG and 5′-ATGCCGTTCCAGGCGGGGTATCTG. RC∷FrePe primers were 5′-GCACTTGCTCTCCCAAAGTC and 5′-GGGCGTACTTGGCATATGAT. Cre primers were 5′-GCAGAACCTGAAGATGTTCGC and 5′-ACACCAGAGACGGAAATCCAT.
All mice were maintained on a 12/12-hour light/dark cycle with water and food ad libitum, and either singly or group housed. All animal experiments were performed with approval of the NIEHS Institutional Animal Care and Use Committee.
Immunohistochemistry
Male and female mice (a minimum of n=4 for each sex) from 4 to 6 weeks old were anesthetized with phenobarbital and transcardially perfused with 0.1M phosphate-buffered saline (PBS) then with 4% paraformaldehyde (PFA) in PBS. After dissection, we post-fixed the brains overnight in 4% PFA at 4°C and then rinsed them in PBS prior to equilibration in 30% sucrose in PBS. Before sectioning, we embedded the cryoprotected brains in tissue-freezing medium (Triangle Biomedical Sciences).
We performed double immunofluorescence labeling on 40 μm free floating sagittal sections to examine the fate map of each animal. There were no limitations in the repeatability of the fate map observations. We identified r-derived norepinephrine neurons by chicken anti-GFP (1:10,000; ab13970 Abcam) immunolabeling and detected mCherry expression, which indicated the remaining norepinephrine neurons, with rabbit anti-dsRed (1:1000; 632496 Clontech) immunolabeling. We used Alexa Fluor 488 goat anti-chicken (A11039) and Alexa Fluor 568 goat anti-rabbit (A11036) secondary antibodies from Invitrogen at a 1:1000 dilution and collected images on a Zeiss LSM 710 inverted confocal microscope.
For the highest-sensitivity detection of eGFP in axons, we used immunoperoxidase labeling on 40 μm free-floating coronal sections. To detect immunoreactivity, we used chicken anti-GFP (1:10,000; ab13970 Abcam) in conjunction with a biotinylated goat anti-chicken secondary (BA9010), Vectastain Elite ABC kit, and DAB (all Vector Laboratories). For each genotype we assessed the distribution of eGFP-positive projections throughout the brain in a minimum of four animals (Supplementary Table 2), and designated brain regions according to an adult mouse brain atlas37. There were no limitations in the repeatability of the projection pattern observations. Images were collected on a Zeiss Axio Imager.Z2 light microscope. As a control to ensure expression of eGFP throughout norepinephrine terminals, we co-stained additional 40 μm free-floating coronal sections with mouse anti-NET (1:1,000; 1447-NET Phosphosolutions) and anti-GFP (n=3). Alexa Fluor 488 goat anti-chicken (A11039) and Alexa Fluor 568 goat anti-mouse (A11004) secondary antibodies from Invitrogen were used at 1:1000 dilution, and images were collected on a Zeiss LSM 710 inverted confocal microscope.
Cell Counts
Cell counts of norepinephrine neurons in the anatomically defined nuclei were based on procedures previously described57. For counts, eGFP and mCherry positive norepinephrine neurons were labeled by double immunofluorescence as described above. Cell numbers are the sum of bilateral counts from 30 μm sections spaced 120 μm apart from the brainstem of a minimum of four animals for each fate map. For each animal, we anatomically matched the sections to an adult mouse brain atlas37 and manually counted cells in each norepinephrine nucleus. For each nucleus, we compared total norepinephrine neuron cell counts between genotypes by one-way ANOVA analysis for nuclei populated by three or four r-derived nuclei or by an unpaired t-test for the medullary nuclei populated only by the r3&5 and r4-derived subpopulations. Both statistical tests were performed using GraphPad Prism (GraphPad Software).
Projection Pixel Intensity Quantification
We performed analysis of projection pixel intensity on the sections labeled for eGFP by the immunoperoxidase methods described above. On average, we photographed three fields from the region of interest in four animals at 2.5, 10, 20, and 40× magnifications. For quantification, we visualized the region of interest at 40× magnification as a maximal projection of a Z-stack (15 images total for insular cortex and 10 images for the posterior basolateral amygdala). Using NIH ImageJ and Metamorph software, we inverted the images and manually applied a threshold function to identify and isolate projections with the eGFP label. Following isolation of the projections, average pixel intensity was calculated across the image. We statistically analyzed the average projection pixel intensity by an unpaired t-test using GraphPad Prism. Images were collected on a Zeiss Axio Imager.Z2 light microscope.
Retrograde Labeling
Four Hoxb1cre;DbhFlpo;RC∷FrePe mice, heterozygous for both Hoxb1cre and DbhFlpo, received bilateral pressure microinjections of the retrograde tracer, FluoroGold (Fluorochrome LLC), into the insular cortex. Stereotaxic coordinates for these injections from bregma were +0.62mm anteroposterior, ±3.75mm mediolateral, and −3.5mm dorsoventral. Following anesthesia with ketamine, a total volume of 0.2 to 0.1μL of 4% FluoroGold in distilled water was perfused at a rate of 0.1 μL/min in each mouse. These experimental parameters were based upon previously published protocols58. Five days post injection, animals were transcardially perfused and the tissue was processed as described above to yield 40 μm free floating sagittal sections. For double immunofluorescence detection of eGFP and FluoroGold in four mice, we followed the protocol described above for eGFP immunofluorescence, with the addition of rabbit anti-FluoroGold (1:100,000; Fluorochrome, LLC) followed by Alexa Fluor 488 goat anti-chicken (1:1000; A11039 Invitrogen) and Alexa Fluor 647 goat anti-rabbit (1:1000; A21244 Invitrogen) in 1% BSA. Images were collected on a Zeiss LSM 710 inverted confocal microscope. There were no limitations in the repeatability of the retrograde labeling observations.
Statistical Analysis
All data are expressed as the mean ± standard error (s.e.m.). We determined mean differences between groups using two-tailed t tests or one-way ANOVA for multiple comparisons. The data meet the assumptions of these tests. All data have normal distribution (Shapiro-Wilk test for normality) and equal variances (Levene's test for homogeneity of variances). We conducted all statistical analyses using GraphPad Prism (GraphPad Software). The number of animals and specific statistical analyses used in each experiment are indicated in the figure legends and/or text. No statistical methods were used to pre-determine sample sizes, but our sample sizes are similar to those reported previously57. We did not use randomization in this study, but for each experiment all genotypes were represented and appropriately blocked for data collection. We did not perform data collection and analysis blind to the conditions of the experiments because the fate maps for each rhombomere are so distinct the investigators would be able to tell the genotype of the animals by observation of the tissue sections,
Supplementary Material
Acknowledgments
We thank Dr. S. Dymecki for Hoxa2-cre and RC∷FrePe mice, and Dr. P. Charnay for Krox20cre mice. We thank T. Wolfgang, G. Keeley and NIEHS Fluorescence Microscopy, Vivarium, Knockout Mice, and Statistics services for assistance. This research was supported by the Intramural Research Program of the NIH, National Institute of Environmental Health Sciences (ZIA-ES-102805).
Footnotes
Author Contributions: S.D.R. and P.J. conceived the project and designed the experiments. S.D.R contributed to the execution and analysis of all of the experiments and prepared the figures. N.W.P designed, generated and characterized the DbhFlpo mouse allele, and prepared Supplementary Fig. 1. J.d.M. designed and conducted the retrograde labeling study. S.D.R., N.W.P and P.J. wrote the manuscript.
References
- 1.Berridge CW, Waterhouse BD. The locus coeruleus-noradrenergic system: modulation of behavioral state and state-dependent cognitive processes. Brain research Brain research reviews. 2003;42:33–84. doi: 10.1016/s0165-0173(03)00143-7. [DOI] [PubMed] [Google Scholar]
- 2.Rinaman L. Hindbrain noradrenergic A2 neurons: diverse roles in autonomic, endocrine, cognitive, and behavioral functions. Am J Physiol Regul Integr Comp Physiol. 2011;300:R222–235. doi: 10.1152/ajpregu.00556.2010. [DOI] [PMC free article] [PubMed] [Google Scholar]
- 3.Sara SJ, Bouret S. Orienting and reorienting: the locus coeruleus mediates cognition through arousal. Neuron. 2012;76:130–141. doi: 10.1016/j.neuron.2012.09.011. [DOI] [PubMed] [Google Scholar]
- 4.Dahlström A, Fuxe K. Evidence for the existence of monoamine containing neurons in the central nervous system, I. Demonstration of monoamines in the cell bodies of brain stem neurons. Acta Physiol Scand. 1964;62(Suppl. 232):1–55. [PubMed] [Google Scholar]
- 5.Grzanna R, Fritschy JM. Efferent projections of different subpopulations of central noradrenaline neurons. Prog Brain Res. 1991;88:89–101. doi: 10.1016/s0079-6123(08)63801-7. [DOI] [PubMed] [Google Scholar]
- 6.German DC, et al. Disease-specific patterns of locus coeruleus cell loss. Annals of neurology. 1992;32:667–676. doi: 10.1002/ana.410320510. [DOI] [PubMed] [Google Scholar]
- 7.Brunnstrom H, Friberg N, Lindberg E, Englund E. Differential degeneration of the locus coeruleus in dementia subtypes. Clin Neuropathol. 2011;30:104–110. doi: 10.5414/npp30104. [DOI] [PubMed] [Google Scholar]
- 8.Benarroch EE, Schmeichel AM, Low PA, Sandroni P, Parisi JE. Loss of A5 noradrenergic neurons in multiple system atrophy. Acta Neuropathol. 2008;115:629–634. doi: 10.1007/s00401-008-0351-9. [DOI] [PMC free article] [PubMed] [Google Scholar]
- 9.Bertrand E, Lechowicz W, Szpak GM, Dymecki J. Qualitative and quantitative analysis of locus coeruleus neurons in Parkinson's disease. Folia Neuropathol. 1997;35:80–86. [PubMed] [Google Scholar]
- 10.Miller MA, Kolb PE, Leverenz JB, Peskind ER, Raskind MA. Preservation of noradrenergic neurons in the locus ceruleus that coexpress galanin mRNA in Alzheimer's disease. J Neurochem. 1999;73:2028–2036. [PubMed] [Google Scholar]
- 11.Busch C, Bohl J, Ohm TG. Spatial, temporal and numeric analysis of Alzheimer changes in the nucleus coeruleus. Neurobiol Aging. 1997;18:401–406. doi: 10.1016/s0197-4580(97)00035-3. [DOI] [PubMed] [Google Scholar]
- 12.Mohideen SS, Ichihara G, Ichihara S, Nakamura S. Exposure to 1-bromopropane causes degeneration of noradrenergic axons in the rat brain. Toxicology. 2011;285:67–71. doi: 10.1016/j.tox.2011.04.005. [DOI] [PubMed] [Google Scholar]
- 13.Soulage C, et al. Central and peripheral changes in catecholamine biosynthesis and turnover in rats after a short period of ozone exposure. Neurochem Int. 2004;45:979–986. doi: 10.1016/j.neuint.2004.06.015. [DOI] [PubMed] [Google Scholar]
- 14.Del Pino J, et al. Effects of prenatal and postnatal exposure to amitraz on norepinephrine, serotonin and dopamine levels in brain regions of male and female rats. Toxicology. 2011;287:145–152. doi: 10.1016/j.tox.2011.06.009. [DOI] [PubMed] [Google Scholar]
- 15.Slotkin TA, Seidler FJ. Mimicking maternal smoking and pharmacotherapy of preterm labor: fetal nicotine exposure enhances the effect of late gestational dexamethasone treatment on noradrenergic circuits. Brain Res Bull. 2011;86:435–440. doi: 10.1016/j.brainresbull.2011.08.009. [DOI] [PMC free article] [PubMed] [Google Scholar]
- 16.Swanson LW. The locus coeruleus: a cytoarchitectonic, Golgi and immunohistochemical study in the albino rat. Brain Res. 1976;110:39–56. doi: 10.1016/0006-8993(76)90207-9. [DOI] [PubMed] [Google Scholar]
- 17.Dymecki SM, Kim JC. Molecular neuroanatomy's “Three Gs”: a primer. Neuron. 2007;54:17–34. doi: 10.1016/j.neuron.2007.03.009. [DOI] [PMC free article] [PubMed] [Google Scholar]
- 18.Champagnat J, Morin-Surun MP, Fortin G, Thoby-Brisson M. Developmental basis of the rostro-caudal organization of the brainstem respiratory rhythm generator. Philosophical transactions of the Royal Society of London Series B, Biological sciences. 2009;364:2469–2476. doi: 10.1098/rstb.2009.0090. [DOI] [PMC free article] [PubMed] [Google Scholar]
- 19.Gray PA, et al. Developmental origin of preBotzinger complex respiratory neurons. J Neurosci. 2010;30:14883–14895. doi: 10.1523/JNEUROSCI.4031-10.2010. [DOI] [PMC free article] [PubMed] [Google Scholar]
- 20.Grossmann KS, Giraudin A, Britz O, Zhang J, Goulding M. Genetic dissection of rhythmic motor networks in mice. Prog Brain Res. 2010;187:19–37. doi: 10.1016/B978-0-444-53613-6.00002-2. [DOI] [PMC free article] [PubMed] [Google Scholar]
- 21.Dasen JS, Jessell TM. Hox networks and the origins of motor neuron diversity. Current topics in developmental biology. 2009;88:169–200. doi: 10.1016/S0070-2153(09)88006-X. [DOI] [PubMed] [Google Scholar]
- 22.Lumsden A, Krumlauf R. Patterning the vertebrate neuraxis. Science. 1996;274:1109–1115. doi: 10.1126/science.274.5290.1109. [DOI] [PubMed] [Google Scholar]
- 23.Krumlauf R, et al. Hox homeobox genes and regionalisation of the nervous system. J Neurobiol. 1993;24:1328–1340. doi: 10.1002/neu.480241006. [DOI] [PubMed] [Google Scholar]
- 24.Chambers D, et al. Rhombomere-specific analysis reveals the repertoire of genetic cues expressed across the developing hindbrain. Neural Dev. 2009;4:6. doi: 10.1186/1749-8104-4-6. [DOI] [PMC free article] [PubMed] [Google Scholar]
- 25.Aroca P, Lorente-Canovas B, Mateos FR, Puelles L. Locus coeruleus neurons originate in alar rhombomere 1 and migrate into the basal plate: Studies in chick and mouse embryos. J Comp Neurol. 2006;496:802–818. doi: 10.1002/cne.20957. [DOI] [PubMed] [Google Scholar]
- 26.Gaufo GO, Wu S, Capecchi MR. Contribution of Hox genes to the diversity of the hindbrain sensory system. Development. 2004;131:1259–1266. doi: 10.1242/dev.01029. [DOI] [PubMed] [Google Scholar]
- 27.Simon HH, Scholz C, O'Leary DD. Engrailed genes control developmental fate of serotonergic and noradrenergic neurons in mid- and hindbrain in a gene dose-dependent manner. Molecular and cellular neurosciences. 2005;28:96–105. doi: 10.1016/j.mcn.2004.08.016. [DOI] [PubMed] [Google Scholar]
- 28.Awatramani R, Soriano P, Rodriguez C, Mai JJ, Dymecki SM. Cryptic boundaries in roof plate and choroid plexus identified by intersectional gene activation. Nature genetics. 2003;35:70–75. doi: 10.1038/ng1228. [DOI] [PubMed] [Google Scholar]
- 29.Farago AF, Awatramani RB, Dymecki SM. Assembly of the brainstem cochlear nuclear complex is revealed by intersectional and subtractive genetic fate maps. Neuron. 2006;50:205–218. doi: 10.1016/j.neuron.2006.03.014. [DOI] [PubMed] [Google Scholar]
- 30.Jensen P, et al. Redefining the serotonergic system by genetic lineage. Nature neuroscience. 2008;11:417–419. doi: 10.1038/nn2050. [DOI] [PMC free article] [PubMed] [Google Scholar]
- 31.Bang SJ, Jensen P, Dymecki SM, Commons KG. Projections and interconnections of genetically defined serotonin neurons in mice. Eur J Neurosci. 2012;35:85–96. doi: 10.1111/j.1460-9568.2011.07936.x. [DOI] [PMC free article] [PubMed] [Google Scholar]
- 32.Engleka KA, et al. Islet1 derivatives in the heart are of both neural crest and second heart field origin. Circ Res. 2012;110:922–926. doi: 10.1161/CIRCRESAHA.112.266510. [DOI] [PMC free article] [PubMed] [Google Scholar]
- 33.Li JY, Lao Z, Joyner AL. Changing requirements for Gbx2 in development of the cerebellum and maintenance of the mid/hindbrain organizer. Neuron. 2002;36:31–43. doi: 10.1016/s0896-6273(02)00935-2. [DOI] [PubMed] [Google Scholar]
- 34.Voiculescu O, Charnay P, Schneider-Maunoury S. Expression pattern of a Krox-20/Cre knock-in allele in the developing hindbrain, bones, and peripheral nervous system. Genesis. 2000;26:123–126. doi: 10.1002/(sici)1526-968x(200002)26:2<123::aid-gene7>3.0.co;2-o. [DOI] [PubMed] [Google Scholar]
- 35.O'Gorman S. Second branchial arch lineages of the middle ear of wild-type and Hoxa2 mutant mice. Developmental dynamics : an official publication of the American Association of Anatomists. 2005;234:124–131. doi: 10.1002/dvdy.20402. [DOI] [PubMed] [Google Scholar]
- 36.Goridis C, Rohrer H. Specification of catecholaminergic and serotonergic neurons. Nature reviews Neuroscience. 2002;3:531–541. doi: 10.1038/nrn871. [DOI] [PubMed] [Google Scholar]
- 37.Paxinos G, Franklin KBJ. The mouse brain in stereotaxic coordinates. Elsevier Academic Press Amsterdam; Boston: 2004. [Google Scholar]
- 38.Hokfelt T, Fuxe K, Goldstein M, Johansson O. Evidence for adrenaline neurons in the rat brain. Acta Physiol Scand. 1973;89:286–288. doi: 10.1111/j.1748-1716.1973.tb05522.x. [DOI] [PubMed] [Google Scholar]
- 39.Garel S, Garcia-Dominguez M, Charnay P. Control of the migratory pathway of facial branchiomotor neurones. Development. 2000;127:5297–5307. doi: 10.1242/dev.127.24.5297. [DOI] [PubMed] [Google Scholar]
- 40.Fritschy JM, Grzanna R. Distribution of locus coeruleus axons within the rat brainstem demonstrated by Phaseolus vulgaris leucoagglutinin anterograde tracing in combination with dopamine-beta-hydroxylase immunofluorescence. J Comp Neurol. 1990;293:616–631. doi: 10.1002/cne.902930407. [DOI] [PubMed] [Google Scholar]
- 41.Aston-Jones G, Cohen JD. An integrative theory of locus coeruleus-norepinephrine function: adaptive gain and optimal performance. Annu Rev Neurosci. 2005;28:403–450. doi: 10.1146/annurev.neuro.28.061604.135709. [DOI] [PubMed] [Google Scholar]
- 42.Lorang D, Amara SG, Simerly RB. Cell-type-specific expression of catecholamine transporters in the rat brain. J Neurosci. 1994;14:4903–4914. doi: 10.1523/JNEUROSCI.14-08-04903.1994. [DOI] [PMC free article] [PubMed] [Google Scholar]
- 43.Sawchenko PE, Swanson LW. Central noradrenergic pathways for the integration of hypothalamic neuroendocrine and autonomic responses. Science. 1981;214:685–687. doi: 10.1126/science.7292008. [DOI] [PubMed] [Google Scholar]
- 44.Mejias-Aponte CA, Drouin C, Aston-Jones G. Adrenergic and noradrenergic innervation of the midbrain ventral tegmental area and retrorubral field: prominent inputs from medullary homeostatic centers. J Neurosci. 2009;29:3613–3626. doi: 10.1523/JNEUROSCI.4632-08.2009. [DOI] [PMC free article] [PubMed] [Google Scholar]
- 45.Chandler D, Waterhouse BD. Evidence for broad versus segregated projections from cholinergic and noradrenergic nuclei to functionally and anatomically discrete subregions of prefrontal cortex. Front Behav Neurosci. 2012;6:20. doi: 10.3389/fnbeh.2012.00020. [DOI] [PMC free article] [PubMed] [Google Scholar]
- 46.Forray MI, Gysling K, Andres ME, Bustos G, Araneda S. Medullary noradrenergic neurons projecting to the bed nucleus of the stria terminalis express mRNA for the NMDA-NR1 receptor. Brain Res Bull. 2000;52:163–169. doi: 10.1016/s0361-9230(00)00229-x. [DOI] [PubMed] [Google Scholar]
- 47.Myers EA, Banihashemi L, Rinaman L. The anxiogenic drug yohimbine activates central viscerosensory circuits in rats. J Comp Neurol. 2005;492:426–441. doi: 10.1002/cne.20727. [DOI] [PubMed] [Google Scholar]
- 48.Davenport PW, Vovk A. Cortical and subcortical central neural pathways in respiratory sensations. Respiratory physiology & neurobiology. 2009;167:72–86. doi: 10.1016/j.resp.2008.10.001. [DOI] [PubMed] [Google Scholar]
- 49.Adams DJ, et al. A genome-wide, end-sequenced 129Sv BAC library resource for targeting vector construction. Genomics. 2005;86:753–758. doi: 10.1016/j.ygeno.2005.08.003. [DOI] [PubMed] [Google Scholar]
- 50.Warming S, Costantino N, Court DL, Jenkins NA, Copeland NG. Simple and highly efficient BAC recombineering using galK selection. Nucleic Acids Res. 2005;33:e36. doi: 10.1093/nar/gni035. [DOI] [PMC free article] [PubMed] [Google Scholar]
- 51.Raymond CS, Soriano P. High-efficiency FLP and PhiC31 site-specific recombination in mammalian cells. PloS one. 2007;2:e162. doi: 10.1371/journal.pone.0000162. [DOI] [PMC free article] [PubMed] [Google Scholar]
- 52.Liu P, Jenkins NA, Copeland NG. A highly efficient recombineering-based method for generating conditional knockout mutations. Genome Res. 2003;13:476–484. doi: 10.1101/gr.749203. [DOI] [PMC free article] [PubMed] [Google Scholar]
- 53.Thomas SA, Marck BT, Palmiter RD, Matsumoto AM. Restoration of norepinephrine and reversal of phenotypes in mice lacking dopamine beta-hydroxylase. J Neurochem. 1998;70:2468–2476. doi: 10.1046/j.1471-4159.1998.70062468.x. [DOI] [PubMed] [Google Scholar]
- 54.Thomas SA, Matsumoto AM, Palmiter RD. Noradrenaline is essential for mouse fetal development. Nature. 1995;374:643–646. doi: 10.1038/374643a0. [DOI] [PubMed] [Google Scholar]
- 55.Lewandoski M, Meyers EN, Martin GR. Analysis of Fgf8 gene function in vertebrate development. Cold Spring Harb Symp Quant Biol. 1997;62:159–168. [PubMed] [Google Scholar]
- 56.Kimmel RA, et al. Two lineage boundaries coordinate vertebrate apical ectodermal ridge formation. Genes & development. 2000;14:1377–1389. [PMC free article] [PubMed] [Google Scholar]
- 57.Jin SH, Kim HJ, Harris DC, Thomas SA. Postnatal development of the cerebellum and the CNS adrenergic system is independent of norepinephrine and epinephrine. J Comp Neurol. 2004;477:300–309. doi: 10.1002/cne.20263. [DOI] [PubMed] [Google Scholar]
- 58.Schofield BR. Retrograde axonal tracing with fluorescent markers. Curr Protoc Neurosci. 2008;Chapter 1:17. doi: 10.1002/0471142301.ns0117s43. Unit 1. [DOI] [PubMed] [Google Scholar]
Associated Data
This section collects any data citations, data availability statements, or supplementary materials included in this article.