

Abstract
WNT signaling stimulates bone formation by increasing both the number of osteoblasts and their protein-synthesis activity. It is not clear how WNT augments the capacity of osteoblast progenitors to meet the increased energetic and synthetic needs associated with mature osteoblasts. Here, in cultured osteoblast progenitors, we determined that WNT stimulates glutamine catabolism through the tricarboxylic acid (TCA) cycle and consequently lowers intracellular glutamine levels. The WNT-induced reduction of glutamine concentration triggered a general control nonderepressible 2–mediated (GCN2-mediated) integrated stress response (ISR) that stimulated expression of genes responsible for amino acid supply, transfer RNA (tRNA) aminoacylation, and protein folding. WNT-induced glutamine catabolism and ISR were β-catenin independent, but required mammalian target of rapamycin complex 1 (mTORC1) activation. In a hyperactive WNT signaling mouse model of human osteosclerosis, inhibition of glutamine catabolism or Gcn2 deletion suppressed excessive bone formation. Together, our data indicate that glutamine is both an energy source and a protein-translation rheostat that is responsive to WNT and suggest that manipulation of the glutamine/GCN2 signaling axis may provide a valuable approach for normalizing deranged protein anabolism associated with human diseases.
Introduction
Mammals, including humans, are characterized by the presence of a bony skeleton that not only provides structure and protection, but also regulates mineral homeostasis and whole body metabolism (1). Osteoblasts are the chief bone-making cells responsible for producing the large amount of collagen I–rich bone matrix as well as ectoenzymes such as ALPL (also known as AKP2), which controls matrix mineralization. Thus, a defining characteristic of osteoblasts is the ability to produce and secrete copious extracellular proteins. However, little is understood about the mechanisms endowing osteoblasts with such robust anabolic capacity.
WNTs are secreted glycoproteins that critically regulate osteoblast differentiation and activity. WNT ligands bind to a receptor complex consisting of a member of the Frizzled family and a coreceptor of the LRP5/6, RYK, or ROR family (2, 3). In humans and mice, loss- and gain-of-function mutations of the WNT coreceptor LRP5 cause osteoporosis-pseudoglioma and high–bone-mass disorders, respectively (4–6). High bone mass caused by LRP5 gain-of-function mutations is driven by increased osteoblast number and activity; however, the molecular mechanisms underlying WNT regulation of bone formation are not fully understood. WNT ligands activate both β-catenin–dependent and –independent pathways. The importance of β-catenin–dependent WNT signaling in bone formation has been well documented in both embryonic and postnatal mice (7–13). Likewise, β-catenin–independent WNT– mammalian target of rapamycin complex 1 (WNT/mTORC1) signaling also promotes bone formation (14, 15). Activation of mTORC1 is known to stimulate protein synthesis and is therefore well suited for promoting osteoblast activity (16). However, a question remains as to how cells respond to the increased demand for energy and translational capacity.
Eukaryotic cells respond to increased protein synthesis by activating the integrated stress response (ISR) to ensure a proper balance between synthetic capacity and demand. At the core of ISR is the α subunit of the eukaryotic translation initiation factor 2 (eIF2α), which can be inactivated through phosphorylation by several kinases including protein kinase RNA-like endoplasmic reticulum kinase (PERK) (also known as eIF2αk3) and general control nonderepressible 2 (GCN2) (also known as eIF2αk4) (17–19). Whereas PERK is activated upon accumulation of unfolded proteins in the ER, GCN2 responds to uncharged transfer RNA (tRNA) when free amino acids are limited. Activated PERK or GCN2 phosphorylates serine 51 of eIF2α, preventing efficient translational initiation of most mRNAs. Remarkably, eIF2α phosphorylation activates translation of the transcription factor ATF4, which together with its transcriptional target DNA damage-inducible transcript 3 (DDIT3) (also known as CHOP), activates a host of genes that support further increase in protein synthesis, including those encoding amino acid transporters (e.g., glycine transporter [GLYT1]) and amino acid synthases (e.g., asparagine synthase [ASNS]) (20). Indeed, ATF4 has been shown to play a critical role in supporting protein synthesis in osteoblasts (21). Moreover, Perk-knockout mice exhibit osteopenia partly due to the inability to process type I procollagen in the ER, and BMP2-induced osteoblast differentiation has been linked with mild ER stress in vitro (22–25). However, it is not known whether ER stress is the principal mechanism activating ISR in osteoblasts or whether physiologic bone anabolic signals stimulate ISR through specific pathways.
The energetics of osteoblasts are also poorly understood. Because protein synthesis is among the most energetically costly processes in the cell, osteoblasts are expected to increase energy demand upon differentiation (26). Although glucose is a major energy source for most mammalian cells, we previously observed that glucose was diverted to the less energy-efficient glycolysis instead of the tricarboxylic acid (TCA) cycle during WNT-induced osteoblast differentiation (27). A similar switch in glucose metabolism is often seen in cancer cells, commonly known as the Warburg effect (28, 29). In some cancer cells, the Warburg effect is associated with an increase in glutamine (Gln) consumption through the TCA cycle (30). In those cases, Gln is converted to glutamate by glutaminase (GLS) and then to α-ketoglutarate, which replenishes the TCA metabolic intermediates (anaplerosis) to maintain mitochondrial activity while supplying metabolic intermediates for active biosynthesis. Whether such changes of Gln metabolism occur during osteoblast differentiation has not been explored. In fact, there have been few studies about Gln metabolism in bone, although active Gln metabolism does occur in bone tissue (31). More recently, Gln was shown to be necessary for bone matrix mineralization (32). However, it is not known whether Gln is used as an energy source or for other anabolic needs in bone. Here, we report that WNT/mTORC1 signaling stimulates protein synthesis, which coincides with increased Gln catabolism during osteoblast differentiation. The increased Gln catabolism not only provides ATP through the TCA cycle, but also activates GCN2-dependent ISR, which stimulates a transcriptional program that enhances the translational capacity of the cell. Importantly, inhibition of the Gln catabolism/GCN2-dependent ISR-signaling axis either genetically or pharmacologically rescues the high–bone-mass phenotype caused by hyperactive WNT signaling in the mouse. These data identify Gln catabolism as a key regulatory step in fulfilling both energetic and synthetic requirements associated with WNT-induced bone anabolism.
Results
WNT/mTORC1 signaling stimulates protein synthesis during osteoblast differentiation.
We have previously shown that mTORC1 signaling is partially responsible for WNT-mediated bone formation (33). To gain insights about the molecular mechanism downstream of WNT/mTORC1 signaling during osteoblast differentiation, we interrogated the effects of this signaling pathway using the cell line ST2, a mouse bone marrow stromal cell line that undergoes osteoblast differentiation in response to WNT (34). Consistent with our previous finding, WNT3A acutely activated mTORC1, as evidenced by phosphorylation of both S6 and eIF4EBP1 in ST2 cells (Figure 1A). The stronger signal for the total eIF4EBP1 protein in response to WNT3A was likely due to a greater affinity of the antibody for the phosphorylated forms. The active site mTOR inhibitor Torin1 abolished phosphorylation of both S6 and eIF4EBP1 in response to WNT3A (Figure 1A). Because mTORC1 is a known stimulator of protein synthesis, we examined the rate of protein synthesis in response to WNT3A. Metabolic labeling with [35S] cysteine/methionine revealed a significant increase in the rate of protein synthesis at both 24 and 48 hours of WNT3A treatment (Figure 1B). This effect was mTORC1 dependent, as Torin1 abolished the induction by WNT3A, but rictor knockdown had no effect (Figure 1C and Supplemental Figure 1A; supplemental material available online with this article; doi:10.1172/JCI78470DS1). Because protein synthesis is among the most energetically costly processes in the cell, WNT-induced protein synthesis is expected to increase energy demand. To monitor the energy status, we evaluated AMPK phosphorylation and found a consistent increase after 1 and 6 hours of WNT3A treatment, but the increase was transient and no longer obvious by 12 hours (Figure 1D). Importantly, this phenomenon was mTORC1 dependent, as Torin1 treatment abolished AMPK phosphorylation in response to WNT3A (Figure 1A). Thus, WNT/mTORC1 signaling induces a transient energy deficiency that is rapidly resolved during osteoblast differentiation.
Figure 1. WNT/mTORC1-dependent protein synthesis induces a transient energy deficit during osteoblast differentiation.

(A) Effect of Torin1 on WNT-induced mTORC1 signaling and AMPK phosphorylation assayed by Western blot. Phospho-proteins normalized to respective total protein. Fold change ± SD for WNT3A over vehicle in 3 independent experiments. (B and C) Metabolic labeling of protein synthesis in response to WNT3A (B) and the effect of Torin1 (C). Cyclohexamide (Chx) used to inhibit protein synthesis as a control in B. Error bars indicate SD. *P < 0.05, Student’s t test. n = 3. (D) Effect of WNT3A on AMPK phosphorylation at 1, 6, and 12 hours. Fold change ± SD from 3 independent experiments.
WNT/mTORC1 signaling enhances Gln-dependent anaplerosis.
We next investigated how cells resolved the energy deficit despite a rapid increase in protein synthesis during osteoblast differentiation. We have previously demonstrated that glucose is diverted to the less energy-efficient, lactate-producing glycolysis instead of the TCA cycle during WNT-induced osteoblast differentiation (27). Therefore, glucose metabolism is unlikely to fulfill energy demand. In a metabolomics study designed to identify intracellular metabolite changes in ST2 cells in response to WNT3A, we discovered that after 24 hours, WNT3A markedly reduced the levels of Gln (to 36% of control) without affecting any other amino acids (Figure 2A and Supplemental Figure 2). As an important function of Gln is to support energy production through anaplerosis of TCA intermediates, Gln is likely a major energy source activated during osteoblastogenesis. A hallmark of cells undergoing Gln-dependent anaplerosis is increased consumption of Gln. Direct measurements of Gln in the cell-culture media revealed that WNT3A-treated cells consumed more Gln at 24 and 48 hours (Figure 2B). Importantly, the WNT-induced increase in Gln consumption was mTOR-dependent, as Torin1 blocked the effect (Figure 2C). The enzyme GLS catabolizes Gln into glutamate at the first step of Gln-dependent anaplerosis. Indeed, we found that WNT3A significantly increased GLS protein levels independently of changes in mRNA at as early as 6 hours (Figure 2D and data not shown). To determine whether WNT3A affected GLS activity, we incubated ST2 cells with L-[2,3,4-3H] glutamine after 6 hours of pretreatment with or without WNT3A and found that WNT3A only slightly increased the amount of 3H-glutamine in the cell, but markedly increased the level of 3H-glutamate and its metabolites. Thus, WNT3A increases total GLS activity in the cell, consistent with the upregulation of GLS protein levels (Figure 2E). Overall, WNT/mTORC1 signaling likely stimulates energy production through increased Gln utilization via the TCA cycle.
Figure 2. WNT induces Gln-dependent anaplerosis during osteoblast differentiation.

(A) Relative intracellular Gln levels in response to WNT3A determined by mass spectrometry. Welch’s 2-sample t test. n = 5. Box denotes upper and lower quartiles, while line denotes the median. The whiskers denote the maximum and minimum values of the distribution. (B and C) Measurements of Gln uptake from the medium in response to WNT3A without (B) or with Torin1 (C). Error bars indicate SD. *P < 0.05, Student’s t test. n = 3. (D) Effect of WNT3A on GLS protein levels at 6 hours. Fold change ± SD from 3 independent experiments. (E) Effect of WNT3A on GLS activity by measuring the conversion of 3H[2,3,4] Gln to glutamate (Glu). 3H cpm ± SD. *P < 0.05, Student’s t test. n = 5. (F) Graphical depiction of Gln-dependent anaplerosis into the TCA cycle. Red circles indicate 13C, whereas black and green circles denote 12C and 14N, respectively. [U-13C5] glutamine–derived αKG generates [13C4] citrate (M+4) through oxidation, but [13C5] citrate (M+5) via reductive carboxylation.
To test directly whether WNT stimulates Gln-dependent anaplerosis, we used stable isotopically labeled Gln to determine the fraction of citrate derived from Gln. Briefly, cells precultured with or without WNT3A for 6, 12, or 24 hours were incubated with a Gln tracer uniformly labeled with 13C ([U-13C5] glutamine) for 1 hour, and contribution of the tracer to citrate through oxidation in the TCA cycle ([13C4] citrate, m+4 isotopomer) was determined by measuring the mass isotopomer–labeling pattern of intracellular citrate (Figure 2F). Similar results were obtained at all 3 time points, but only data from 12-hour treatment are reported here. WNT3A slightly increased the intracellular fractional abundance of [U-13C5] glutamine (m+5) from the control level of 10.4% (±0.1%, SD) to 11.8% (±0.2%, SD), possibly because WNT3A treatment caused a reduction in the Gln concentration prior to the addition of labeled Gln to the culture medium. However, WNT3A caused a greater increase in the fractional abundance of [13C4] citrate, from 1.39% (±0.17% SD) to 2.04% (±0.18%, SD) (P = 0.01). From the ratio of the relative abundance of [13C4] citrate to [U-13C5] glutamine, it is estimated that WNT3A increased the fraction of [13C4] citrate derived from labeled Gln from 13.4% (±1.6%, SD) to 17.3% (±1.3%, SD) (P = 0.03) during the 1-hour labeling period. In contrast, the fraction of [13C5] citrate (m+5 isotopomer) derived from labeled Gln was not significantly different with or without WNT treatment (4.1% ± 1.0% vs. 3.8% ± 1.0%, SD, respectively, P = 0.76), indicating that production of citrate from Gln via reductive carboxylation was not affected by WNT treatment. Thus, WNT signaling enhances TCA anaplerosis from Gln via oxidation.
Gln catabolism activates ISR via GCN2 in response to WNT/mTORC1 signaling.
Uncharged tRNA caused by amino acid deficiency is known to activate a signal transduction cascade known as the ISR via activation of GCN2. ISR is characterized by the phosphorylation of eIF2α and induction of ATF4 and DDIT3. We therefore investigated whether WNT-induced Gln deficiency activated ISR. Indeed, WNT3A significantly increased the phosphorylation of GCN2 at T898, indicative of GCN2 activation, after 72 hours of treatment (Figure 3A). Likewise, WNT3A induced phosphorylation of eIF2α at Serine 51 after 72 hours of treatment, coinciding with increased expression of both ATF4 and CHOP protein (Figure 3A). Like WNT3A, virally expressed WNT7B also induced eIF2α phosphorylation and increased ATF4 and DDIT3 in ST2 cells (Supplemental Figure 3A). Importantly, daily supplementation of 2 mM Gln, but not other amino acids, to the culture media partially suppressed eIF2α phosphorylation as well as ATF4 and CHOP induction (Figure 3, B and C, and Supplemental Figure 5). Thus, WNT-induced intracellular Gln deficiency causes GCN2-mediated ISR in cells.
Figure 3. WNT induces ISR via mTORC1.

(A–E) Western blot analyses of ISR in response to WNT3A at 72 hours. Images in (A) are derived from samples run on parallel gels. (B and C) Effect of daily supplementation of Gln (B) or other amino acids (all except alanine and Gln) (C) on eIF2α phosphorylation. (D and E) Western blot analyses of Torin1 (D) or dnTCF4’s (E) effect on ISR induction by WNT3A. Phospho-proteins normalized to respective total protein; others normalized to β-actin. Fold change ± SD for WNT3A over vehicle in 3 independent experiments.
We next evaluated the relevance of mTOR to WNT-induced ISR. Torin1 abolished phosphorylation of both S6 and 4EBP1, but more importantly, eliminated eIF2α phosphorylation and ATF4 accumulation (Figure 3D). In contrast, knockdown of rictor, a specific component of mTORC2, had no effect on WNT3A-induced eIF2α phosphorylation, even though it blocked AKT phosphorylation at S473 (Supplemental Figure 1B). Moreover, a dominant negative TCF4 (dnTCF4) that cannot interact with β-catenin did not impair the induction of eIF2α phosphorylation or ATF4 levels by WNT3A, although it expectedly blocked the induction of Lef1, a known β-catenin target gene (Figure 3E and Supplemental Figure 4A). Thus, mTORC1 activation appears to be the primary mechanism mediating the induction of ISR by WNT3A.
WNT/mTORC1 ISR signaling activates protein anabolism genes.
ISR activation is known to induce a transcriptional program downstream of ATF4 and CHOP that promotes robust protein synthesis in the cell. To test whether this is the case during osteoblast differentiation, we used reverse-transcription quantitative PCR (RT-qPCR) to examine the expression of a number of known targets of ATF4 and/or CHOP (20, 35). Indeed, a large number of genes encoding for amino acid synthases (e.g., ASNS), tRNA-charging enzymes (e.g., leucyl-tRNA synthetase [LARS] and threonyl-tRNA synthetase [TARS]), amino acid transporters (e.g., GLYT1), and molecular chaperones involved in oxidative protein folding (e.g., ERO1L and HSPA5) were induced in ST2 cells by WNT3A after 72 hours (Figure 4A). Similar to WNT3A, virally expressed WNT7B and WNT10B, both previously shown to induce osteoblast differentiation in ST2 cells, also induced these genes (Supplemental Figure 3B). Thus, WNT signaling induces ISR, which activates the expression of genes that promote protein anabolism during osteoblast differentiation.
Figure 4. GCN2/eIF2α/ATF4 pathway is required for WNT-induced osteoblast differentiation.

(A) RT-qPCR analyses of anabolic genes in ST2 cells treated with WNT3A for 72 hours. (B) RT-qPCR analyses of ATF4 knockdown effect on WNT-induced anabolic genes. shRNA for RFP used as negative control. Error bars indicate SD. *P < 0.05, Student’s t test. n = 3. (C) Effect of GCN2 knockdown on ISR assayed by Western blot. Phospho-eIF2α normalized to total protein; GCN2 normalized to α-tubulin. Fold change ± SD for WNT3A over vehicle in 3 independent experiments. (D and E) Effect of GCN2 knockdown on gene expression assayed by RT-qPCR. shRNA for RFP used as negative control. Error bars indicate SD. *P < 0.05, Student’s t test. n = 9. (E) Effect of GCN2 knockdown on alkaline phosphatase induction (AKP2) and mineralization (von Kossa).
We next tested the importance of ISR in WNT-induced osteoblast differentiation. ATF4 knockdown with shRNA blocked the induction of CHOP, protein anabolism genes (e.g., GLYT1), and osteoblast markers (e.g., IBSP) by WNT3A (Figure 4B). Likewise, GCN2 knockdown completely abrogated WNT3A-induced eIF2α phosphorylation, Chop mRNA expression, and anabolic gene induction (Figure 4, C and D). Moreover, GCN2 knockdown abolished WNT-induced matrix mineralization, a readout for osteoblast activity, even though it did not affect the induction of Akp2 or several other osteoblast marker genes (Figure 4E and data not shown). Thus, WNT regulates osteoblast activity in part through GCN2-mediated ISR, and the regulation is integral to osteoblast differentiation independent of the commonly known osteoblast marker genes.
Gln catabolism is required for osteoblast differentiation in vitro.
We next directly examined the role of Gln catabolism in WNT-induced osteoblastogenesis. As expected, the GLS inhibitor bis-2-(5-phenylacetamido-1,2,4-thiadiazol-2-yl)ethyl sulfide (BPTES) blocked Gln consumption in response to WNT3A (Figure 5A). Importantly, BPTES abolished the induction of the osteoblast marker gene Ibsp, the protein anabolism genes (e.g., Asns), and matrix mineralization in response to WNT3A (Figure 5, B–D). Thus, GLS-dependent Gln catabolism is required for WNT-induced osteoblast differentiation.
Figure 5. GLS-dependent Gln catabolism is required for WNT-induced ISR and osteoblast differentiation.

(A–D) Effect of BPTES treatment on WNT-induced Gln consumption (A), gene expression (B and C), or AKP2 and von Kossa staining (D). (E–H) Effect of DM-α-KG on WNT-induced Gln consumption (E), GCN2 phosphorylation (F), anabolic gene expression (G), or AKP2 and von Kossa staining (H). Error bars indicate SD. *P < 0.05, Student’s t test. n = 3.
Our data so far indicate that WNT-induced Gln catabolism not only provides additional ATP via the TCA cycle, but also activates GCN2-dependent ISR by lowering intracellular Gln levels. This finding predicts that any permutation to Gln catabolism that increases intracellular Gln concentrations would suppress ISR induction. To test this prediction, we supplemented the cells with dimethyl-α-ketoglutarate (DM-α-KG), a cell-permeable α-KG precursor. DM-α-KG is expected to bypass the energy requirement from Gln, resulting in a higher intracellular Gln level. Indeed, DM-α-KG suppressed WNT3A-induced Gln consumption, phosphorylation of GCN2, and expression of protein anabolism genes (e.g., Asns) (Figure 5, E–G). Importantly, DM-α-KG severely impaired WNT-induced osteoblast differentiation, as indicated by the loss of mineralization activity (Figure 5H). Thus, intracellular Gln deficiency, by activating ISR and downstream protein anabolism gene expression, contributes to osteoblast differentiation.
GLS inhibition suppresses WNT-induced bone formation in vivo.
Our data so far have demonstrated that WNT signaling activates Gln-dependent anaplerosis and subsequent GCN2-mediated ISR necessary for osteoblast differentiation in vitro. To test the physiological relevance of this mechanism in vivo, we first examined the expression levels of ISR targets and other anabolic genes in 2 mouse models with the WNT coreceptor LRP5 either deleted or hyperactivated. Lrp5–/– and the Lrp5A214V/+ mice have been shown to recapitulate human osteoporosis pseudoglioma and high–bone-mass syndrome, respectively (4, 36). Real-time PCR experiments revealed that the levels of anabolic genes (e.g., Ddit3, Glyt1, and Asns) were higher in the bones of Lrp5A214V/+ mice, but lower in Lrp5–/–, when each was compared with littermate controls (Figure 6, A and B). Western blot analyses detected higher phosphorylation levels for both GCN2 and eIF2α in the Lrp5A214V/+ bone extracts than in the controls (Figure 6C). Thus, similar to the in vitro studies, hyperactive WNT signaling stimulates ISR and anabolic gene expression that positively correlates with bone formation in vivo.
Figure 6. GCN2 mediates WNT-induced bone anabolism in vivo.

(A and B) RT-qPCR analyses of anabolic genes in bones of WT (+/+), Lrp5A214V/+ (HBM) (A), or Lrp5–/– (–/–) (B) mice. Error bars indicate SEM. *P < 0.05, Student’s t test. n = 3. (C) Western blot analyses of ISR in bone extracts of Lrp5A214V/+ (HBM) mice. (D) Representative μCT images of trabecular bone from distal femur of 55-day-old male mice. BV/TV (± SD) is listed below each image. *P < 0.05 compared with WT; ^P < 0.05 compared with Lrp5A214V/+, Student’s t test. n = 5, 8, 8, and 8, respectively. See Table 1 for additional quantification. (E and F) Representative plastic sections of the distal femur stained with Goldner’s trichrome (F) or unstained calcein double-labeled sections (G) from 55-day-old male mice. Yellow arrows denote the borders of osteoid (stained dark red).
To determine the role of GCN2-dependent ISR in WNT-induced bone anabolism in vivo, we examined the effect of Gcn2 deletion on the high–bone-mass phenotype caused by the Lrp5A214V mutation in mice. According μCT analyses, Gcn2 deletion in the WT background had no discernible effect on trabecular bone mass (BV/TV) in either sex at 55 days of age, although it mildly reduced the trabecular thickness (Tb.Th) specifically in females (Figure 6D and Table 1). However, Gcn2 deletion in the Lrp5A214V/+ background (Lrp5A214V/+ Gcn2–/–) markedly reduced BV/TV, Tb.Th, and bone mineral density (BMD) in both males and females, even though those parameters remained higher than levels in WT or Gcn2–/– (Figure 6D and Table 1). On the other hand, GCN2 removal did not affect the cortical bone in either the WT or Lrp5A214V/+ background (Table 1). Moreover, Gcn2 deletion did not affect overall bone resorption in either background, as indicated by serum C-terminal telopeptide type I collagen (CTX) levels, a direct readout of osteoclast activity (Table 1). Thus, GCN2 contributes to the excessive trabecular bone formation in response to hyperactive LRP5 signaling.
Table 1.
Bone parameters in Lrp5A214V/+ Gcn2–/– mice
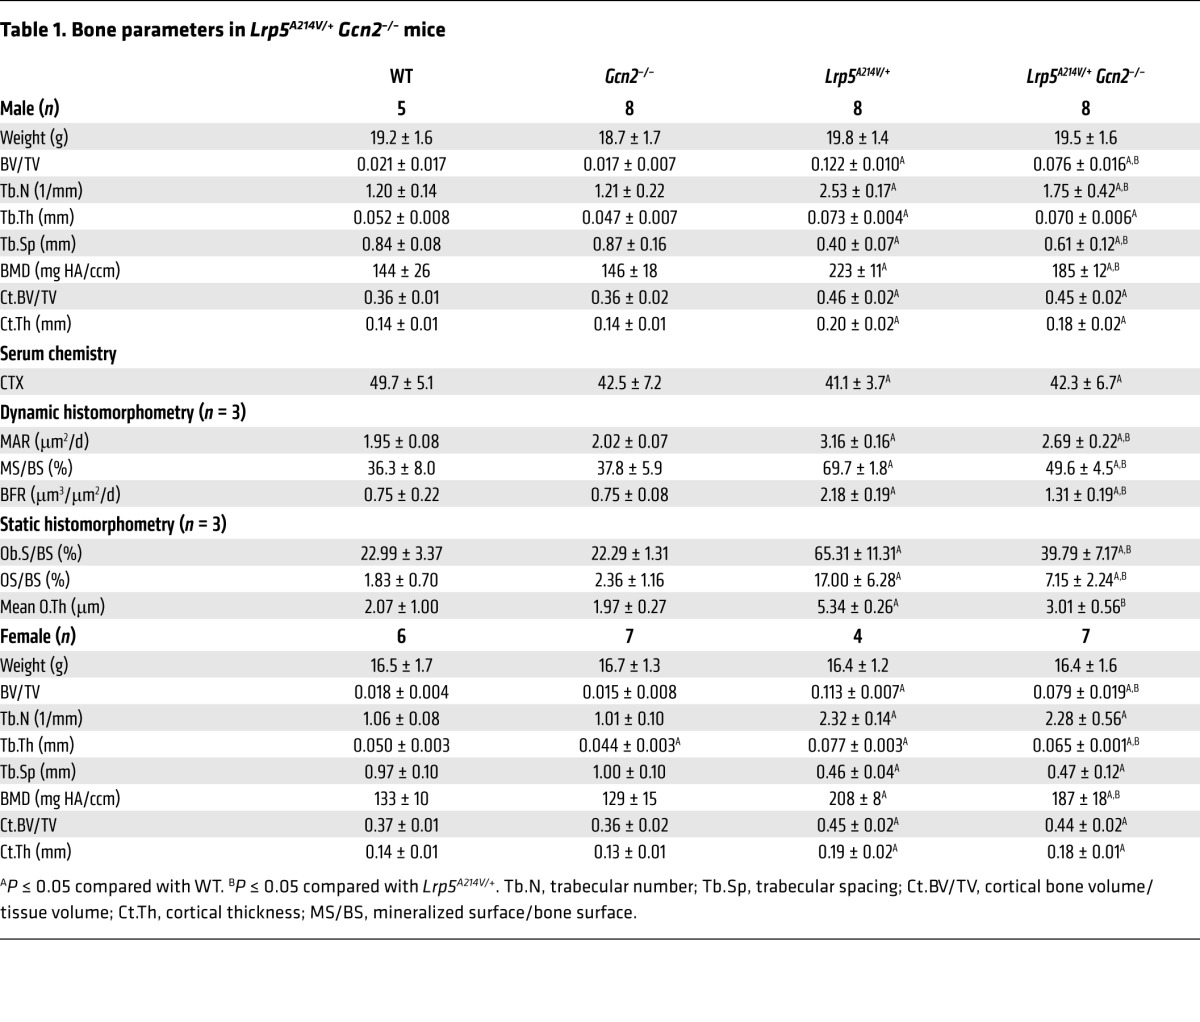
We next evaluated the effect of GCN2 ablation on trabecular osteoblast number and activity by histomorphometry. We chose to focus on the male mice in these studies. Consistent with previous findings, Lrp5A214V/+ animals had significantly greater osteoblast coverage (Ob.S/BS) than the WT control. GCN2 ablation significantly reduced Ob.S/BS in the Lrp5A214V/+ background (compare Lrp5A214V/+ Gcn2–/– with Lrp5A214V/+), even though it did not have an effect on its own (compare Gcn2–/– with WT) (Table 1). Additionally, consistent with more active osteoblasts, the trabecular bone surface in Lrp5A214V/+ animals exhibited greater osteoid surface (OS/BS) and osteoid thickness (O.Th) when compared with the WT control (Figure 6E and Table 1). Importantly, both osteoid parameters were significantly decreased in Lrp5A214V/+ Gcn2–/– mice (Figure 6E and Table 1). Furthermore, Gcn2 deletion significantly decreased both mineral apposition rate (MAR) and bone formation rate (BFR) in Lrp5A214V/+ mice, even though both parameters remained higher than those in the WT or Gcn2–/– mice (Figure 6F and Table 1). Thus, GCN2 is required for robust osteoblast activity in response to hyperactive WNT signaling in vivo.
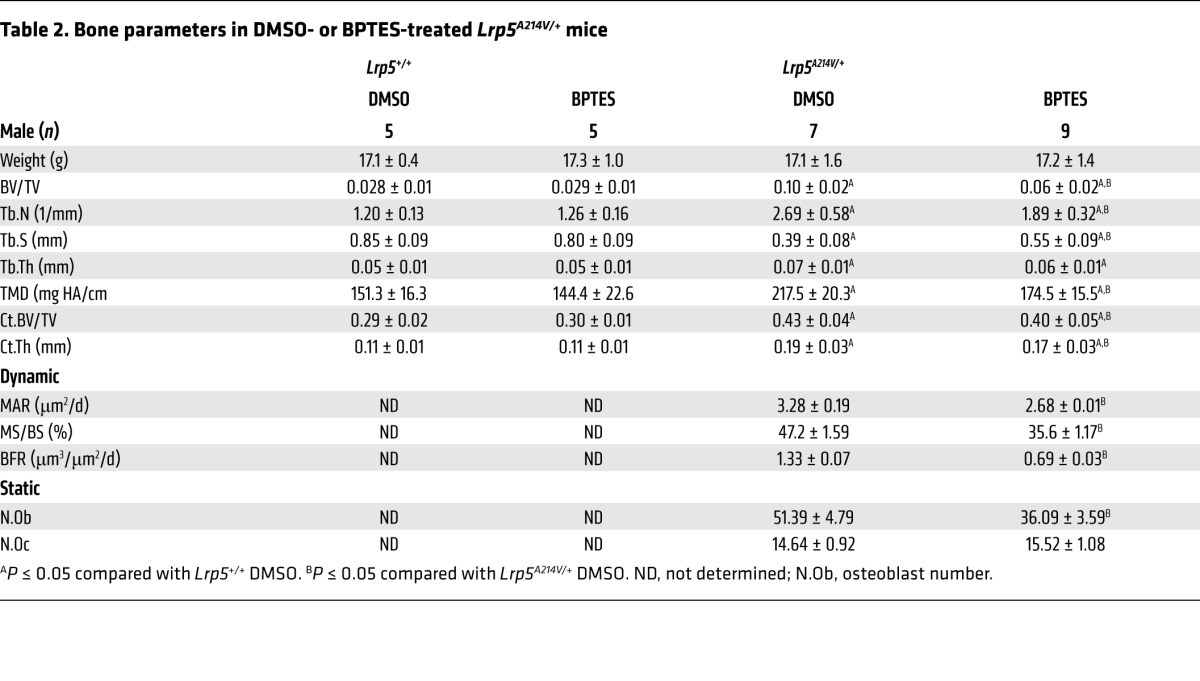
Finally, to test the role of Gln catabolism in WNT-induced bone anabolism in vivo, we treated WT or Lrp5A214V/+ mice with the GLS inhibitor BPTES for 30 days (starting at postnatal day 15) and evaluated the effect on bone mass accrual. BPTES treatment did not affect the body weight of the mice with either genotype, nor did it affect bone mass in the WT animals (Figure 7, A and B, and Table 2). However, BPTES notably decreased bone mass in both trabecular and cortical compartments of the Lrp5A214V mice, as evidenced by x-ray and μCT imaging (Figure 7, A and B, and Table 2). Quantification of the μCT data confirmed that BV/TV and BMD were significantly reduced by BPTES, coupled with lower trabecular numbers and increased trabecular spacing (Table 2). Similarly, BPTES suppressed cortical BV/TV, thickness, and TMD (Table 2). Decreased bone mass was not due to changes in bone resorption, as the number of TRAP-positive osteoclasts (N.Oc), osteoclast surface (Oc.S), and serum CTX levels were all unchanged by BPTES (Table 2). In contrast, BPTES significantly reduced osteoblast activity, as evidenced by decreased MAR and BFR (Figure 7C and Table 2). Furthermore, BPTES markedly reduced the mRNA expression of a host of anabolic genes, including Ddit3, Glyt1, and Tars, indicating suppression of bone anabolic capacity (Figure 7D). In contrast, BPTES did not affect the expression of Sp7, a critical osteogenic transcription factor. Overall, the data support a model wherein WNT signaling stimulates Gln-dependent anaplerosis that, in addition to providing energy, activates GCN2-dependent ISR to increase the translational capacity necessary for bone anabolism (Figure 7E).
Figure 7. Gln metabolism mediates WNT-induced bone anabolism in vivo.

(A and B) μCT images of trabecular (A) or cortical bone (B) from hind limbs of Lrp5A214V/+ mice treated with DMSO or BPTES. BV/TV (± SD) is listed below each image. aP < 0.05 compared with WT; bP < 0.05 compared with Lrp5A214V/+, Student’s t test. n = 5, 5, 7, and 9, respectively. See Table 2 for additional quantification. (C) Representative calcein double-labeled sections of the distal femur from 45-day-old Lrp5A214V/+ mice treated with DMSO or BPTES. (D) RT-qPCR analyses of gene expression in bones of Lrp5A214V/+ mice treated with DMSO or BPTES. Error bars indicate SEM. *P < 0.05, Student’s t test. n = 3. (E) Graphical representation of the model for how WNT-induced Gln metabolism facilitates protein synthesis. Glc, glucose; Q, glutamine.
Table 2.
Bone parameters in DMSO- or BPTES-treated Lrp5A214V/+ mice
Discussion
We have uncovered a mechanism through which cells respond to both energetic and synthetic needs necessary for increased protein synthesis. At the core of the mechanism is Gln-dependent anaplerosis, which not only provides ATP, but also activates the ISR pathway, resulting in the induction of genes directly contributing to protein translation. Importantly, the anabolic mechanism directly responds to WNT signaling during osteoblast differentiation, thus providing a clear example that developmental signals can modulate cellular metabolism to influence cell fate.
The present work provides insights into the mechanism through which WNT signaling stimulates bone formation. Our previous studies have shown that WNT functions through multiple downstream effectors, including β-catenin and mTORC1, to promote bone formation (7, 10, 15). Those studies however, did not identify a direct link between the various signaling cascades and specific aspects of the osteoblast identity. In the current study, we provide evidence that WNT/mTORC1 signaling stimulates the expression of protein anabolism genes during osteoblast differentiation. In this regulation, mTORC1-mediated increase in protein synthesis triggers greater consumption of Gln to produce more energy via the TCA cycle. The increased Gln metabolism reduces intracellular Gln levels, resulting in activation of GCN2 and ATF4. Consequently, many genes responsible for amino acid transport, synthesis, and tRNA aminoacylation are induced to support further protein synthesis. It is important to note that upregulation of the protein anabolism genes is integral to the osteoblast identity, as disruption of this induction by ATF4 or GCN2 knockdown leads to failure in osteoblast differentiation in response to WNT. Thus, WNT/mTORC1 signaling contributes to osteoblast differentiation by directly increasing protein synthesis and indirectly activating genes responsible for more active protein synthesis.
We identify GCN2-mediated ISR as the main inducer of protein anabolism genes in osteoblasts. Gln-mediated ISR in response to increased protein synthesis may be an adaptive mechanism to improve translational fitness and to buffer against PERK-mediated ER stress. Our study does not exclude a role for ER stress response in supporting full osteoblast activity. In fact, considering that Gcn2 deletion did not impair normal bone mass accrual in our analyses, but that Perk deletion was reported to cause osteopenia, it is likely that the 2 molecules respond to distinct physiological stimuli to augment the translational capacity in osteoblasts (22). Moreover, since Gcn2 deletion did not seem to reduce cortical bone formation in Lrp5A214V/+ mice (Table 1), it is possible that PERK plays a compensatory role in cortical osteoblasts.
In our system, GCN2 appears to respond mainly to the intracellular deficiency of Gln. It is remarkable that an increase in protein synthesis leads to a disproportionately large consumption of a single amino acid over all the other amino acids examined. This likely reflects the unique versatility of Gln, not only as a carbon and nitrogen donor for biosynthesis, but also as an energy source through TCA metabolism. Our data indicate that increased Gln-dependent anaplerosis, in addition to direct incorporation into polypeptide chains as well as carbon and nitrogen donation for biosynthesis, is the main reason for the decrease in intracellular Gln levels. The increased anaplerosis is likely driven in response to a greater energy demand from protein synthesis, as indicated by the transient activation of AMPK. Others recently showed that mTORC1 stimulated Gln catabolism by suppressing the enzyme SIRT4, which regulates GDH activity through poly-ADP ribosylation (37). However, we found no change in Sirt4 mRNA or protein levels in response to WNT3A, nor did we detect any effect on GDH levels or activity (data not shown). Moreover, WNT3A did not alter either intracellular glutamate concentration or overall glutamate consumption, as would be expected if GDH activity were affected (Supplemental Figure 2 and not shown). On the other hand, the protein levels of GLS increased in response to WNT3A, implicating GLS as a potential target of regulation. However, future experiments are necessary to test this possibility.
Our studies of WNT-induced bone anabolism have revealed metabolic changes strikingly similar to those observed in cancer cells. In cancer cells, aerobic glycolysis and hyperactive Gln metabolism have been proposed as providing metabolic intermediates and energy necessary for cell proliferation (30, 38, 39). We have previously reported that WNT induces aerobic glycolysis during osteoblast differentiation (27). Here, we show that WNT stimulates Gln metabolism to fulfill the energetic and synthetic needs associated with increased protein synthesis. The parallel metabolic changes between cancer and osteoblast differentiation indicate that reprogramming the use of glucose and Gln may be a common strategy for cells to meet increased biosynthetic needs. It should be noted however, that much is yet to be learned about how metabolic changes contribute to cell differentiation. For instance, increased aerobic glycolysis and TCA-cycle anaplerosis may alter the levels of intermediate metabolites that participate in epigenetic regulation of gene expression, but such metabolites are yet to be identified. Despite the limitations, our experiment with GLS inhibition has provided a proof of principle that direct manipulation of cellular metabolism may represent a promising approach for treating bone disorders.
Methods
Mouse strains.
Lrp5A214V/+, Lrp5–/–, and Gcn2–/– mouse strains are as previously described (4, 36, 40).
Cell culture.
ST2 cells were cultured in α-MEM (Gibco; Life Technologies) supplemented with 10% FBS (Invitrogen), 5 mM glucose, and 2 mM Gln. All experiments were carried out at a seeding density of 13,000 cells/cm2. WNT treatments were initiated 24 hours after plating by replacing the medium with α-MEM supplemented with 50 ng/ml WNT3A (R&D) or vehicle control (0.1% Chaps in PBS). In indicated experiments, growth medium was supplemented with 100 nM Torin1 (Sigma-Aldrich), 5 mM DM-α-KG (Sigma-Aldrich), 10 μM BPTES (Sigma-Aldrich), RPMI without Gln (Gibco; Life Technologies), or 5 μg/ml cyclohexamide (Sigma-Aldrich). For experiments using Torin1, cells were pretreated for 30 minutes before treatment with 50 ng/ml WNT3A and the respective compound. For Gln or other amino acid supplementation experiments, every 24 hours, media were collected and pooled, resupplemented to the indicated concentration, and finally added back to the cells. For WNT3A-induced mineralization, cells were treated with WNT3A with or without the other reagents as indicated for 72 hours and then further incubated in mineralization medium (α-MEM supplemented with 50 mg/ml ascorbic acid [Sigma-Aldrich] and 10 mM β-glycerophosphate [Sigma-Aldrich]) for 6 days. The medium was changed every 72 hours. Mineralization was assayed by von Kossa staining. Alkaline phosphatase activity assays were performed as previously described (41).
Overexpression of dnTCF4, WNT7B, or WNT10B.
ST2 cells were infected with retroviral vectors expressing either empty vector (IE) or dnTCF4, WNT7B, or WNT10B for 12 hours, followed by a 12-hour recovery. The viruses were constructed as previously described (7, 34)
shRNA knockdowns.
Lentiviral vectors were obtained from the shRNA consortium at Washington University School of Medicine. The shRNA sequences are listed in Supplemental Table 2. The lentiviral vector pLKOpuro was modified to express shRNAs targeting β-catenin, ATF4, PERK, GCN2, rictor, or LacZ or GFP as negative controls. The shRNA-expressing lentiviral vector was cotransfected with plasmids pMD2.g and psPax2 into 293 cells. Virus-containing media were collected and filtered. ST2 cells were plated at 13,000 cells/cm2 and infected for 12 hours and then recovered for 36 hours in regular media prior to further treatment. Viral-infected ST2 cells displayed a delayed and blunted ISR induction in response to WNT3A compared with uninfected ST2 cells. As a result, in all knockdown experiments, anabolic gene expression and ISR induction were assayed after 96 hours of WNT3A treatment instead of the 72 hours normally done with uninfected ST2 cells. All knockdown results were confirmed by 2 or more unrelated shRNA constructs.
RNA isolation and RT-qPCR.
Total RNA was isolated from cultured cells using the RNeasy Kit with on-column DNase treatment (QIAGEN). For in vivo gene expression analyses, total RNA was isolated from tibia and femur pulverized with Dismembranator in liquid nitrogen by using Trizol followed by the RNeasy Kit. Reverse transcription was performed using either 100 ng (cells) or 300 ng (bone extracts) total RNA with the iScript cDNA Synthesis Kit (Bio-Rad). Reactions were set up in technical and biological triplicate in a 96-well format on an ABI StepOne Plus, using SYBR Green chemistry (SsoAdvanced; Bio-Rad). The PCR conditions were 95°C for 3 minutes, followed by 40 cycles of 95°C for 10 seconds and 60°C for 30 seconds. Gene expression was normalized to 18S rRNA, and relative expression was calculated using the 2–(ΔΔCt) method. Primers were used at 0.1 μM, and their sequences are listed in Supplemental Table 1. PCR efficiency was optimized and melting curve analyses of products were performed to ensure reaction specificity.
Gln consumption assays.
ST2 cells cultured to confluency were incubated in α-MEM medium containing 5 mM glucose and 2 mM Gln for 12 hours and then switched to fresh medium containing 5 mM glucose and 2 mM Gln plus the indicated compounds for the indicated times. Gln concentration in the medium was measured using the Gln glutamate determination kit (Sigma-Aldrich) per the manufacturer’s instructions. Each experiment was repeated a minimum of 4 times.
GLS activity assay.
ST2 cells cultured to confluency were incubated in α-MEM medium containing 5 mM glucose and 2 mM Gln for 12 hours and then switched to fresh medium containing 5 mM glucose, 2 mM Gln, and 50 ng/ml rWNT3A for 6 hours. Cells were washed 3 times with HBSS and cultured for 20 minutes in α-MEM medium containing 5 mM glucose, 2 μM Gln, and 4 μCi/ml glutamine, L (2,3,4-3H) (ART0149a). GLS activity was terminated by washing 3 times with ice-cold HBSS and scraping cells in 1 ml ice-cold milliQ water. Cells were lysed by sonication for 1 minute, with 1-second pulses at 20% amplitude. After clarification, cell lysates were bound onto AG 1-X8 polyprep anion exchange columns (Bio-Rad). Uncharged Gln was eluted with three 2-ml volumes of water. Glutamate and metabolites were eluted with three 2-ml volumes of 0.1 M HCl. Eluent fractions were collected and combined with 4 ml scintillation cocktail, and DPM was measured using a Beckman LS6500 Scintillation Counter.
Western blotting.
ST2 cells were scraped in lysis buffer containing 50 mM Tris (pH 7.4), 15 mM NaCl, 0.5% NP-40, 0.1% SDS, 0.1% sodium deoxycholate, and a protease and phosphatase inhibitor mix (Roche). Bone Western blot analyses were performed with extracts from tibia and femur that were pulverized in liquid nitrogen after the epiphysis was removed and the marrow flushed. Protein concentration was measured with the BCA method (Pierce). Proteins (20 μg) were resolved on 12% polyacrylamide gel, transferred onto a 0.45-μM pore PVDF Immobilon-P membrane (Millipore), and detected with specific antibodies: β-actin (Cell Signaling, no. 4970), α-tubulin (Santa Cruz Biotechnology Inc., TU-02, no. sc-8035), GCN2 (Cell Signaling, no. 3302), P-T898 GCN2 (Cell Signaling, no. 3301), P-S51 eIF2α (Cell Signaling, no. 9721), eIF2α (Cell Signaling, no. 2103), DDIT3/CHOP (Cell Signaling, no. 2895), ATF4/CREB2 (Santa Cruz Biotechnology Inc., C-20, no. sc-200), β-catenin (Santa Cruz Biotechnology Inc., H-102, no. sc7199), AMPK (Cell Signaling, no. 2532), P-T172 AMPK (Cell Signaling, no. 2531), GLS (ProteinTech, no. 12855-1-AP), S6 (Cell Signaling, no. 2217), P-S6 (Cell Signaling, no. 2211), P-S65 4EBP1 (Cell Signaling, no. 9451), 4EBP1 (Cell Signaling, no. 9452), rictor (Cell Signaling, no. 2140), P-S473 AKT (Cell Signaling, no. 9271), and AKT(Cell Signaling, no. 9272). The membranes were blocked for 1 hour at room temperature in 5% BSA (Roche) in TBS containing 0.1% Tween, followed by an overnight incubation at 4°C with the primary antibody. ATF4 immunoblots were blocked overnight at 4°C in 7% milk (TBS, 0.1% Tween) followed by overnight incubation with antibody at 4°C in 5% milk. Membranes were then washed 3 times with TBS/Tween 0.1% and further incubated with the secondary antibody, HRP conjugate goat anti-rabbit (Santa Cruz Biotechnology Inc., no. sc-2370), or anti-mouse (Santa Cruz Biotechnology Inc., no. sc-2031) in 5% BSA (TBS/Tween 0.1%) for 1 hour at room temperature. All blots were developed using the Clarity Substrate Kit (Bio-Rad). Each experiment was repeated with a minimum of 3 independently prepared protein samples.
Metabolic labeling.
ST2 cells were seeded at 2.5 × 10⁵ cells in 6-cm plates and cultured for 36 hours prior to treatment, followed by 2 washes with cysteine/methionine-free medium and incubation in labeling medium (10% dialyzed FBS, 165 μCi EasyTag EXPRESS 35S mix) for 30 minutes. Cells were then washed twice with ice-cold PBS and scraped in RIPA buffer. Soluble lysates were spotted on Whatman paper and precipitated in 5% TCA followed by two 5-minute washes in 10% TCA, two 2-minute washes in 100% ethanol, and one 2-minute wash in acetone. Filters were air-dried and 35S incorporation was measured using a Beckman LS6500 Scintillation counter and normalized to cell number.
Analyses of mice.
Radiographs of mouse skeleton were generated using a Faxitron x-ray system (Faxitron X-ray Corp.) with 20-second exposure under 25 kV. Microcomputed tomography (μCT 40, Scanco Medical AG) was used for 3D reconstruction and quantification of bone parameters (threshold set at 200) from 100 slices underneath the growth plate. Serum CTX assays were conducted with mice starved for 6 hours with the RatLaps ELISA Kit (Immunodiagnostic Systems Ltd.). Bone histomorphometry was performed on femurs fixed in 10% buffered formalin overnight at room temperature, followed by decalcification in 14% EDTA with change every 2 days for 2 weeks. After decalcification, bones were embedded in paraffin and sectioned at 6-μm thickness. H&E and TRAP staining were performed following standard protocols. For dynamic histomorphometry, mice were injected with calcein (20 mg/kg) intraperitoneally at 7 and 2 days prior to sacrifice. Bones were fixed overnight in 50% ethanol and dehydrated prior to embedding in methyl-methacrylate for plastic sections. Von Kossa and Goldner’s Trichrome staining were performed on methyl-methacrylate–embedded sections following standard protocols. Both static and dynamic histomorphometry were performed using Bioquant II. Mice treated with BPTES were injected intraperitoneally with 0.2 g/kg body weight BPTES (in DMSO) or DMSO as a control every other day beginning at postnatal day 15 for 30 days.
Metabolomic studies.
ST2 cells cultured to confluency on 15-cm plates were incubated with fresh α-MEM medium containing 5 mM glucose, 2 mM Gln, and 50 ng/ml of recombinant WNT3A or vehicle for 6 or 24 hours. At the end of incubation, cells were washed with and then scraped in ice-cold PBS before centrifugation. The cell pellets were immediately frozen and later shipped on dry ice to Metabolon Inc. for analyses. Five biological replicates (each approximately 8 × 10⁶ cells) were prepared for each condition. The cells were extracted and subjected to GC/MS and LC/MS/MS analyses per the Metabolon pipeline. A total of 208 metabolites with known identity were detected. The relative abundance of each metabolite was normalized to DNA content.
GC/MS analyses of Gln conversion to citrate.
At the end of 6, 12, or 24 hours of WNT3A treatment, [U-13C5] glutamine was added to the medium at a final concentration of 0.2 mM and incubated for 1 hour. At the end of the incubation, the cells were washed with cold PBS and extracted 3 times with –80°C methanol on dry ice. Duplicate analyses were performed with each of the triplicate samples for each condition. Extracts were dried in a centrifugal concentrator (Savant SpeedVac; Thermo Scientific) and derivatized at 70°C, 30 minutes, with 1:1 acetonitrile:N-methyl-N(tert-butyldimethylsilyl)-trifluoroacetamide to make tert-butyldimethylsilyl (tBDMS) derivatives of Gln and citrate. GC-MS/EI analyses were performed with Hewlett-Packard 6890 series gas chromatograph interfaced to an Agilent 5973N mass spectrometer, as described previously (27). Isotopomer distributions were measured by electron impact ionization for tBDMS derivative of Gln (m/z 431-436, 438) and citrate (m/z 591-596). All isotopomer distributions were corrected for natural abundance and for spectral overlap (42).
Statistics.
Statistical significance was determined by 2-tailed Student’s t test, with a P value of less than 0.05 considered statistically significant. In the case of individual metabolite abundance, Welch’s 2-sample t test was used to identify biochemicals that differed significantly between the groups.
Study approval.
The Animal Studies Committee at Washington University approved all mouse procedures.
Supplementary Material
Acknowledgments
This work is supported by NIH grants R01 AR060456, R01 DK065789 (to F. Long), F32 AR060674 (to C.M. Karner), P30 AR057235 (Washington University Musculoskeletal Research Center), and P30 DK056341 (Washington University Nutrition Obesity Research Center).
Footnotes
Conflict of interest: The authors have declared that no conflict of interest exists.
Reference information:J Clin Invest. 2015;125(2):551–562. doi:10.1172/JCI78470.
References
- 1.Long F. Building strong bones: molecular regulation of the osteoblast lineage. Nat Rev Mol Cell Biol. 2012;13(1):27–38. doi: 10.1038/nrm3254. [DOI] [PubMed] [Google Scholar]
- 2.Angers S, Moon RT. Proximal events in Wnt signal transduction. Nat Rev Mol Cell Biol. 2009;10(7):468–477. doi: 10.1038/nrm2717. [DOI] [PubMed] [Google Scholar]
- 3.MacDonald BT, He X. Frizzled and LRP5/6 receptors for Wnt/beta-catenin signaling. Cold Spring Harb Perspect Biol. 2012;4(12):a007880. doi: 10.1101/cshperspect.a007880. [DOI] [PMC free article] [PubMed] [Google Scholar]
- 4.Cui Y, et al. Lrp5 functions in bone to regulate bone mass. Nat Med. 2011;17(6):684–691. doi: 10.1038/nm.2388. [DOI] [PMC free article] [PubMed] [Google Scholar]
- 5.Kato M, et al. Cbfa1-independent decrease in osteoblast proliferation, osteopenia, and persistent embryonic eye vascularization in mice deficient in Lrp5, a Wnt coreceptor. J Cell Biol. 2002;157(2):303–314. doi: 10.1083/jcb.200201089. [DOI] [PMC free article] [PubMed] [Google Scholar]
- 6.Gong Y, et al. LDL receptor-related protein 5 (LRP5) affects bone accrual and eye development. Cell. 2001;107(4):513–523. doi: 10.1016/S0092-8674(01)00571-2. [DOI] [PubMed] [Google Scholar]
- 7.Hu H, Hilton MJ, Tu X, Yu K, Ornitz DM, Long F. Sequential roles of Hedgehog and Wnt signaling in osteoblast development. Development. 2005;132(1):49–60. doi: 10.1242/dev.01564. [DOI] [PubMed] [Google Scholar]
- 8.Joeng KS, Schumacher CA, Zylstra-Diegel CR, Long F, Williams BO. Lrp5 and Lrp6 redundantly control skeletal development in the mouse embryo. Dev Biol. 2011;359(2):222–229. doi: 10.1016/j.ydbio.2011.08.020. [DOI] [PMC free article] [PubMed] [Google Scholar]
- 9.Rodda SJ, McMahon AP. Distinct roles for Hedgehog and canonical Wnt signaling in specification, differentiation and maintenance of osteoblast progenitors. Development. 2006;133(16):3231–3244. doi: 10.1242/dev.02480. [DOI] [PubMed] [Google Scholar]
- 10.Chen J, Long F. β-Catenin promotes bone formation and suppresses bone resorption in postnatal growing mice. J Bone Miner Res. 2013;28(5):1160–1169. doi: 10.1002/jbmr.1834. [DOI] [PMC free article] [PubMed] [Google Scholar]
- 11.Day TF, Guo X, Garrett-Beal L, Yang Y. Wnt/β-catenin signaling in mesenchymal progenitors controls osteoblast and chondrocyte differentiation during vertebrate skeletogenesis. Dev Cell. 2005;8(5):739–750. doi: 10.1016/j.devcel.2005.03.016. [DOI] [PubMed] [Google Scholar]
- 12.Hill TP, Spater D, Taketo MM, Birchmeier W, Hartmann C. Canonical Wnt/β-catenin signaling prevents osteoblasts from differentiating into chondrocytes. Dev Cell. 2005;8(5):727–738. doi: 10.1016/j.devcel.2005.02.013. [DOI] [PubMed] [Google Scholar]
- 13.Song L, Liu M, Ono N, Bringhurst FR, Kronenberg HM, Guo J. Loss of wnt/β-catenin signaling causes cell fate shift of preosteoblasts from osteoblasts to adipocytes. J Bone Miner Res. 2012;27(11):2344–2358. doi: 10.1002/jbmr.1694. [DOI] [PMC free article] [PubMed] [Google Scholar]
- 14.Inoki K, et al. TSC2 integrates Wnt and energy signals via a coordinated phosphorylation by AMPK and GSK3 to regulate cell growth. Cell. 2006;126(5):955–968. doi: 10.1016/j.cell.2006.06.055. [DOI] [PubMed] [Google Scholar]
- 15.Chen J, et al. WNT7B promotes bone formation in part through mTORC1. PLoS Genet. 2014;10(1):e1004145. doi: 10.1371/journal.pgen.1004145. [DOI] [PMC free article] [PubMed] [Google Scholar]
- 16.Zoncu R, Efeyan A, Sabatini DM. mTOR: from growth signal integration to cancer, diabetes and ageing. Nat Rev Mol Cell Biol. 2011;12(1):21–35. doi: 10.1038/nrm3025. [DOI] [PMC free article] [PubMed] [Google Scholar]
- 17.Harding HP, Calfon M, Urano F, Novoa I, Ron D. Transcriptional and translational control in the Mammalian unfolded protein response. Annu Rev Cell Dev Biol. 2002;18:575–599. doi: 10.1146/annurev.cellbio.18.011402.160624. [DOI] [PubMed] [Google Scholar]
- 18.Wek RC, Jiang HY, Anthony TG. Coping with stress: eIF2 kinases and translational control. Biochem Soc Trans. 2006;34(pt 1):7–11. doi: 10.1042/BST20060007. [DOI] [PubMed] [Google Scholar]
- 19.Schroder M, Kaufman RJ. The mammalian unfolded protein response. Annu Rev Biochem. 2005;74:739–789. doi: 10.1146/annurev.biochem.73.011303.074134. [DOI] [PubMed] [Google Scholar]
- 20.Han J, et al. ER-stress-induced transcriptional regulation increases protein synthesis leading to cell death. Nat Cell Biol. 2013;15(5):481–490. doi: 10.1038/ncb2738. [DOI] [PMC free article] [PubMed] [Google Scholar]
- 21.Yang X, et al. ATF4 is a substrate of RSK2 and an essential regulator of osteoblast biology; implication for Coffin-Lowry Syndrome. Cell. 2004;117(3):387–398. doi: 10.1016/S0092-8674(04)00344-7. [DOI] [PubMed] [Google Scholar]
- 22.Saito A, et al. Endoplasmic reticulum stress response mediated by the PERK-eIF2(alpha)-ATF4 pathway is involved in osteoblast differentiation induced by BMP2. J Biol Chem. 2011;286(6):4809–4818. doi: 10.1074/jbc.M110.152900. [DOI] [PMC free article] [PubMed] [Google Scholar]
- 23.Tohmonda T, et al. The IRE1α-XBP1 pathway is essential for osteoblast differentiation through promoting transcription of Osterix. EMBO Rep. 2011;12(5):451–457. doi: 10.1038/embor.2011.34. [DOI] [PMC free article] [PubMed] [Google Scholar]
- 24.Murakami T, et al. Signalling mediated by the endoplasmic reticulum stress transducer OASIS is involved in bone formation. Nat Cell Biol. 2009;11(10):1205–1211. doi: 10.1038/ncb1963. [DOI] [PubMed] [Google Scholar]
- 25.Wei J, Sheng X, Feng D, McGrath B, Cavener DR. PERK is essential for neonatal skeletal development to regulate osteoblast proliferation and differentiation. J Cell Physiol. 2008;217(3):693–707. doi: 10.1002/jcp.21543. [DOI] [PubMed] [Google Scholar]
- 26.Buttgereit F, Brand MD. A hierarchy of ATP-consuming processes in mammalian cells. Biochem J. 1995;312(pt 1):163–167. doi: 10.1042/bj3120163. [DOI] [PMC free article] [PubMed] [Google Scholar]
- 27.Esen E, Chen J, Karner CM, Okunade AL, Patterson BW, Long F. WNT-LRP5 signaling induces Warburg effect through mTORC2 activation during osteoblast differentiation. Cell Metab. 2013;17(5):745–755. doi: 10.1016/j.cmet.2013.03.017. [DOI] [PMC free article] [PubMed] [Google Scholar]
- 28.Warburg O. On the origin of cancer cells. Science. 1956;123(3191):309–314. doi: 10.1126/science.123.3191.309. [DOI] [PubMed] [Google Scholar]
- 29.Vander Heiden MG, Cantley LC, Thompson CB. Understanding the Warburg effect: the metabolic requirements of cell proliferation. Science. 2009;324(5930):1029–1033. doi: 10.1126/science.1160809. [DOI] [PMC free article] [PubMed] [Google Scholar]
- 30.DeBerardinis RJ, et al. Beyond aerobic glycolysis: transformed cells can engage in glutamine metabolism that exceeds the requirement for protein and nucleotide synthesis. Proc Natl Acad Sci U S A. 2007;104(49):19345–19350. doi: 10.1073/pnas.0709747104. [DOI] [PMC free article] [PubMed] [Google Scholar]
- 31.Biltz RM, Letteri JM, Pellegrino ED, Palekar A, Pinkus LM. Glutamine metabolism in bone. Miner Electrolyte Metab. 1983;9(3):125–131. [PubMed] [Google Scholar]
- 32.Brown PM, Hutchison JD, Crockett JC. Absence of glutamine supplementation prevents differentiation of murine calvarial osteoblasts to a mineralizing phenotype. Calcif Tissue Int. 2011;89(6):472–482. doi: 10.1007/s00223-011-9537-6. [DOI] [PubMed] [Google Scholar]
- 33.Chen J, et al. WNT7B promotes bone formation in part through mTORC1. PLoS Genet. 2014;10(1):e1004145. doi: 10.1371/journal.pgen.1004145. [DOI] [PMC free article] [PubMed] [Google Scholar]
- 34.Tu X, et al. Noncanonical Wnt signaling through G protein-linked PKCΔ activation promotes bone formation. Dev Cell. 2007;12(1):113–127. doi: 10.1016/j.devcel.2006.11.003. [DOI] [PMC free article] [PubMed] [Google Scholar]
- 35.Harding HP, et al. An integrated stress response regulates amino acid metabolism and resistance to oxidative stress. Mol Cell. 2003;11(3):619–633. doi: 10.1016/S1097-2765(03)00105-9. [DOI] [PubMed] [Google Scholar]
- 36.Holmen SL, et al. Decreased BMD and limb deformities in mice carrying mutations in both Lrp5 and Lrp6. J Bone Miner Res. 2004;19(12):2033–2040. doi: 10.1359/jbmr.040907. [DOI] [PubMed] [Google Scholar]
- 37.Csibi A, et al. The mTORC1 pathway stimulates glutamine metabolism and cell proliferation by repressing SIRT4. Cell. 2013;153(4):840–854. doi: 10.1016/j.cell.2013.04.023. [DOI] [PMC free article] [PubMed] [Google Scholar]
- 38.Gao P, et al. c-Myc suppression of miR-23a/b enhances mitochondrial glutaminase expression and glutamine metabolism. Nature. 2009;458(7239):762–765. doi: 10.1038/nature07823. [DOI] [PMC free article] [PubMed] [Google Scholar]
- 39.Wise DR, et al. Myc regulates a transcriptional program that stimulates mitochondrial glutaminolysis and leads to glutamine addiction. Proc Natl Acad Sci U S A. 2008;105(48):18782–18787. doi: 10.1073/pnas.0810199105. [DOI] [PMC free article] [PubMed] [Google Scholar]
- 40.Munn DH, et al. GCN2 kinase in T cells mediates proliferative arrest and anergy induction in response to indoleamine 2,3-dioxygenase. Immunity. 2005;22(5):633–642. doi: 10.1016/j.immuni.2005.03.013. [DOI] [PubMed] [Google Scholar]
- 41.Katagiri T, et al. Bone morphogenetic protein-2 converts the differentiation pathway of C2C12 myoblasts into the osteoblast lineage. J Cell Biol. 1994;127(6):1755–1766. doi: 10.1083/jcb.127.6.1755. [DOI] [PMC free article] [PubMed] [Google Scholar]
- 42. Wolfe RR, Chinkes DL. Determination of isotope enrichment In: Isotope Tracers in Metabolic Research: Principles and Practice of Kinetics Analysis. Hoboken, New Jersey, USA: John Wiley & Sons; 2004:93–132. [Google Scholar]
Associated Data
This section collects any data citations, data availability statements, or supplementary materials included in this article.