

Abstract
BACKGROUND. Obesity is associated with insulin resistance and increased intrahepatic triglyceride (IHTG) content, both of which are key risk factors for diabetes and cardiovascular disease. However, a subset of obese people does not develop these metabolic complications. Here, we tested the hypothesis that people defined by IHTG content and insulin sensitivity as “metabolically normal obese” (MNO), but not those defined as “metabolically abnormal obese” (MAO), are protected from the adverse metabolic effects of weight gain.
METHODS. Body composition, multiorgan insulin sensitivity, VLDL apolipoprotein B100 (apoB100) kinetics, and global transcriptional profile in adipose tissue were evaluated before and after moderate (~6%) weight gain in MNO (n = 12) and MAO (n = 8) subjects with a mean BMI of 36 ± 4 kg/m2 who were matched for BMI and fat mass.
RESULTS. Although the increase in body weight and fat mass was the same in both groups, hepatic, skeletal muscle, and adipose tissue insulin sensitivity deteriorated, and VLDL apoB100 concentrations and secretion rates increased in MAO, but not MNO, subjects. Moreover, biological pathways and genes associated with adipose tissue lipogenesis increased in MNO, but not MAO, subjects.
CONCLUSIONS. These data demonstrate that MNO people are resistant, whereas MAO people are predisposed, to the adverse metabolic effects of moderate weight gain and that increased adipose tissue capacity for lipogenesis might help protect MNO people from weight gain–induced metabolic dysfunction.
TRIAL REGISTRATION. ClinicalTrials.gov NCT01184170.
FUNDING. This work was supported by NIH grants UL1 RR024992 (Clinical Translational Science Award), DK 56341 (Nutrition and Obesity Research Center), DK 37948 and DK 20579 (Diabetes Center Grant), and UL1 TR000450 (KL2 Award); a Central Society for Clinical and Translational Research Early Career Development Award; and by grants from the Longer Life Foundation and the Kilo Foundation.
Introduction
Obesity is associated with several metabolic abnormalities, including insulin resistance, dyslipidemia, and nonalcoholic fatty liver disease (NAFLD), which are important risk factors for type 2 diabetes, the metabolic syndrome, and coronary heart disease (1, 2). Data from a series of studies have demonstrated that increased intrahepatic triglyceride (IHTG) content (i.e., NAFLD) is a robust marker of metabolic dysfunction in obese people (3–6), and the amount of IHTG is directly correlated with the degree of insulin resistance in the liver, skeletal muscle, and adipose tissue (7). However, not all obese persons develop NAFLD, insulin resistance, and cardiometabolic disease. About 35% of obese adults have normal IHTG content (8), and 2%–50% of obese adults are “metabolically normal,” depending on the criteria used to define metabolic normality and the sex and age of the study cohort (9–18). Moreover, the risk of developing diabetes and future cardiovascular events is much lower in metabolically normal obese (MNO) people than in metabolically abnormal obese (MAO) people (19, 20). These observations suggest that some obese people are prone to develop alterations in fat distribution and metabolic disease, whereas others are protected from the adverse metabolic effects of weight gain and increased adiposity. However, it is also possible that MNO people are not protected, but simply require additional weight gain to develop adverse metabolic outcomes.
The purpose of this study was (a) to test the hypothesis that obese people who have normal IHTG content (MNO) will be resistant, whereas those who have increased IHTG content (MAO) will be prone, to developing adverse metabolic effects after gaining weight, and (b) to evaluate some of the putative molecular mechanisms in adipose tissue responsible for the adverse metabolic effects of weight gain. Accordingly, we evaluated hepatic, skeletal muscle, and adipose tissue insulin sensitivity (by using a 2-stage hyperinsulinemic-euglycemic clamp procedure in conjunction with stable isotopically labeled glucose and palmitate tracer infusion); hepatic lipoprotein kinetics (by infusing a stable isotopically labeled leucine tracer in conjunction with mathematical modeling); body fat distribution (by using magnetic resonance spectroscopy and imaging); and assessment of adipose tissue global transcriptional changes by microarray analyses (by obtaining s.c. adipose tissue biopsies) in obese subjects with normal (<5.6%) (21) and increased (≥10%) IHTG content, before and after they gained ~6% body weight by consuming an additional ~1,000 kcal/day of macronutrient-balanced foods obtained from selected fast-food restaurants.
Results
High-calorie diet intervention.
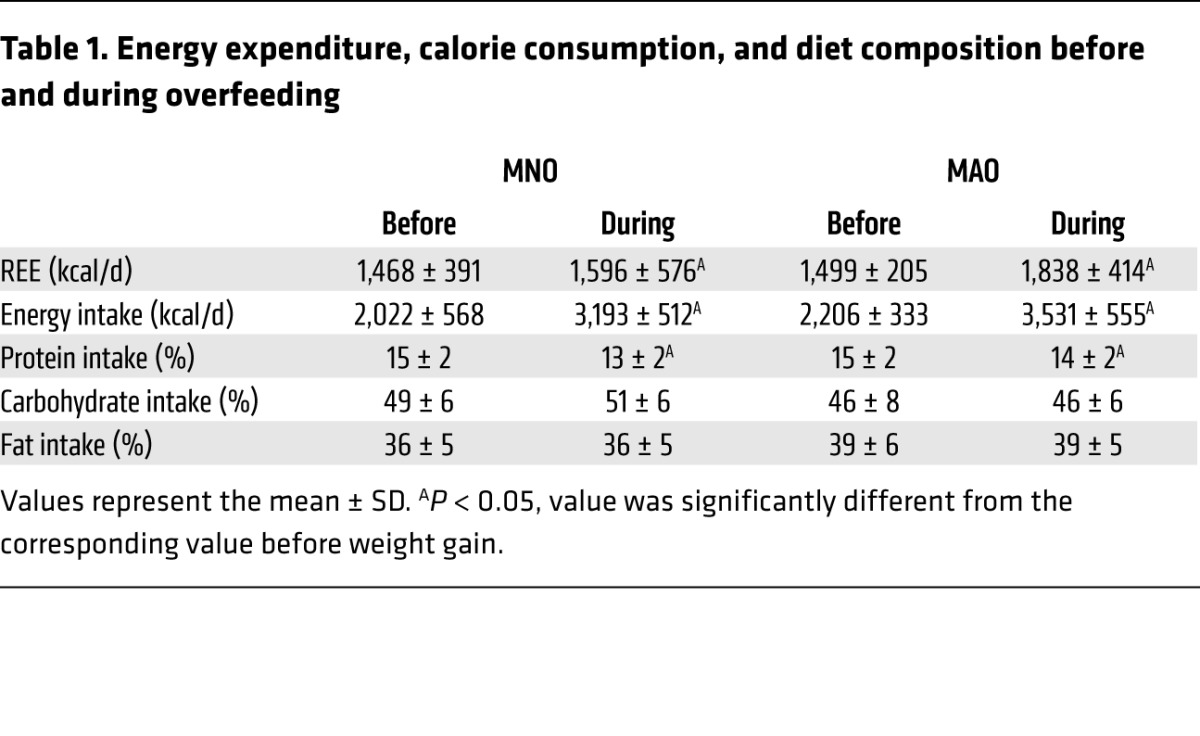
The increase in daily total energy intake during the high-calorie diet intervention was similar in the MNO and MAO groups (1,171 ± 403 kcal and 1,324 ± 522 kcal, respectively; P = 0.491) (Table 1). There was a small decrease in the percentage of calories derived from protein compared with that observed before the high-calorie diet, but the percentage of calories from carbohydrates and fat did not change significantly in either group (Table 1). Weight gain caused a similar increase in resting energy expenditure (REE) in both groups (Table 1) (P value for the intervention × group interaction = 0.216; P value for the intervention = 0.011). The targeted weight gain was achieved after about the same duration of the high-calorie diet intervention in the MNO (6.8 ± 2.7 weeks) and MAO (8.3 ± 2.4 weeks) groups (P = 0.239).
Table 1.
Energy expenditure, calorie consumption, and diet composition before and during overfeeding
Body composition.
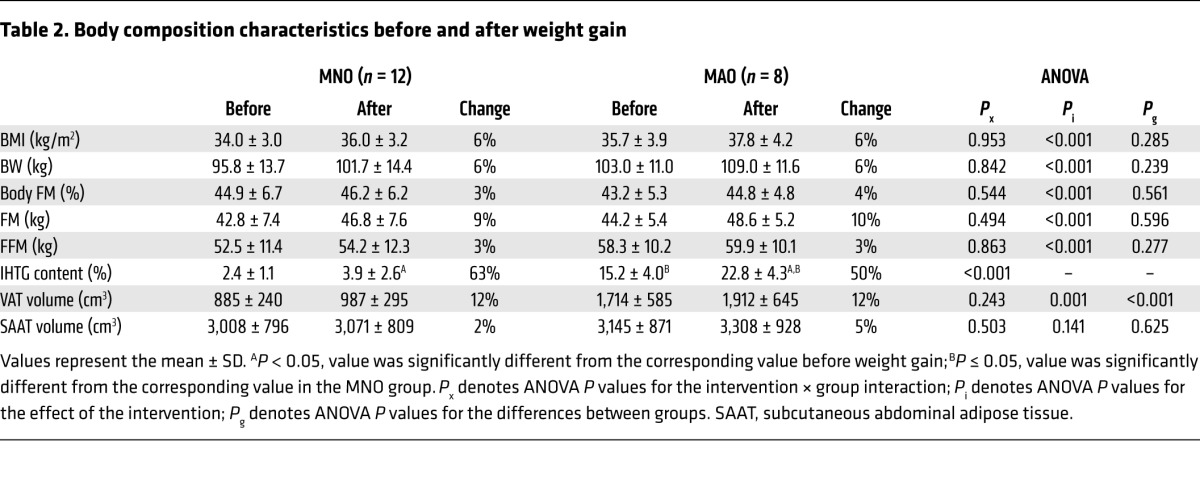
The percentage of body fat and BMI values did not differ between the MNO and MAO groups at baseline, but IHTG content and visceral adipose tissue (VAT) volume were much higher in MAO subjects than in MNO subjects (Table 2). High-calorie dietary intake caused a similar increase in body weight in MNO (mean = 6.2 ± 0.7%, range = 5.1%–7.2%) and MAO (mean = 5.8 ± 0.7%, range = 4.6%–7.0%) subjects (P = 0.307) (Table 2). The weight increase consisted of ~72% fat mass (FM) and ~28% fat-free mass (FFM) in both groups. Although the relative increase in IHTG content was similar between groups, the absolute increase was greater in MAO subjects than in MNO subjects (Table 2).
Table 2.
Body composition characteristics before and after weight gain
Metabolic characteristics.
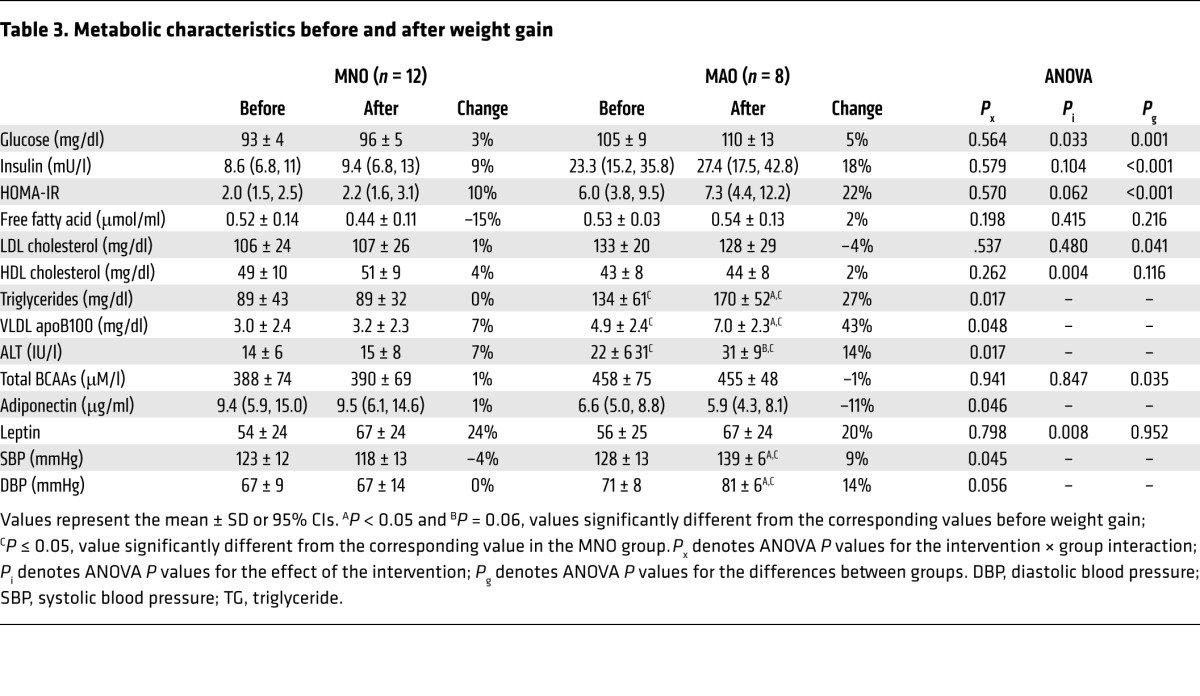
At baseline, the concentrations of homeostasis model assessment of insulin resistance (HOMA-IR), plasma glucose, insulin, LDL cholesterol, triglycerides, VLDL apolipoprotein B100 (apoB100), alanine aminotransferase (ALT), and branched-chain amino acids (BCAAs) (valine, leucine, and isoleucine) were higher in MAO subjects than in MNO subjects (Table 3). Weight gain (a) caused some cardiometabolic outcome measures (plasma triglyceride, VLDL apoB100, ALT, and adiponectin concentrations and blood pressure) to worsen in the MAO group but not in the MNO group; (b) did not cause a significant change in other metabolic variables (plasma insulin, free fatty acids, LDL cholesterol, HDL cholesterol, and BCAA concentrations) in either group; and (c) increased fasting plasma glucose and leptin concentrations in both groups (Table 3).
Table 3.
Metabolic characteristics before and after weight gain
Substrate kinetics.
There was no difference in the endogenous glucose rate of appearance (Ra) (and glucose rate of disappearance [Rd]) during the basal stage (no insulin infusion) before weight gain in the MNO group (15.9 ± 1.6 μmol/kg FFM/min) compared with that observed in the MAO group (17.0 ± 1.7 μmol/kg FFM/min), and this did not change with weight gain in either the MNO (16.5 ± 1.4 μmol/kg FFM/min) or MAO (18.7 ± 1.4 μmol/kg FFM/min) group. The basal palmitate Ra before weight gain in the MNO group (2.8 ± 0.8 μmol/kg FM/min) was also not different from that seen in the MAO group (2.5 ± 0.8 μmol/kg FM/min), and this did not change with weight gain in either the MNO (2.4 ± 0.8 μmol/kg FM/min) or MAO (2.3 ± 0.8 μmol/kg FM/min) group.
Before weight gain, the endogenous glucose Ra during low-dose insulin infusion and the relative suppression of glucose Ra (index of hepatic insulin sensitivity) were 52% higher and 22% lower (P < 0.001), respectively, in MAO subjects compared with that observed in MNO subjects (Figure 1A). The endogenous glucose Ra during low-dose insulin infusion was higher after weight gain than before weight gain in MAO subjects (P = 0.014), but did not change in MNO subjects (P value for intervention × group interaction = 0.018) (Figure 1A). The relative suppression of glucose Ra during low-dose insulin infusion decreased after weight gain in MAO subjects (P = 0.017), but did not change in MNO subjects (P value for intervention × group interaction = 0.05) (Figure 1A).
Figure 1. Hepatic, skeletal muscle, and adipose tissue insulin sensitivity.

(A) Hepatic, skeletal muscle, and adipose tissue insulin sensitivity in MNO (n = 12) and MAO (n = 8) subjects before (white bars) and after (black bars) weight gain. Endogenous glucose Ra in plasma and percentage of suppression of glucose Ra during low-dose insulin infusion (stage 1) of the clamp procedure (an index of hepatic insulin sensitivity). (B) Skeletal muscle glucose Rd from plasma and percentage of stimulation of glucose Rd during high-dose insulin infusion (stage 2) of the clamp procedure (an index of skeletal muscle insulin sensitivity). (C) Palmitate Ra in plasma and percentage of suppression of palmitate Ra during low-dose insulin infusion (stage 1) of the clamp procedure (an index of adipose tissue insulin sensitivity). Repeated-measures ANCOVA was used for statistical analysis, with the intervention as the within-subjects factor (before vs. after weight gain), the group as the between-subjects factor (MNO vs. MAO), and sex and race as covariates. §P < 0.01, value different from the corresponding MNO value; *P < 0.05, value different from the before–weight-gain value. Data represent the mean ± SEM (A and C) or the mean and 95% CIs (B).
Before weight gain, glucose Rd during high-dose insulin infusion and the relative increase in glucose Rd (index of skeletal muscle insulin sensitivity) were 52% and 75% lower, respectively, in MAO subjects compared with the levels seen in MNO subjects (both P < 0.001) (Figure 1B). After weight gain, both glucose Rd (P = 0.07; P value for intervention × group interaction = 0.024) and the percentage increase in glucose Rd during high-dose insulin infusion (P = 0.043; P value for intervention × group interaction = 0.004) decreased in MAO subjects, but did not change in MNO subjects (Figure 1B).
Before weight gain, palmitate Ra during low-dose insulin infusion and the relative suppression of palmitate Ra (index of adipose tissue insulin sensitivity) were 64% higher and 33% lower, respectively, in MAO subjects compared with that seen in MNO subjects (both P < 0.001) (Figure 1C). After weight gain, the relative suppression of palmitate Ra during low-dose insulin infusion decreased in MAO subjects, but did not change in MNO subjects (P = 0.046, P value for intervention × group interaction = 0.019) (Figure 1C).
Before weight gain, the rates of hepatic VLDL apoB100 secretion into plasma were higher in MAO subjects than in MNO subjects (P < 0.01) (Figure 2). Weight gain caused a further increase in VLDL apoB100 secretion rates in MAO (P = 0.004), but not MNO, subjects. The rates of VLDL apoB100 clearance from plasma were similar in the MNO and MAO groups before weight gain (18.7 ± 6.2 and 17.6 ± 6.3 ml/min, respectively) and did not change after weight gain (19.4 ± 7.5 and 19.2 ± 7.7 ml/min, respectively).
Figure 2. VLDL apoB100 kinetics.

VLDL apoB100 secretion rates in MNO (n = 12) and MAO (n = 8) obese subjects before (white bars) and after (black bars) weight gain. Repeated-measures ANCOVA was used for statistical analysis, with the intervention as the within-subjects factor (before vs. after weight gain), the group as the between-subjects factor (MNO vs. MAO), and sex and race as covariates. §P < 0.05, value different from the corresponding MNO value; *P < 0.01, value different from the before-overfeeding value. Data represent the mean ± SEM.
Adipose tissue gene expression profile.
Parametric analysis of gene set enrichment (PAGE) of microarray data (22, 23) was used to evaluate global transcriptional changes in s.c. adipose tissue induced by weight gain in the MNO and MAO subjects. Biological pathways related to lipid metabolism and synthesis were markedly increased by weight gain in the MNO, but not in the MAO, group (Figure 3A; e.g., FATTY_ACID_BIOSYNTHETIC_PROCESS [Z score = 7.8 in the MNO group, 0.77 in the MAO group]; LIPID_BIOSYNTHETIC_PROCESS [Z score = 6.1 in the MNO group, 1.5 in the MAO group]; LIPID_METABOLIC_PROCESS [Z score = 5.4 in the MNO group, 0.16 in the MAO group]). Consistent with the upregulation in lipogenic pathways, adipose tissue gene expression of key lipogenic enzymes (fatty acid desaturase 1 [FADS1], fatty acid desaturase 2 [FADS2], and fatty acid elongase 6 [ELOVL6]) were also significantly increased by weight gain in the MNO group, but did not change in the MAO group (Figure 3B).
Figure 3. Adipose tissue gene expression profile.

PAGE was performed on microarray data to identify pathways in s.c. adipose tissue that changed with weight gain in MNO (n = 12) and MAO (n = 8) subjects. (A) The top-20 significantly upregulated pathways in MNO subjects are listed on the basis of their Z scores values before and after weight gain. (B) Gene expression of key lipogenic enzymes in s.c. adipose tissue was determined by real-time PCR in MNO and MAO subjects before (white bars) and after (black bars) weight gain. ANCOVA was used for statistical analysis, with the intervention as the within-subjects factor (before vs. after weight gain), the group as the between-subjects factor (MNO vs. MAO), and sex and race as covariates. *P < 0.02, value different from the before–weight-gain value. Data represent the mean ± SEM.
Discussion
Although obesity is commonly associated with a constellation of risk factors for cardiovascular disease, including insulin resistance, diabetes, dyslipidemia, and increased blood pressure, some obese people do not have metabolic abnormalities. In the present study, we used the accumulation of IHTG to identify obese subjects who are metabolically normal and those who are metabolically abnormal and challenged each group with a high-calorie diet until the subjects achieved moderate (~6%) weight gain. Our data demonstrate distinct differences in the response to weight gain in MNO and MAO subjects. In MAO subjects, but not MNO subjects, moderate weight gain exacerbated several metabolic risk factors for cardiovascular disease, including increased blood pressure, plasma triglyceride levels, VLDL apoB100 concentrations, and VLDL apoB100 secretion rates, and decreased plasma adiponectin concentrations and insulin sensitivity in the liver, skeletal muscle, and adipose tissues. Weight gain also caused a greater absolute, but not relative, increase in IHTG content in MAO subjects compared with that seen in MNO subjects. These data demonstrate that obese people with normal IHTG content represent a distinct obese phenotype that is resistant to the adverse metabolic effects of moderate weight gain. These findings have important clinical implications and suggest that the intensity of obesity therapy should be based on metabolic function rather than BMI values alone.
The concept that some obese people are predisposed to, while others are protected from, cardiometabolic disease was first proposed nearly 60 years ago (24). Since then, a series of studies have used the components of the metabolic syndrome or some measure of insulin sensitivity to identify a subset of obese people who are metabolically normal. However, there is no consensus as to how metabolic normality should be defined, so the reported prevalence of MNO ranges from 2% to 50%, depending on the specific criteria used and the population studied (9–18). In the present study, we used IHTG content to identify obese people who have already demonstrated either a propensity for or a resistance to accumulating triglycerides in organs other than adipose tissue. This approach also separated our subjects into those who were insulin resistant or insulin sensitive with respect to hepatic, muscle, and adipose tissue insulin action. Our results demonstrate that IHTG content is a robust marker of the adaptive response to weight gain and that obese people who have normal IHTG content tolerate moderate weight gain without serious adverse metabolic effects compared with those who have NAFLD. Moreover, our data suggest that the absolute, not the relative, increase in IHTG content tracks with the adverse metabolic effects that occur with weight gain. However, the association between IHTG content and metabolic dysfunction does not prove a cause-effect relationship. In fact, a dissociation between hepatic steatosis and insulin resistance has been observed in patients with familial hypobetalipoproteinemia who have increased IHTG content because of a genetic truncation of apoB100 that impairs VLDL export (25, 26). Overall, these findings support the notion that MNO people with normal IHTG content represent a distinct phenotype and are not simply in a transition phase toward MAO. Nonetheless, we cannot exclude the possibility that our MNO subjects would develop metabolic abnormalities with greater weight gain.
The cellular mechanisms responsible for the differences in metabolic function between MNO and MAO people are not clear. One prominent hypothesis is that a decreased capacity of adipose tissue to transport glucose and convert carbohydrate precursors into triglycerides is associated with adverse effects on metabolic health. We and others have previously found that, compared with MNO subjects, MAO subjects have decreased adipose tissue expression of genes involved in glucose uptake and lipogenesis (3, 27–31). In the present study, we extend these findings by demonstrating that several biological pathways and genes related to lipid metabolism and synthesis were significantly increased by weight gain in the MNO, but not MAO, subjects. These data are consistent with the results from a study conducted in a rodent model indicating that an experimental increase in the expression of adipose tissue lipogenic genes prevented weight gain–induced insulin resistance and the metabolic complications associated with obesity (32). Together, these data suggest that increased adipose tissue capacity for lipogenesis helps protect against the adverse metabolic effects of weight gain. However, an important limitation of our study is that we evaluated adipose tissue samples from only 1 compartment (s.c. abdominal fat) and did not obtain samples from other adipose tissue depots (e.g., visceral or gluteofemoral fat), skeletal muscle, or other tissues. Therefore, we cannot exclude the possibility that we missed other adipose tissue factors (33) or potential mediators of insulin resistance, such as diacylglycerol, ceramides, and acylcarnitines, in other tissues (34–36) that could help explain the different responses to weight gain in our MNO and MAO subjects.
The results from our study demonstrate that moderate weight gain elicits very different physiological responses in MNO and MAO people and that IHTG content can be used to identify obese people who are prone to, or protected from, the development of metabolic disease. These data support the need for more aggressive weight-management therapy in the subset of obese people who have NAFLD and are at high risk for continued deterioration of metabolic function with additional weight gain.
Methods
Subjects
The flow chart of study subjects is shown in Figure 4. Between August 2010 and February 2014, a total of 68 potential subjects were screened for this study, 36 of whom were considered eligible. Subjects were recruited through the Volunteers of Health Database at Washington University School of Medicine and by local postings. Eleven subjects discontinued the study because of relocation (n = 1), withdrawal of consent (n = 9), and nonstudy-related surgery (n = 1); 5 subjects were excluded from the final analyses because they did not achieve the predetermined acceptable 5%–7% weight gain. Therefore, data were collected and final analyses were performed on a total of 20 subjects. All parts of this study were conducted at the Clinical Research Unit of Washington University School of Medicine. IHTG content was used to identify subjects who were either MNO (IHTG <5.6%, n = 12, age = 43 ± 10 years, 2 males, 5 African-Americans, 1 Native-American, and 6 subjects of mixed European descent) or MAO (IHTG >10%, n = 8, age = 52 ± 7 years, 4 males, 2 African-Americans, and 6 subjects of mixed European descent), because increased IHTG content is a robust marker of inappropriate fat distribution and metabolic dysfunction (3, 7, 37). All subjects completed a comprehensive medical evaluation. To minimize potential weight gain–induced health risks to the study subjects, those with extreme obesity (BMI ≥40 kg/m2), IHTG content greater than 25%, diabetes, poorly controlled obesity comorbidities (e.g., blood pressure >150/100), or other serious diseases were excluded. No subject smoked tobacco or took medications that could affect the study’s outcome measures.
Figure 4. Study flow chart.

A total of 68 subjects were assessed for eligibility, 36 of whom were considered eligible. Eleven subjects withdrew from the study, and 5 subjects did not achieve the acceptable 5%–7% weight gain, thus data were collected and analyses performed on 12 MNO and 8 MAO subjects.
Study design
Body composition.
Body FM and FFM were determined using dual-energy x-ray absorptiometry (Lunar iDXA; GE Healthcare). VAT and s.c. abdominal adipose tissue volumes were quantified using MRI (Siemens; Analyze 7.0 software; Mayo Clinic, Mayo Foundation), and IHTG content was determined using magnetic resonance spectroscopy (Siemens) (38).
Hepatic, skeletal muscle, and adipose tissue insulin sensitivity.
The subjects were admitted to the Clinical Research Unit at Washington University School of Medicine on the evening before the clamp procedure. At 1900 hours, the subjects were served a standard meal and then fasted until study completion the next day. At 0500 hours the following morning, one catheter was inserted into a forearm vein to infuse stable isotopically labeled tracers, dextrose and insulin, and a second catheter was inserted into a radial artery in the contralateral hand to obtain blood samples. At 0600 hours, a primed (22.5 μmol/kg), continuous (0.25 μmol/kg/min) infusion of [6,6-2H2]glucose (Cambridge Isotope Laboratories) was started, followed by a continuous (6 nmol/kg FFM/min) infusion of [U-13C]palmitate (Cambridge Isotope Laboratories) bound to albumin at 0800 hours. After infusion of the glucose tracer for 3.5 hours and palmitate tracer for 1.5 hours (basal period), a 2-stage hyperinsulinemic-euglycemic clamp procedure was started and continued for 6 hours. Insulin was infused at a rate of 7 mU/m2 BSA/min (initiated with a priming dose of 28 mU/m2/min for 5 min and then 14 mU/m2/min for 5 min) during stage 1 (3.5–6.5 h) and at a rate of 50 mU/m2 BSA/min (initiated with a priming dose of 200 mU/m2/min for 5 min and then 100 mU/m2/min for 5 min) during stage 2 of the clamp procedure (6.5–9.5 h). These 2 insulin infusion rates were chosen to evaluate hepatic and adipose tissue insulin sensitivity (low-dose insulin infusion to submaximally suppress endogenous glucose production and adipose tissue lipolysis) and skeletal muscle insulin sensitivity (high-dose insulin infusion to stimulate muscle glucose uptake) (39). The infusion rates of glucose and palmitate were reduced by 50% during stage 1 and turned off during stage 2 of the clamp procedure to account for expected decreases in hepatic glucose production and lipolytic rates. Euglycemia (~100 mg/dl) was maintained by variable infusion of 20% dextrose, which was enriched to 2.5% with [6,6-2H2]glucose to help ensure a constant glucose tracer-to-tracee ratio (TTR). REE was determined during the basal period of the clamp procedure by using online expiratory gas exchange analyses (TrueOne 2400; Parvo Medics). Blood samples were collected before beginning the tracer infusion to determine the background plasma substrate TTR and every 10 minutes during the final 30 minutes of the basal period and in stages 1 and 2 of the clamp procedure to determine glucose and insulin concentrations and substrate kinetics.
VLDL apoB100 kinetics.
Approximately 1 week after the hyperinsulinemic-euglycemic clamp procedure, the subjects were readmitted to the Clinical Research Unit to assess VLDL apoB100 kinetics. At 1900 hours, the subjects were served a standard meal and then fasted until study completion the next day. At 0500 hours the following morning, a catheter was inserted into a forearm vein to infuse the stable isotopically labeled leucine tracer. A second catheter was inserted into a contralateral hand vein, which was heated to 55°C by using a thermostatically controlled box to obtain arterialized blood samples. At 0600 hours, a primed (4.2 μmol/kg) constant (0.062 μmol/kg/min) infusion of [5,5,5-2H3]leucine (Cambridge Isotope Laboratories) was started and maintained for 12 hours (4). Blood samples were obtained before the start of the tracer infusion and at 5, 15, 30, 60, 90, and 120 minutes and then every hour for 10 hours after starting the tracer infusion to determine the leucine TTR in plasma and in VLDL apoB100.
Adipose tissue biopsies.
Adipose tissue biopsies were obtained during the basal stage of the clamp procedure at ~0700 hours. After anesthetizing the skin and underlying tissues by percutaneous injection of lidocaine, abdominal s.c. adipose tissue was aspirated through a 4-mm liposuction cannula (Tulip Medical Products) connected to a 30-cc syringe from the periumbilical area. Tissue samples were immediately rinsed with ice-cold saline and frozen in liquid nitrogen before being stored at –80°C for subsequent RNA extraction.
High-calorie diet and weight gain.
After baseline studies were completed, the subjects were instructed to consume 1,000 kcal/day more than their estimated baseline total energy requirements (calculated as 1.25 times the measured REE) (40), but maintain the same relative macronutrient composition as their baseline diet, until they gained ~6% (acceptable range of 5% to 7%) of their initial body weight. This additional food intake was achieved by having subjects eat specific menu choices from among 5 fast-food restaurant chains (Burger King, Kentucky Fried Chicken, McDonald’s, Pizza Hut, and Taco Bell). The subjects were required to keep daily food records and meet individually and weekly with the study dietitian to help ensure dietary compliance. Four consecutive days of food records were collected, validated, and analyzed at baseline and at ~4 weeks after the subjects started the high-calorie diet to assess total daily energy intake and dietary macronutrient composition. The subjects were also seen every week for a medical examination and blood tests to ensure medical safety. After the subjects achieved the targeted 5%–7% gain in body weight, they were kept weight stable for more than 2 weeks before repeating the same procedures conducted at baseline. To help maintain weight stability, the subjects were instructed to reduce their energy intake by approximately 200 kcal/day. At each weekly visit, the subjects were weighed, and dietary recommendations were adjusted as needed to keep their weight stable. Once the final studies were completed, the subjects were enrolled in a weight-loss program, supervised by our study dietitian and behavioral therapist, until they lost at least as much weight as they gained during the study.
Analyses of samples and calculations.
Plasma glucose concentration was measured by an automated glucose analyzer (Yellow Springs Instruments Co.). Plasma insulin concentration was measured by using electrochemiluminescence technology (Elecsys 2010; Roche Diagnostics). Plasma adiponectin and leptin concentrations were determined by performing ELISA and a radioimmunoassay, respectively (both from EMD Millipore). Plasma samples for BCAAs were prepared according to the manufacturer’s instructions (Phenomenex) for analyses by gas chromatography–mass spectrometry (41). The glucose, palmitate, and leucine TTR in plasma and the leucine TTR in VLDL particles were determined by using gas chromatography–mass spectrometry (3, 4). VLDL was separated from plasma by density-gradient ultracentrifugation (42). Plasma VLDL apoB100 concentrations were measured by using an immunoturbidimetric kit (Wako).
HOMA-IR was measured from the subjects’ fasting plasma glucose levels and insulin concentrations (43). Isotopic steady-state conditions were achieved during the final 30 minutes of the basal period and stages 1 and 2 of the clamp procedure, and Steele’s equation for steady-state conditions was used to calculate substrate kinetics (44). Glucose Ra in plasma was calculated by dividing the glucose tracer infusion rate by the average plasma glucose TTR during the last 30 minutes of the basal period and in stages 1 and 2 of the clamp procedure. During the clamp procedure, the endogenous glucose production rate was calculated by subtracting the dextrose infusion rate from total glucose Ra. Glucose Rd from plasma was assumed to equal total glucose Ra. Palmitate Ra was calculated by dividing the palmitate tracer infusion rate by the average plasma palmitate TTR obtained during the final 30 minutes of the basal period and in stage 1 of the clamp procedure. Hepatic and adipose tissue insulin sensitivity was assessed as the relative decrease in glucose and palmitate Ra, respectively, from basal to low-dose insulin infusion (stage 1) of the clamp procedure. Skeletal muscle insulin sensitivity was determined as the relative increase in glucose Rd from basal to high-dose insulin infusion (stage 2) of the clamp procedure (7).
The fractional turnover rate (FTR) of VLDL apoB100 (in pools/h) was determined by fitting the TTR of leucine in plasma and in VLDL apoB100 to a multicompartmental model, as previously described (42). The rate of VLDL apoB100 secretion into plasma (in nmol/l/min) was calculated by multiplying the FTR of VLDL apoB100 (in pools/min) by the steady-state concentration of VLDL apoB100 (in nmol/l) and the plasma volume (in liters). Plasma VLDL apoB100 clearance (in ml/min) was calculated by multiplying the FTR of VLDL apoB100 (in pools/h) by the plasma volume (in liters), divided by 60.
Total RNA was isolated from frozen s.c. adipose tissue samples by using QIAzol and an RNeasy Mini Kit (QIAGEN). Microarray analyses were performed with the GeneChip Human Gene 1.0 ST Array (Affymetrix). PAGE was performed as previously described (22, 23). Gene sets were obtained from the gene set enrichment analysis (GSEA) database (gene ontology [GO] gene sets, C5 collection; http://www.broad.mit.edu/gsea/msigdb/msigdb_index.html), and Z scores and P values were calculated for each gene set. A P value of less than 0.05 was considered statistically significant. All data were analyzed using the R statistical software package (http://www.bioconductor.org). Microarray datasets used in this study have been deposited in the NCBI’s Gene Expression Omnibus database (GEO GSE62832). Real-time PCR was performed on key enzymes involved in adipose tissue lipogenesis (FADS1, FADS2, and ELOVL6). Gene expression was determined using an ABI 7500 real-time PCR system (Invitrogen) and SYBR Green Master Mix (Invitrogen). The expression of each gene was determined by normalizing the Ct value of each sample to the housekeeping control gene, ribosomal protein (36B4). Primer details are listed in Supplemental Table 1 (supplemental material available online with this article; doi:10.1172/JCI78425DS1).
Statistics
The statistical analyses were based on a hierarchy of outcomes: (a) skeletal muscle insulin sensitivity was considered the primary outcome; (b) hepatic and adipose tissue insulin sensitivity and VLDL apoB100 kinetics were considered secondary outcomes; and (c) all other variables (body composition, other cardiometabolic variables, and adipose tissue gene expression) were considered exploratory analyses. All datasets were tested for normality according to the Shapiro-Wilks method, and non-normally distributed variables were log transformed for analysis and back transformed for presentation. The effect of weight gain was determined by repeated-measures ANCOVA, with the intervention as the within-subjects factor (before vs. after overfeeding) and the group as the between-subjects factor (MNO vs. MAO), and adjusting for sex and race as covariates. When significant interactions between the intervention and group were found, a 2-tailed Student’s t test was used to evaluate the effect of treatment within each group (paired Student’s t test) and differences between groups at baseline and after intervention (independent Student’s t test). Results are presented as the mean with SDs (for normally distributed variables) or 95% CIs (for non-normally distributed variables), unless otherwise indicated. A P value of 0.05 or less was considered statistically significant. Analyses were performed using SPSS software, version 19 (SPSS Inc.).
On the basis of the interindividual variability of insulin-mediated suppression of glucose and palmitate Ra and insulin-mediated stimulation of glucose Rd, assessed by using the hyperinsulinemic-euglycemic clamp procedure in a large cohort of nondiabetic obese subjects we had studied previously (39, 45), we estimated that 8 subjects in each group (MNO and MAO) would be needed to detect between-group differences in insulin sensitivity of ≥19% in hepatic tissue, ≥25% in adipose tissue, and ≥29% in skeletal muscle, with a β value of 0.20 (i.e., 80% power) and an α value of 0.05. We estimated that 15–20 subjects would need to be recruited in each group to ensure that an adequate number of subjects completed the study, after allowing for dropouts and subjects who were not able to achieve the required 5%–7% weight gain.
Study approval
Subjects provided written informed consent before participating in this study, which was approved by the Human Research Protection Office of the Washington University School of Medicine.
Supplementary Material
Acknowledgments
The authors thank Emily Lake for assistance in recruiting the study subjects; Freida Custodio, Jennifer Shew, Shannon Kelly, and Meghan E. Lam for technical assistance; Clarissa Craft, Robert Mecham, and Nathan Wolins for insightful discussions of the data; Melisa Moore, Kathryn Gratza, and the staff of the Clinical Research Unit for help in performing the studies; and the study subjects for their participation. This work was supported by NIH grants UL1 RR024992 (Clinical Translational Science Award), DK 56341 (Nutrition and Obesity Research Center), DK 37948 and DK 20579 (Diabetes Center Grant), and UL1 TR000450 (KL2 Award); a Central Society for Clinical and Translational Research Early Career Development Award; and grants from the Longer Life Foundation the Kilo Foundation.
Footnotes
Conflict of interest: The authors have declared that no conflict of interest exists.
Reference information:J Clin Invest. 2015;125(2):787–795. doi:10.1172/JCI78425.
Samuel Klein is the guarantor of this work, had full access to all the data, and takes full responsibility for the integrity of the data and the accuracy of data analysis.
References
- 1.Fabbrini E, Sullivan S, Klein S. Obesity and nonalcoholic fatty liver disease: Biochemical, metabolic, and clinical implications. Hepatology. 2010;51(2):679–689. doi: 10.1002/hep.23280. [DOI] [PMC free article] [PubMed] [Google Scholar]
- 2.Klein S, Wadden T, Sugerman HJ. AGA technical review on obesity. Gastroenterology. 2002;123(3):882–932. doi: 10.1053/gast.2002.35514. [DOI] [PubMed] [Google Scholar]
- 3.Fabbrini E, et al. Intrahepatic fat, not visceral fat, is linked with metabolic complications of obesity. Proc Natl Acad Sci U S A. 2009;106(36):15430–15435. doi: 10.1073/pnas.0904944106. [DOI] [PMC free article] [PubMed] [Google Scholar]
- 4.Fabbrini E, Mohammed BS, Magkos F, Korenblat KM, Patterson BW, Klein S. Alterations in adipose tissue and hepatic lipid kinetics in obese men and women with nonalcoholic fatty liver disease. Gastroenterology. 2008;134(2):424–431. doi: 10.1053/j.gastro.2007.11.038. [DOI] [PMC free article] [PubMed] [Google Scholar]
- 5.Sanyal AJ, et al. Nonalcoholic steatohepatitis: association of insulin resistance and mitochondrial abnormalities. Gastroenterology. 2001;120(5):1183–1192. doi: 10.1053/gast.2001.23256. [DOI] [PubMed] [Google Scholar]
- 6.Marchesini G, et al. Nonalcoholic fatty liver disease: a feature of the metabolic syndrome. Diabetes. 2001;50(8):1844–1850. doi: 10.2337/diabetes.50.8.1844. [DOI] [PubMed] [Google Scholar]
- 7.Korenblat KM, Fabbrini E, Mohammed BS, Klein S. Liver, muscle, and adipose tissue insulin action is directly related to intrahepatic triglyceride content in obese subjects. Gastroenterology. 2008;134(5):1369–1375. doi: 10.1053/j.gastro.2008.01.075. [DOI] [PMC free article] [PubMed] [Google Scholar]
- 8.Browning JD, et al. Prevalence of hepatic steatosis in an urban population in the United States: impact of ethnicity. Hepatology. 2004;40(6):1387–1395. doi: 10.1002/hep.20466. [DOI] [PubMed] [Google Scholar]
- 9.van Vliet-Ostaptchouk JV, et al. The prevalence of metabolic syndrome and metabolically healthy obesity in Europe: a collaborative analysis of ten large cohort studies. BMC Endocr Disord. 2014;14:9. doi: 10.1186/1472-6823-14-9. [DOI] [PMC free article] [PubMed] [Google Scholar]
- 10.Singh-Manoux A, et al. Obesity phenotypes in midlife and cognition in early old age: the Whitehall II cohort study. Neurology. 2012;79(8):755–762. doi: 10.1212/WNL.0b013e3182661f63. [DOI] [PMC free article] [PubMed] [Google Scholar]
- 11.Pajunen P, et al. Metabolically healthy and unhealthy obesity phenotypes in the general population: the FIN-D2D Survey. BMC Public Health. 2011;11:754. doi: 10.1186/1471-2458-11-754. [DOI] [PMC free article] [PubMed] [Google Scholar]
- 12.Calori G, et al. Prevalence, metabolic features, and prognosis of metabolically healthy obese Italian individuals: the Cremona Study. Diabetes Care. 2011;34(1):210–215. doi: 10.2337/dc10-0665. [DOI] [PMC free article] [PubMed] [Google Scholar]
- 13.Lopez-Garcia E, Guallar-Castillon P, Leon-Munoz L, Rodriguez-Artalejo F. Prevalence and determinants of metabolically healthy obesity in Spain. Atherosclerosis. 2013;231(1):152–157. doi: 10.1016/j.atherosclerosis.2013.09.003. [DOI] [PubMed] [Google Scholar]
- 14.Hamer M, Stamatakis E. Metabolically healthy obesity and risk of all-cause and cardiovascular disease mortality. J Clin Endocrinol Metab. 2012;97(7):2482–2488. doi: 10.1210/jc.2011-3475. [DOI] [PMC free article] [PubMed] [Google Scholar]
- 15.Wildman RP, et al. The obese without cardiometabolic risk factor clustering and the normal weight with cardiometabolic risk factor clustering: prevalence and correlates of 2 phenotypes among the US population (NHANES 1999-2004). Arch Intern Med. 2008;168(15):1617–1624. doi: 10.1001/archinte.168.15.1617. [DOI] [PubMed] [Google Scholar]
- 16.Brochu M, et al. What are the physical characteristics associated with a normal metabolic profile despite a high level of obesity in postmenopausal women? J Clin Endocrinol Metab. 2001;86(3):1020–1025. doi: 10.1210/jcem.86.3.7365. [DOI] [PubMed] [Google Scholar]
- 17.Durward CM, Hartman TJ, Nickols-Richardson SM. All-cause mortality risk of metabolically healthy obese individuals in NHANES III. J Obes. 2012;2012:460321. doi: 10.1155/2012/460321. [DOI] [PMC free article] [PubMed] [Google Scholar]
- 18.Shea JL, Randell EW, Sun G. The prevalence of metabolically healthy obese subjects defined by BMI and dual-energy X-ray absorptiometry. Obesity (Silver Spring). 2011;19(3):624–630. doi: 10.1038/oby.2010.174. [DOI] [PubMed] [Google Scholar]
- 19.Appleton SL, et al. Diabetes and cardiovascular disease outcomes in the metabolically healthy obese phenotype: a cohort study. Diabetes Care. 2013;36(8):2388–2394. doi: 10.2337/dc12-1971. [DOI] [PMC free article] [PubMed] [Google Scholar]
- 20.Meigs JB, et al. Body mass index, metabolic syndrome, and risk of type 2 diabetes or cardiovascular disease. J Clin Endocrinol Metab. 2006;91(8):2906–2912. doi: 10.1210/jc.2006-0594. [DOI] [PubMed] [Google Scholar]
- 21.Szczepaniak LS, et al. Magnetic resonance spectroscopy to measure hepatic triglyceride content: prevalence of hepatic steatosis in the general population. Am J Physiol Endocrinol Metab. 2005;288(2):E462–E468. doi: 10.1152/ajpendo.00064.2004. [DOI] [PubMed] [Google Scholar]
- 22.Kim SY, Volsky DJ. PAGE: parametric analysis of gene set enrichment. BMC Bioinformatics. 2005;6:144. doi: 10.1186/1471-2105-6-144. [DOI] [PMC free article] [PubMed] [Google Scholar]
- 23.Yoshino J, Mills KF, Yoon MJ, Imai S. Nicotinamide mononucleotide, a key NAD(+) intermediate, treats the pathophysiology of diet- and age-induced diabetes in mice. Cell Metab. 2011;14(4):528–536. doi: 10.1016/j.cmet.2011.08.014. [DOI] [PMC free article] [PubMed] [Google Scholar]
- 24.Vague J. The degree of masculine differentiation of obesities: a factor determining predisposition to diabetes, atherosclerosis, gout, and uric calculous disease. Am J Clin Nutr. 1956;4(1):20–34. doi: 10.1093/ajcn/4.1.20. [DOI] [PubMed] [Google Scholar]
- 25.Amaro A, et al. Dissociation between intrahepatic triglyceride content and insulin resistance in familial hypobetalipoproteinemia. Gastroenterology. 2010;139(1):149–153. doi: 10.1053/j.gastro.2010.03.039. [DOI] [PMC free article] [PubMed] [Google Scholar]
- 26.Visser ME, et al. Hepatic steatosis does not cause insulin resistance in people with familial hypobetalipoproteinaemia. Diabetologia. 2011;54(8):2113–2121. doi: 10.1007/s00125-011-2157-x. [DOI] [PMC free article] [PubMed] [Google Scholar]
- 27.Herman MA, et al. A novel ChREBP isoform in adipose tissue regulates systemic glucose metabolism. Nature. 2012;484(7394):333–338. doi: 10.1038/nature10986. [DOI] [PMC free article] [PubMed] [Google Scholar]
- 28.Roberts R, et al. Markers of de novo lipogenesis in adipose tissue: associations with small adipocytes and insulin sensitivity in humans. Diabetologia. 2009;52(5):882–890. doi: 10.1007/s00125-009-1300-4. [DOI] [PubMed] [Google Scholar]
- 29.Hoffstedt J, Forster D, Lofgren P. Impaired subcutaneous adipocyte lipogenesis is associated with systemic insulin resistance and increased apolipoprotein B/AI ratio in men and women. J Intern Med. 2007;262(1):131–139. doi: 10.1111/j.1365-2796.2007.01811.x. [DOI] [PubMed] [Google Scholar]
- 30.Kursawe R, et al. Cellularity and adipogenic profile of the abdominal subcutaneous adipose tissue from obese adolescents: association with insulin resistance and hepatic steatosis. Diabetes. 2010;59(9):2288–2296. doi: 10.2337/db10-0113. [DOI] [PMC free article] [PubMed] [Google Scholar]
- 31.Graham TE, Kahn BB. Tissue-specific alterations of glucose transport and molecular mechanisms of intertissue communication in obesity and type 2 diabetes. Horm Metab Res. 2007;39(10):717–721. doi: 10.1055/s-2007-985879. [DOI] [PubMed] [Google Scholar]
- 32.Cao H, Gerhold K, Mayers JR, Wiest MM, Watkins SM, Hotamisligil GS. Identification of a lipokine, a lipid hormone linking adipose tissue to systemic metabolism. Cell. 2008;134(6):933–944. doi: 10.1016/j.cell.2008.07.048. [DOI] [PMC free article] [PubMed] [Google Scholar]
- 33.Sun K, Kusminski CM, Scherer PE. Adipose tissue remodeling and obesity. J Clin Invest. 2011;121(6):2094–2101. doi: 10.1172/JCI45887. [DOI] [PMC free article] [PubMed] [Google Scholar]
- 34.Shulman GI. Ectopic fat in insulin resistance, dyslipidemia, and cardiometabolic disease. N Engl J Med. 2014;371(12):1131–1141. doi: 10.1056/NEJMra1011035. [DOI] [PubMed] [Google Scholar]
- 35.Chavez JA, Summers SA. A ceramide-centric view of insulin resistance. Cell Metab. 2012;15(5):585–594. doi: 10.1016/j.cmet.2012.04.002. [DOI] [PubMed] [Google Scholar]
- 36.Muoio DM, Newgard CB. Mechanisms of disease: molecular and metabolic mechanisms of insulin resistance and beta-cell failure in type 2 diabetes. Nat Rev Mol Cell Biol. 2008;9(3):193–205. doi: 10.1038/nrm2327. [DOI] [PubMed] [Google Scholar]
- 37.Deivanayagam S, et al. Nonalcoholic fatty liver disease is associated with hepatic and skeletal muscle insulin resistance in overweight adolescents. Am J Clin Nutr. 2008;88(2):257–262. doi: 10.1093/ajcn/88.2.257. [DOI] [PMC free article] [PubMed] [Google Scholar]
- 38.Frimel TN, Deivanayagam S, Bashir A, O’Connor R, Klein S. Assessment of intrahepatic triglyceride content using magnetic resonance spectroscopy. J Cardiometab Syndr. 2007;2(2):136–138. doi: 10.1111/j.1559-4564.2007.07168.x. [DOI] [PubMed] [Google Scholar]
- 39.Conte C, Fabbrini E, Kars M, Mittendorfer B, Patterson BW, Klein S. Multiorgan insulin sensitivity in lean and obese subjects. Diabetes Care. 2012;35(6):1316–1321. doi: 10.2337/dc11-1951. [DOI] [PMC free article] [PubMed] [Google Scholar]
- 40.James WP, McNeill G, Ralph A. Metabolism and nutritional adaptation to altered intakes of energy substrates. Am J Clin Nutr. 1990;51(2):264–269. doi: 10.1093/ajcn/51.2.264. [DOI] [PubMed] [Google Scholar]
- 41.Badawy AA, Morgan CJ, Turner JA. Application of the Phenomenex EZ:faasttrade mark amino acid analysis kit for rapid gas-chromatographic determination of concentrations of plasma tryptophan and its brain uptake competitors. Amino Acids. 2008;34(4):587–596. doi: 10.1007/s00726-007-0012-7. [DOI] [PMC free article] [PubMed] [Google Scholar]
- 42.Mittendorfer B, Patterson BW, Klein S. Effect of weight loss on VLDL-triglyceride and apoB-100 kinetics in women with abdominal obesity. Am J Physiol Endocrinol Metab. 2003;284(3):E549–E556. doi: 10.1152/ajpendo.00379.2002. [DOI] [PubMed] [Google Scholar]
- 43.Matthews DR, Hosker JP, Rudenski AS, Naylor BA, Treacher DF, Turner RC. Homeostasis model assessment: insulin resistance and beta-cell function from fasting plasma glucose and insulin concentrations in man. Diabetologia. 1985;28(7):412–419. doi: 10.1007/BF00280883. [DOI] [PubMed] [Google Scholar]
- 44.Steele R. Influences of glucose loading and of injected insulin on hepatic glucose output. Ann N Y Acad Sci. 1959;82:420–430. doi: 10.1111/j.1749-6632.1959.tb44923.x. [DOI] [PubMed] [Google Scholar]
- 45.Magkos F, Fabbrini E, Korenblat K, Okunade AL, Patterson BW, Klein S. Reproducibility of glucose, fatty acid and VLDL kinetics and multi-organ insulin sensitivity in obese subjects with non-alcoholic fatty liver disease. Int J Obes (Lond). 2011;35(9):1233–1240. doi: 10.1038/ijo.2010.265. [DOI] [PMC free article] [PubMed] [Google Scholar]
Associated Data
This section collects any data citations, data availability statements, or supplementary materials included in this article.