A combination of structural imaging with MR imaging and functional assessment of cerebral metabolism with FDG PET, cortical amyloid deposition with 11C PiB and 18F florbetapir PET, and dopaminergic activity with 123I ioflupane SPECT can aid in differentiation and diagnosis of idiopathic Parkinson disease and atypical parkinsonian syndromes.
Abstract
Movement disorders with parkinsonian features are common, and in recent years imaging has assumed a greater role in diagnosis and management. Thus, it is important that radiologists become familiar with the most common imaging patterns of parkinsonism, especially given the significant clinical overlap and diagnostic difficulty associated with these disorders. The authors review the most common magnetic resonance (MR) and molecular imaging patterns of idiopathic Parkinson disease and atypical parkinsonian syndromes. They also discuss the interpretation of clinically available molecular imaging studies, including assessment of cerebral metabolism with 2-[fluorine-18]fluoro-2-deoxy-d-glucose (FDG) positron emission tomography (PET), cortical amyloid deposition with carbon 11 (11C) Pittsburgh compound B and fluorine 18 (18F) florbetapir PET, and dopaminergic activity with iodine 123 (123I) ioflupane single photon emission computed tomography (SPECT). Although no single imaging test is diagnostic, a combination of tests may help narrow the differential diagnosis. Findings at 123I ioflupane SPECT can confirm the loss of dopaminergic neurons in patients with parkinsonism and help distinguish these syndromes from treatable conditions, including essential tremor and drug-induced parkinsonism. FDG PET uptake can demonstrate patterns of neuronal dysfunction that are specific to a particular parkinsonian syndrome. Although MR imaging findings are typically nonspecific in parkinsonian syndromes, classic patterns of T2 signal change can be seen in multiple system atrophy and progressive supranuclear palsy. Finally, positive amyloid-binding PET findings can support the diagnosis of dementia with Lewy bodies. Combined with a thorough clinical evaluation, multimodality imaging information can afford accurate diagnosis, allow selection of appropriate therapy, and provide important prognostic information.
©RSNA, 2014
See discussion on this article by Bohnen and Frey.
SA-CME LEARNING OBJECTIVES
After completing this journal-based SA-CME activity, participants will be able to:
■ Discuss the fundamentals of 123I ioflupane SPECT interpretation in parkinsonism.
■ Identify normal amyloid-binding PET findings in atypical parkinsonian syndromes.
■ Describe abnormal MR imaging findings in multisystem atrophy and progressive supranuclear palsy.
Introduction
Advances in clinically available functional and metabolic imaging techniques, such as U.S. Food and Drug Administration (FDA) approval of iodine 123 (123I) ioflupane single photon emission computed tomography (SPECT) in 2011 and fluorine 18 (18F) florbetapir positron emission tomography (PET) in 2012, combined with the increasing use of semiquantitative 2-[fluorine-18]fluoro-2-deoxy-d-glucose (FDG) PET, highlight the need for radiologists to become familiar with the most common imaging patterns of parkinsonism (Table). When these techniques are used in combination with conventional magnetic resonance (MR) imaging and a thorough clinical examination, an accurate diagnosis can frequently be made. There is good reason to believe that additional diagnostic accuracy will be gained with use of imaging techniques that are currently under development.
Most Common Imaging Patterns of Idiopathic Parkinson Disease and APS
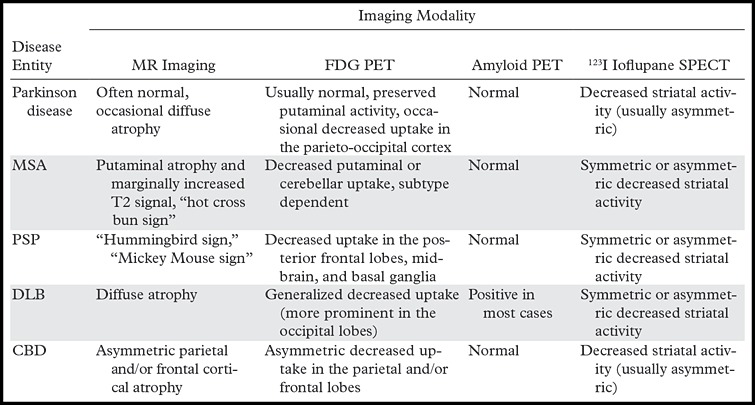
Note.—APS = atypical parkinsonian syndromes, CBD = corticobasal degeneration, DLB = dementia with Lewy bodies, MSA = multiple system atrophy, PSP = progressive supranuclear palsy.
Movement disorders with parkinsonian features are characterized by tremor, rigidity, bradykinesia, and postural imbalance. Idiopathic Parkinson disease is the most common movement disorder. It has an overall prevalence of 1% among Europeans between 65 and 85 years of age (1) and affects over 1 million people in North America (2). The differential diagnosis includes benign essential tremor, drug-induced parkinsonism, and vascular parkinsonism, among other disorders (3). Furthermore, many APS, also known as Parkinson-plus syndromes, have clinical hallmarks similar to those of Parkinson disease; however, they have different management and prognostic implications. These syndromes include MSA, PSP, DLB, and CBD.
In this article, we discuss how a combination of structural imaging with MR imaging and functional assessment of cerebral metabolism with FDG PET, cortical amyloid deposition with carbon 11 (11C) Pittsburgh compound B (PiB) and 18F florbetapir PET, and dopaminergic activity with 123I ioflupane SPECT can aid in the differentiation and diagnosis of idiopathic Parkinson disease and atypical parkinsonian syndromes.
Parkinsonism and the Dopaminergic System
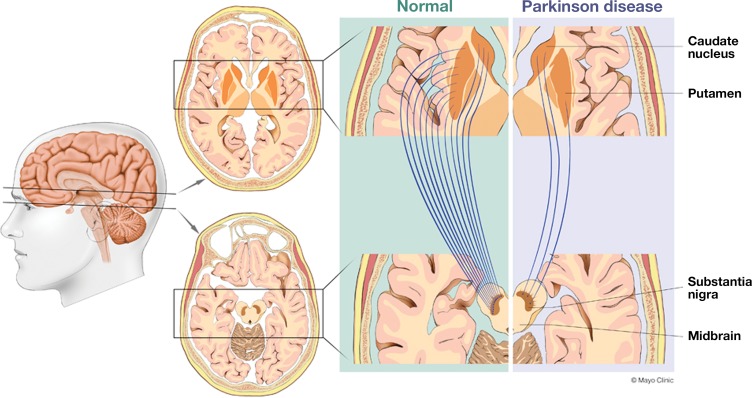
The predominant pathologic condition in Parkinson disease, which accounts for 70%–80% of parkinsonian syndromes, is loss of dopaminergic neurons that project from the substantia nigra pars compacta in the midbrain to the striatum (putamen and caudate nucleus) (4). The medial fibers of the nigrostriatal system typically project to the caudate nucleus, whereas the lateral fibers project to the putamen. The lateral projections to the posterior putamen are commonly affected earlier and to a greater extent than the medial projections to the caudate nucleus (Fig 1). It is this neuronal loss that leads to a dopaminergic deficit, which is believed to contribute to the clinical symptoms. Typically, 40%–60% of the dopaminergic neurons are lost before patients become symptomatic (5).
Figure 1.
Drawings illustrate how both idiopathic Parkinson disease and APS are characterized by loss of dopaminergic neurons that project from the substantia nigra pars compacta in the midbrain to the striatum (putamen and caudate nucleus). The medial fibers of the nigrostriatal system typically project to the caudate nucleus, and the lateral fibers to the putamen. Most commonly, the projections to the posterior putamen (lateral) are affected earlier and to a greater extent than those to the caudate nucleus (medial).
Diagnosis
The definitive diagnosis of Parkinson disease relies on histologic confirmation of intraneural Lewy body inclusions in the substantia nigra compacta, which it is not feasible to identify clinically. Therefore, a combination of patient history, physical examination, and favorable response to dopaminergic therapy remains the diagnostic standard of reference. Similarly, APS are diagnosed based on clinical signs and symptoms. Unfortunately, the features unique to APS, such as frequent and early falls, symmetric motor signs, lack of resting tremor, dysautonomia, rapid progression, and poor response to levodopa, are often either not present at all or present only very late in the disease (6). Therefore, APS are difficult to differentiate from both Parkinson disease and from each other, and many published reports suggest a high rate of misdiagnosis in early- and even late-stage disease (7). This is problematic for both the patient and the evaluating physician, since the prognosis and treatment options are substantially different among the various causes of parkinsonism. For example, levodopa administration is a good treatment in patients with Parkinson disease but is generally ineffective in patients with CBD and can worsen orthostatic hypotension in patients with MSA (8).
Despite these diagnostic difficulties, neuroimaging may not be warranted in patients with typical clinical findings and a good response to therapy. It is the patients with atypical findings and lack of response who may benefit from clinically available multimodality imaging techniques. These techniques include structural evaluation with MR imaging and functional assessment of cerebral metabolism with FDG PET, cortical amyloid deposition with 11C PiB and 18F florbetapir PET, and dopaminergic activity with 123I ioflupane SPECT.
MR Imaging
Conventional MR imaging is extremely useful for excluding structural abnormalities such as mass lesions, infarcts, or hydrocephalus, which may produce symptoms mimicking neurodegenerative disease. In some instances, MR imaging may also demonstrate findings specific to particular APS. Morphologic changes, such as selective lobar atrophy, are typically better visualized on T1-weighted or fluid-attenuated inversion recovery (FLAIR) images, which highlight the contrast of high-signal central nervous system structures against low-signal cerebrospinal fluid (9). Increased T2 signal typically reflects varying degrees of wallerian degeneration, demyelination, and gliosis, whereas low T2 signal indicates the physiologic accumulation of paramagnetic substances such as ferritin (9). Both increased and decreased T2 signal can be useful in identifying particular APS, especially in cases that show classic patterns of T2 signal change.
FDG PET
General Considerations.—Glucose metabolism is closely related to neuronal activity: Approximately 95% of the adenosine triphosphate (ATP) needed for brain function is derived from glucose. FDG, a glucose analog, becomes trapped in cells after irreversible phosphorylation. Consequently, FDG PET is useful for imaging regional glucose consumption in the brain, where a pathologic change in neuronal activity is reflected by a corresponding decrease in glucose metabolism. FDG PET is FDA approved only for differentiating Alzheimer disease from frontotemporal dementia, and currently, its use in APS is an off-label indication.
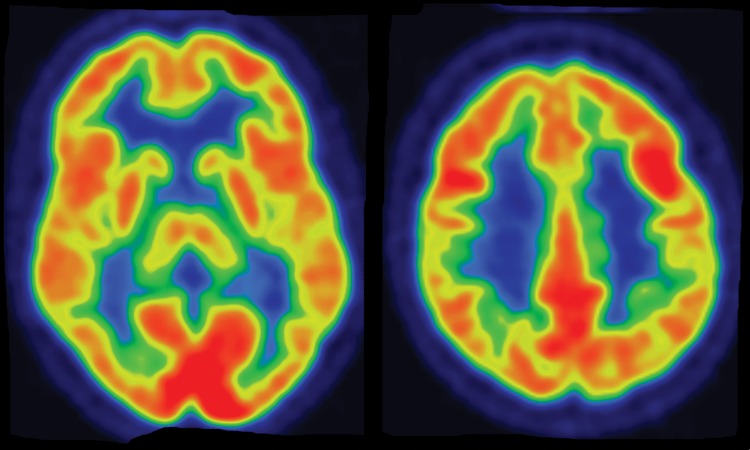
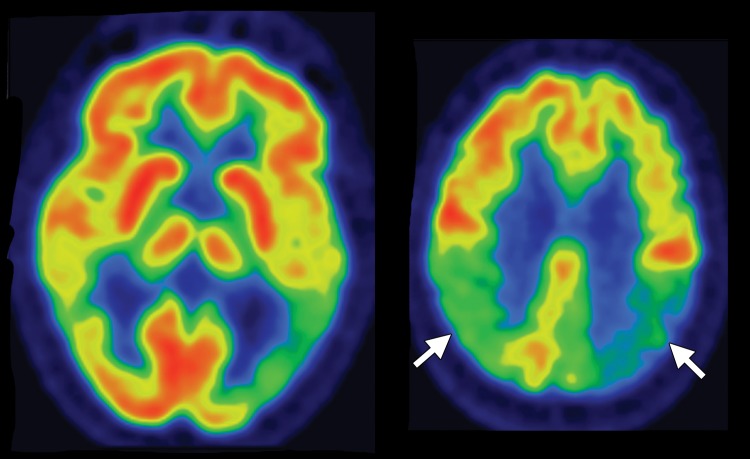
Interpretation.—Interpretation entails both qualitative and semiquantitative techniques. Qualitative analysis relies on visual examination of standard axial (Fig 2a, 2d), coronal, and sagittal images for areas of decreased radiotracer uptake. Semiquantitative techniques include creation of 3D SSP images and Z-score images. At our institution, 3D SSP and Z-score images are generated using CortexID software (GE Healthcare, Waukesha, Wis). In this technique, the FDG PET dataset is processed to account for anatomic variations and sampled at approximately 16,000 locations throughout the cortex of both cerebral hemispheres, yielding a 3D SSP image (Fig 2b, 2e). Each cortical region is then compared with a normative database on a voxel-by-voxel basis, yielding an age-matched Z-score that quantifies differences between the patient and healthy control subjects. To confirm characteristic metabolic patterns, Z-score images are displayed with 3D SSP images for assessment (Fig 2c, 2f) (10,11).
Figure 2a.
(a–c) Normal findings in a patient undergoing evaluation for possible Alzheimer disease. Axial FDG PET images (a), semiquantitative three-dimensional (3D) stereotactic surface projection (SSP) FDG PET images (b), and Z-score images (c) show normal findings. (d–f) Abnormal findings in a patient with known Alzheimer disease and progressive verbal difficulties. Axial FDG PET images (d) demonstrate marked bilateral temporoparietal hypometabolism (arrows), a finding that is confirmed on semiquantitative 3D SSP FDG PET images (e) and Z-score images (f) (arrows). Prominent left frontal hypometabolism is also seen (arrowhead in f).
Figure 2d.
(a–c) Normal findings in a patient undergoing evaluation for possible Alzheimer disease. Axial FDG PET images (a), semiquantitative three-dimensional (3D) stereotactic surface projection (SSP) FDG PET images (b), and Z-score images (c) show normal findings. (d–f) Abnormal findings in a patient with known Alzheimer disease and progressive verbal difficulties. Axial FDG PET images (d) demonstrate marked bilateral temporoparietal hypometabolism (arrows), a finding that is confirmed on semiquantitative 3D SSP FDG PET images (e) and Z-score images (f) (arrows). Prominent left frontal hypometabolism is also seen (arrowhead in f).
Figure 2b.
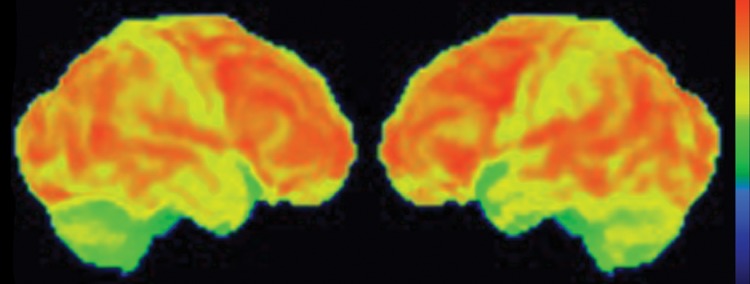
(a–c) Normal findings in a patient undergoing evaluation for possible Alzheimer disease. Axial FDG PET images (a), semiquantitative three-dimensional (3D) stereotactic surface projection (SSP) FDG PET images (b), and Z-score images (c) show normal findings. (d–f) Abnormal findings in a patient with known Alzheimer disease and progressive verbal difficulties. Axial FDG PET images (d) demonstrate marked bilateral temporoparietal hypometabolism (arrows), a finding that is confirmed on semiquantitative 3D SSP FDG PET images (e) and Z-score images (f) (arrows). Prominent left frontal hypometabolism is also seen (arrowhead in f).
Figure 2e.
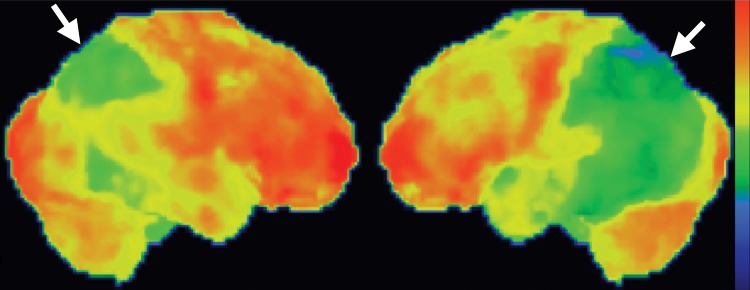
(a–c) Normal findings in a patient undergoing evaluation for possible Alzheimer disease. Axial FDG PET images (a), semiquantitative three-dimensional (3D) stereotactic surface projection (SSP) FDG PET images (b), and Z-score images (c) show normal findings. (d–f) Abnormal findings in a patient with known Alzheimer disease and progressive verbal difficulties. Axial FDG PET images (d) demonstrate marked bilateral temporoparietal hypometabolism (arrows), a finding that is confirmed on semiquantitative 3D SSP FDG PET images (e) and Z-score images (f) (arrows). Prominent left frontal hypometabolism is also seen (arrowhead in f).
Figure 2c.
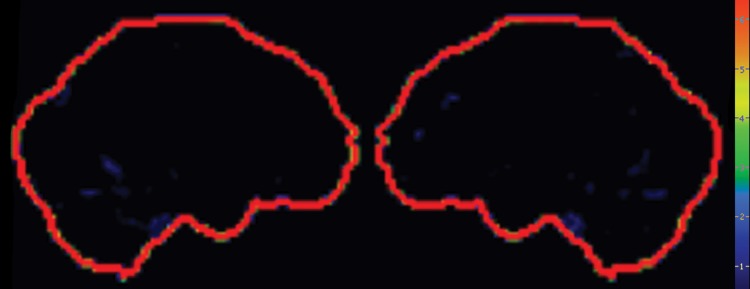
(a–c) Normal findings in a patient undergoing evaluation for possible Alzheimer disease. Axial FDG PET images (a), semiquantitative three-dimensional (3D) stereotactic surface projection (SSP) FDG PET images (b), and Z-score images (c) show normal findings. (d–f) Abnormal findings in a patient with known Alzheimer disease and progressive verbal difficulties. Axial FDG PET images (d) demonstrate marked bilateral temporoparietal hypometabolism (arrows), a finding that is confirmed on semiquantitative 3D SSP FDG PET images (e) and Z-score images (f) (arrows). Prominent left frontal hypometabolism is also seen (arrowhead in f).
Figure 2f.
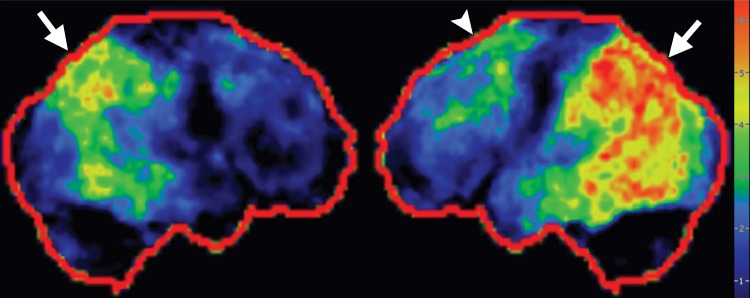
(a–c) Normal findings in a patient undergoing evaluation for possible Alzheimer disease. Axial FDG PET images (a), semiquantitative three-dimensional (3D) stereotactic surface projection (SSP) FDG PET images (b), and Z-score images (c) show normal findings. (d–f) Abnormal findings in a patient with known Alzheimer disease and progressive verbal difficulties. Axial FDG PET images (d) demonstrate marked bilateral temporoparietal hypometabolism (arrows), a finding that is confirmed on semiquantitative 3D SSP FDG PET images (e) and Z-score images (f) (arrows). Prominent left frontal hypometabolism is also seen (arrowhead in f).
Amyloid-binding PET
General Considerations.—β-amyloid plaques are present in the majority of cases of Alzheimer disease, and accumulation in the gray matter typically develops many years before the onset of dementia (12). The first experimental PET radiotracer with a high affinity for β-amyloid plaques was 11C PiB (T1/2 = 20.3 min), a derivative of thioflavin (13). Since its development, several 18F radiotracers (T1/2 = 110 min) with a high affinity for β-amyloid plaques have also been created, among them florbetapir (14), which was recently FDA approved under the trade name Amyvid (Lilly, Indianapolis, Ind). The distribution of radiolabeled amyloid-binding ligands can be imaged with PET/CT; the regional retention reflects the regional density of amyloid plaques. These radiotracers are useful not only in confirming cases of clinically suspected Alzheimer disease; they can also be used to discriminate between Alzheimer disease and frontotemporal dementia, a group of syndromes with clinical features that overlap with Alzheimer disease but do not demonstrate amyloid deposition. Most APS lack amyloid deposition. However, 11C PiB and 18F florbetapir PET scans are often positive in cases of DLB, 50%–70% of which show amyloid deposition (15).
Interpretation.—Visual interpretation of amyloid-binding PET data may be sufficient (12,14). Healthy individuals show nonspecific white matter uptake of amyloid radiotracers but minimal binding in the cortical gray matter (Fig 3a). Positive studies demonstrate cortical binding equal to or greater than white matter binding (Fig 3b). The cerebellar gray matter and pons, in both of which amyloid rarely accumulates, can be used as internal controls. Visual interpretation can be accomplished by setting the gray scale so as to clearly see the difference in uptake between the intense cerebellar white matter and mildly intense cerebellar gray matter, then inspecting the midsagittal section for uptake in the orbitofrontal cortex and posteromedial parietal area. Subsequently, axial images are evaluated for uptake in the lateral temporal, parietal, and striatal regions, again focusing on cortical activity equal to or greater than white matter activity and, therefore, loss of the visual distinction between adjacent gray matter and white matter (12,14). It is useful to correlate these findings with computed tomographic images to ensure that severe atrophy of cerebral parenchyma is not misinterpreted as lack of gray matter activity.
Figure 3a.
(a) Axial 18F florbetapir PET images obtained in a healthy patient demonstrate nonspecific cerebellar and cerebral white matter uptake (arrows) with minimal gray matter activity. (b) Axial 18F florbetapir PET images obtained in a patient with known Alzheimer disease demonstrate normal white matter uptake (arrow) and minimal gray matter uptake in the cerebellum, but marked cerebral gray matter uptake that makes gray matter–white matter differentiation difficult.
Figure 3b.
(a) Axial 18F florbetapir PET images obtained in a healthy patient demonstrate nonspecific cerebellar and cerebral white matter uptake (arrows) with minimal gray matter activity. (b) Axial 18F florbetapir PET images obtained in a patient with known Alzheimer disease demonstrate normal white matter uptake (arrow) and minimal gray matter uptake in the cerebellum, but marked cerebral gray matter uptake that makes gray matter–white matter differentiation difficult.
Various semiquantitative techniques can also be used. The ratio of cortical to cerebellar binding can be described as a standardized uptake value ratio. This ratio can be ascribed to a particular region, or the calculation can be made for the “neocortex,” as the average of the ratios in several areas known to accumulate amyloid, including the frontal lobes, lateral and medial parietal lobes, lateral temporal lobes, and anterior and posterior cingulate gyri. Generally, a standardized uptake value ratio greater than 1.3–1.6 is considered positive for amyloid deposition (12,16). Several studies have demonstrated good correlation between visual and quantitative assessment in amyloid PET interpretation (16,17).
123I Ioflupane SPECT
General Considerations.—123I ioflupane is a molecular imaging agent that is used to demonstrate the location and concentration of dopamine transporters. Dopamine transporters are located in the presynaptic nigrostriatal axons and function to clear and recycle dopamine from the synaptic cleft located in the putamen and caudate nucleus. Dopamine transporter concentrations are lower in both Parkinson disease and APS; thus, 123I ioflupane SPECT can help differentiate these syndromes from essential tremor and drug-induced parkinsonism, which have intact dopamine activity (18). 123I ioflupane SPECT has been shown to have a sensitivity and specificity exceeding 90% in differentiating between Parkinson disease and essential tremor (19). However, it cannot reliably help distinguish between Parkinson disease and APS, or even among APS, since all of these conditions demonstrate abnormal but overlapping patterns of dopamine deficiency (20,21).
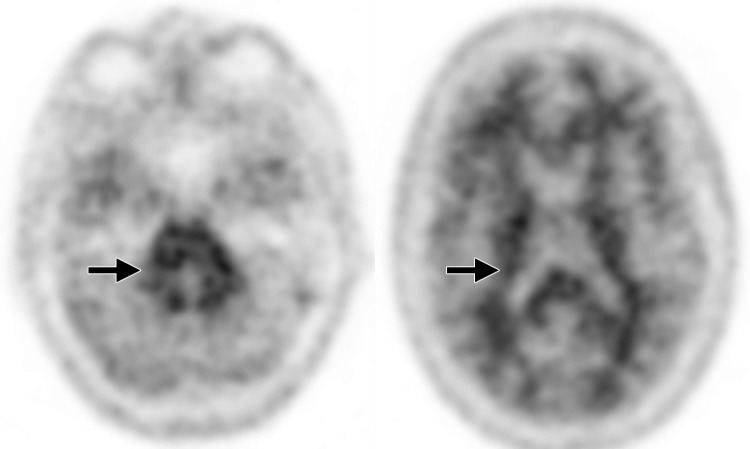
Interpretation.—Because patients generally do not become symptomatic before a significant number of striatal synapses have degenerated, the difference between normal and abnormal imaging appearances is usually clear, so that visual interpretation of the scan is sufficient for clinical evaluation (19). In healthy subjects, 123I ioflupane SPECT demonstrates two symmetric comma- or crescent-shaped regions of activity mirrored about the median plane (Fig 4a). Both striata should be symmetric in healthy individuals. Caudate and putaminal activity should be compared; generally, the putamen—in particular, the posterior putamen—is affected earlier and to a greater degree than the caudate nucleus in patients with parkinsonism. In addition, disease often manifests first in the putamen contralateral to the neurologic signs (22). Abnormal studies typically fall into one of three categories: (a) asymmetric decreased putaminal activity (Fig 4b), (b) absence of putaminal activity but preserved caudate activity (Fig 4c), or (c) absence of putaminal activity and greatly reduced activity in one or both caudate nuclei (Fig 4d). It should be noted that certain medications (eg, selegiline, sertraline, citalopram, and paroxetine) can significantly affect the scan, and their presence must be documented and considered prior to injection (18).
Figure 4a.
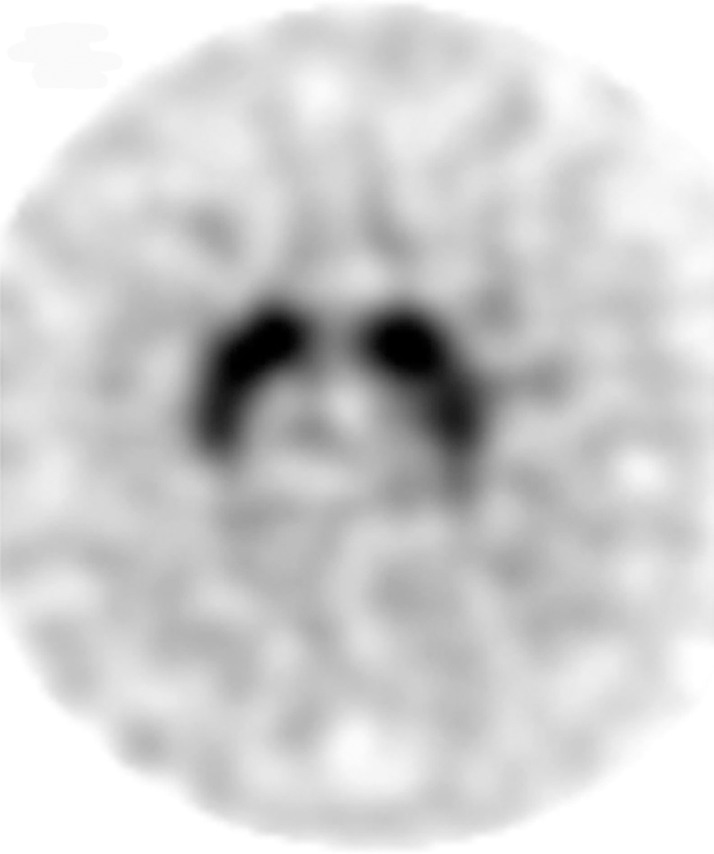
Visualization of dopamine transporters at 123I ioflupane SPECT. (a) 123I ioflupane SPECT image obtained in a healthy subject shows two symmetric comma- or crescent-shaped regions of activity mirrored about the median plane. (b–d) 123I ioflupane SPECT images show abnormal patterns, including mild abnormality with asymmetric decreased putaminal activity (arrow in b), moderate abnormality with no putaminal activity but preserved caudate activity (arrows in c), and severe abnormality with no putaminal activity and greatly reduced activity in one or both caudate nuclei (arrowhead in d).
Figure 4b.
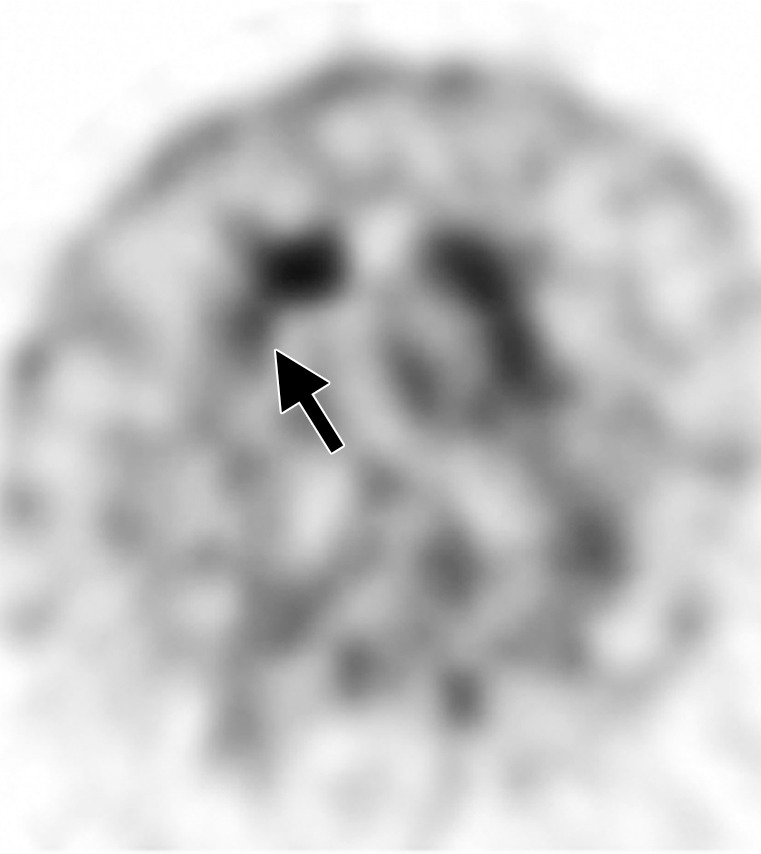
Visualization of dopamine transporters at 123I ioflupane SPECT. (a) 123I ioflupane SPECT image obtained in a healthy subject shows two symmetric comma- or crescent-shaped regions of activity mirrored about the median plane. (b–d) 123I ioflupane SPECT images show abnormal patterns, including mild abnormality with asymmetric decreased putaminal activity (arrow in b), moderate abnormality with no putaminal activity but preserved caudate activity (arrows in c), and severe abnormality with no putaminal activity and greatly reduced activity in one or both caudate nuclei (arrowhead in d).
Figure 4c.
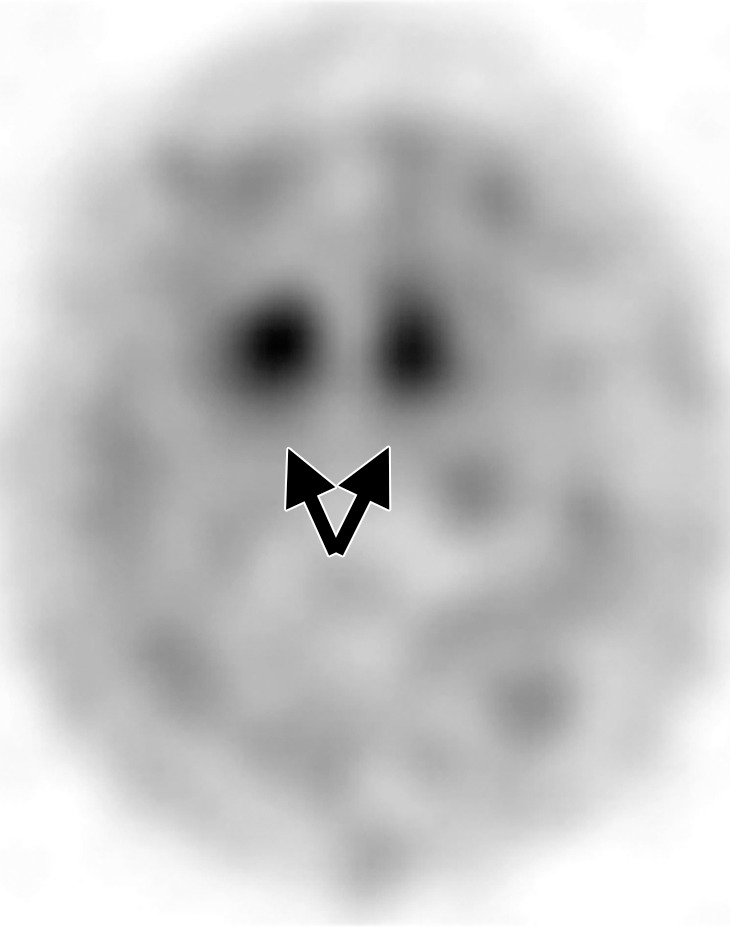
Visualization of dopamine transporters at 123I ioflupane SPECT. (a) 123I ioflupane SPECT image obtained in a healthy subject shows two symmetric comma- or crescent-shaped regions of activity mirrored about the median plane. (b–d) 123I ioflupane SPECT images show abnormal patterns, including mild abnormality with asymmetric decreased putaminal activity (arrow in b), moderate abnormality with no putaminal activity but preserved caudate activity (arrows in c), and severe abnormality with no putaminal activity and greatly reduced activity in one or both caudate nuclei (arrowhead in d).
Figure 4d.
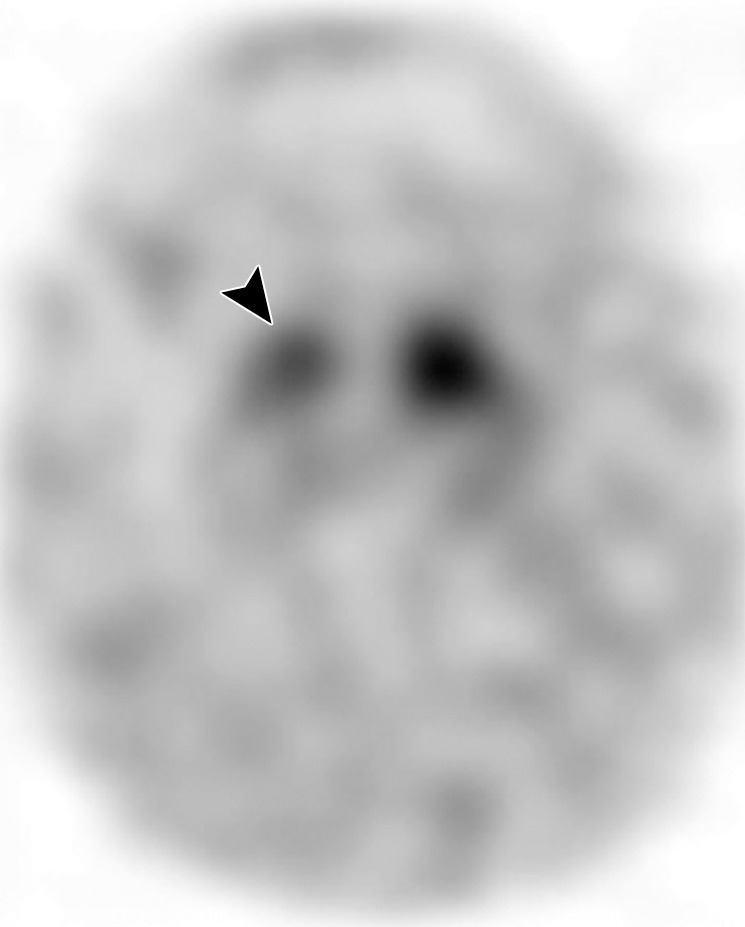
Visualization of dopamine transporters at 123I ioflupane SPECT. (a) 123I ioflupane SPECT image obtained in a healthy subject shows two symmetric comma- or crescent-shaped regions of activity mirrored about the median plane. (b–d) 123I ioflupane SPECT images show abnormal patterns, including mild abnormality with asymmetric decreased putaminal activity (arrow in b), moderate abnormality with no putaminal activity but preserved caudate activity (arrows in c), and severe abnormality with no putaminal activity and greatly reduced activity in one or both caudate nuclei (arrowhead in d).
Idiopathic Parkinson Disease
Clinical Features
The clinical diagnosis of Parkinson disease relies on the presence of bradykinesia plus one of the following cardinal symptoms: tremor, rigidity, or gait disturbance (7,23). An excellent initial response to dopaminergic therapy is also important. Additional supportive features, which also allow differentiation from APS, include presence of rest tremor, unilateral onset, and persistent asymmetry throughout the course of the disease with the side of onset most affected (24,25).
Imaging Findings
Conventional MR imaging is usually not helpful in the diagnosis of early Parkinson disease because it most often yields normal findings (Fig 5a). In advanced disease, abnormalities of the substantia nigra, including volume loss, decreased T2 signal reflecting iron deposition, and blurring of the margins, can be seen (26–28). However, the primary use of MR imaging is to exclude specific structural abnormalities that could potentially mimic Parkinson disease (eg, normal-pressure hydrocephalus, intracranial mass, and bilateral subdural hematomas).
Figure 5a.
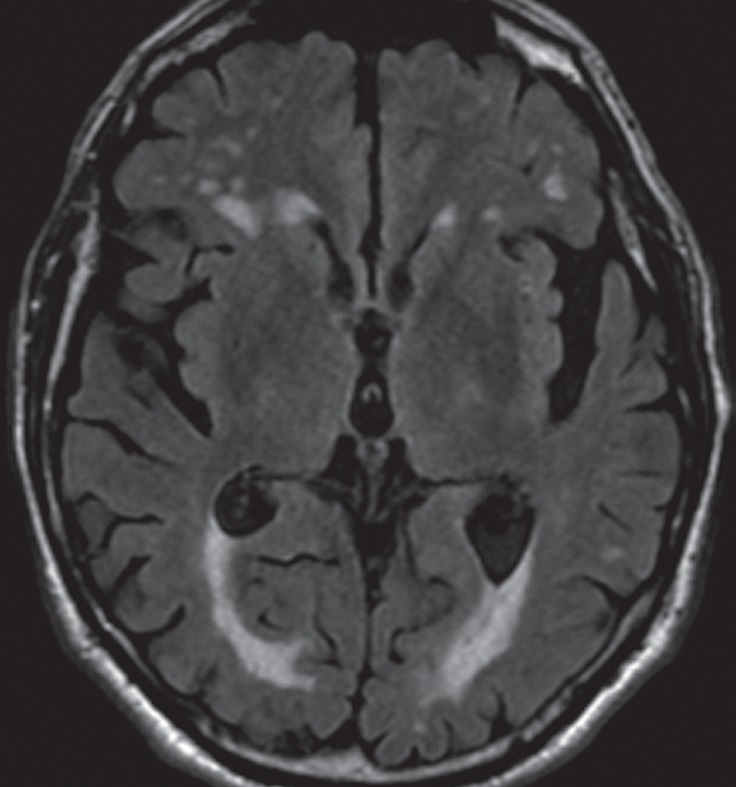
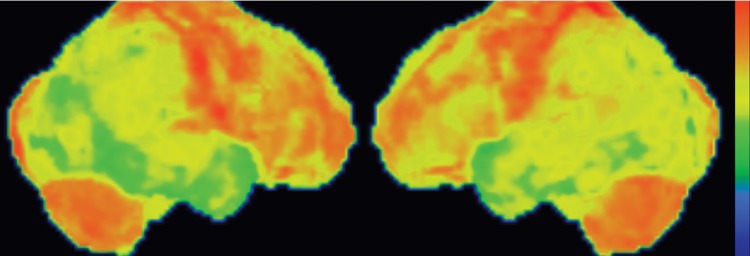
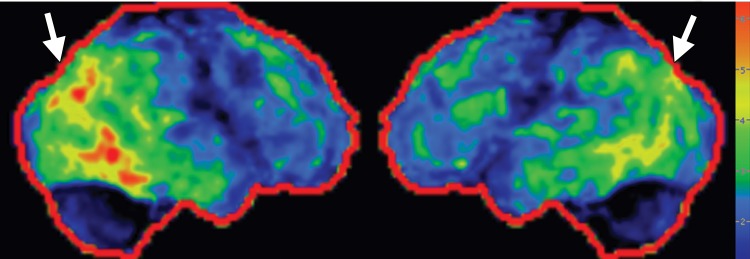
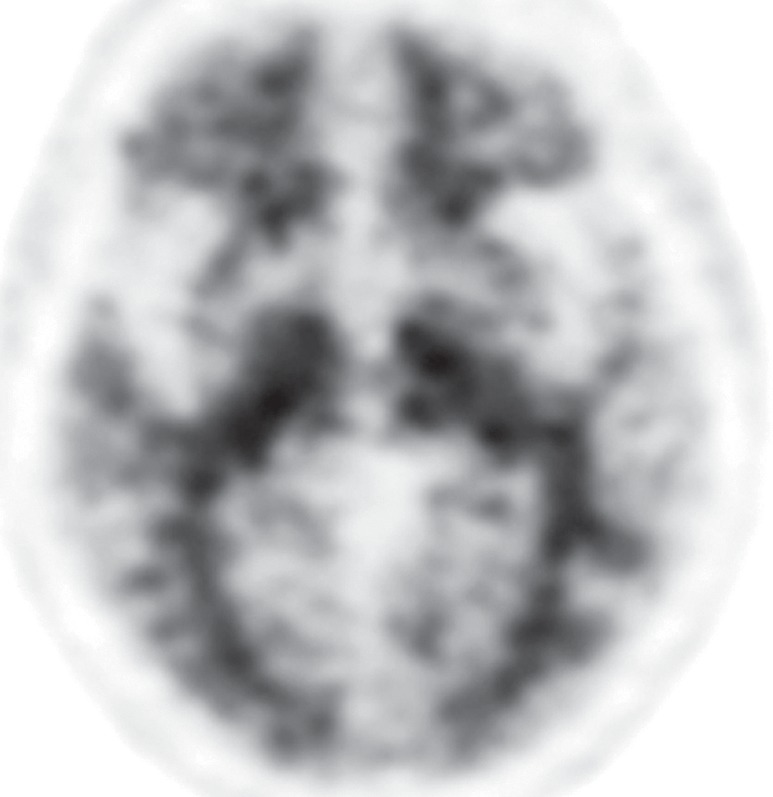
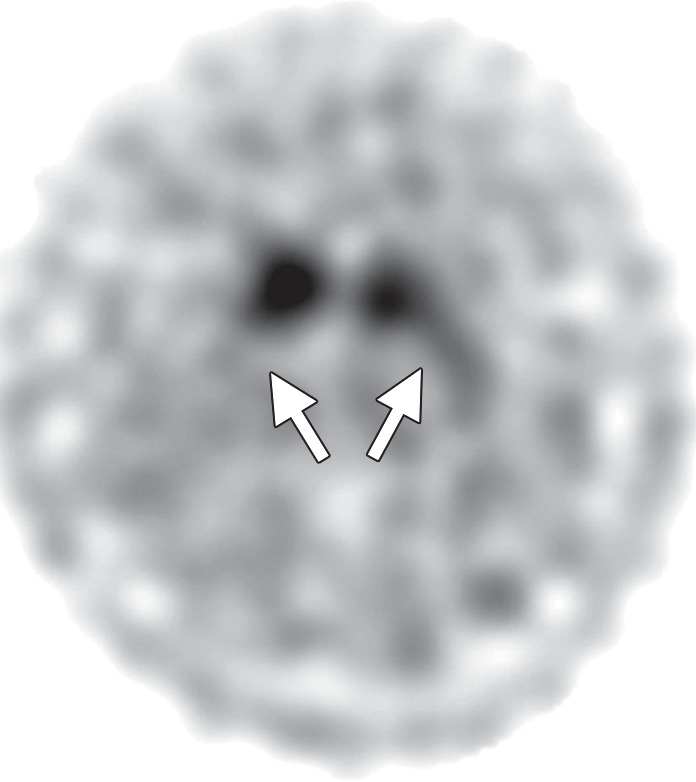
Idiopathic Parkinson disease. (a) Axial FLAIR MR image shows hyperintense foci in the periventricular and subcortical white matter related to chronic small vessel ischemic disease. The white matter is otherwise normal. (b) FDG PET image shows parietal hypometabolism (arrows) and preserved basal ganglia activity. (c) Amyloid PET image demonstrates normal findings. (d, e) Semiquantitative 3D SSP FDG PET images (d) and Z-score images (e) show decreased temporal and parietal activity (arrows in e). (f) 123I ioflupane SPECT image shows markedly decreased uptake in the putamina (arrows).
FDG PET images are most often normal and show preserved metabolism in the putamen and globus pallidus (Fig 5b). This preservation of metabolic activity in the basal ganglia is a defining imaging feature of Parkinson disease and allows differentiation from both PSP and MSA, which commonly demonstrate reduced basal ganglia FDG activity. Occasionally, patients with Parkinson disease may demonstrate cortical hypometabolism in both parieto-occipital association areas (Fig 5b, 5d, 5e) and the dorsolateral prefrontal cortex, similar to the pattern seen in Alzheimer disease (29,30). When a pattern similar to that seen in Alzheimer disease is encountered, amyloid PET can be very useful, since it usually yields normal findings in patients with Parkinson disease (Fig 5c). However, it must be noted that because both Parkinson disease and Alzheimer disease are quite common, especially in an aging population, the presence of amyloid does not exclude Parkinson disease, since patients can sometimes have both conditions. 123I ioflupane SPECT reveals reduced uptake in the striata (Fig 5f), which is (a) more pronounced in the posterior putamen and caudate nucleus, and (b) usually asymmetric, with more severe reduction in activity contralateral to the clinically affected limb (4,31).
Figure 5b.
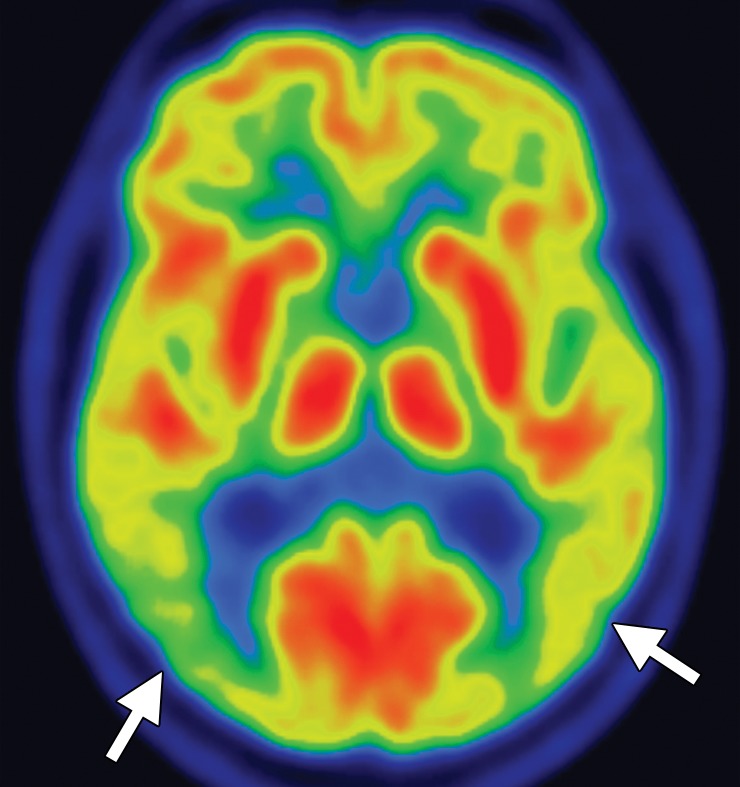
Idiopathic Parkinson disease. (a) Axial FLAIR MR image shows hyperintense foci in the periventricular and subcortical white matter related to chronic small vessel ischemic disease. The white matter is otherwise normal. (b) FDG PET image shows parietal hypometabolism (arrows) and preserved basal ganglia activity. (c) Amyloid PET image demonstrates normal findings. (d, e) Semiquantitative 3D SSP FDG PET images (d) and Z-score images (e) show decreased temporal and parietal activity (arrows in e). (f) 123I ioflupane SPECT image shows markedly decreased uptake in the putamina (arrows).
Figure 5d.
Idiopathic Parkinson disease. (a) Axial FLAIR MR image shows hyperintense foci in the periventricular and subcortical white matter related to chronic small vessel ischemic disease. The white matter is otherwise normal. (b) FDG PET image shows parietal hypometabolism (arrows) and preserved basal ganglia activity. (c) Amyloid PET image demonstrates normal findings. (d, e) Semiquantitative 3D SSP FDG PET images (d) and Z-score images (e) show decreased temporal and parietal activity (arrows in e). (f) 123I ioflupane SPECT image shows markedly decreased uptake in the putamina (arrows).
Figure 5e.
Idiopathic Parkinson disease. (a) Axial FLAIR MR image shows hyperintense foci in the periventricular and subcortical white matter related to chronic small vessel ischemic disease. The white matter is otherwise normal. (b) FDG PET image shows parietal hypometabolism (arrows) and preserved basal ganglia activity. (c) Amyloid PET image demonstrates normal findings. (d, e) Semiquantitative 3D SSP FDG PET images (d) and Z-score images (e) show decreased temporal and parietal activity (arrows in e). (f) 123I ioflupane SPECT image shows markedly decreased uptake in the putamina (arrows).
Figure 5c.
Idiopathic Parkinson disease. (a) Axial FLAIR MR image shows hyperintense foci in the periventricular and subcortical white matter related to chronic small vessel ischemic disease. The white matter is otherwise normal. (b) FDG PET image shows parietal hypometabolism (arrows) and preserved basal ganglia activity. (c) Amyloid PET image demonstrates normal findings. (d, e) Semiquantitative 3D SSP FDG PET images (d) and Z-score images (e) show decreased temporal and parietal activity (arrows in e). (f) 123I ioflupane SPECT image shows markedly decreased uptake in the putamina (arrows).
Figure 5f.
Idiopathic Parkinson disease. (a) Axial FLAIR MR image shows hyperintense foci in the periventricular and subcortical white matter related to chronic small vessel ischemic disease. The white matter is otherwise normal. (b) FDG PET image shows parietal hypometabolism (arrows) and preserved basal ganglia activity. (c) Amyloid PET image demonstrates normal findings. (d, e) Semiquantitative 3D SSP FDG PET images (d) and Z-score images (e) show decreased temporal and parietal activity (arrows in e). (f) 123I ioflupane SPECT image shows markedly decreased uptake in the putamina (arrows).
Multiple System Atrophy
Clinical Features
The term multiple system atrophy encompasses a group of neurodegenerative disorders, including olivopontocerebellar atrophy, Shy-Drager syndrome, and striatonigral degeneration. MSA is characterized by varying degrees of parkinsonism, cerebellar ataxia, and prominent autonomic dysfunction, including urinary dysfunction and orthostatic hypotension (32). Affected patients are generally classified as having parkinsonian type MSA (MSA-P) or cerebellar ataxia type MSA (MSA-C) on the basis of predominating symptoms. The term Shy-Drager syndrome may be used when autonomic dysfunction predominates. Limb ataxia, which manifests as past-pointing at finger-nose testing, is seen in MSA but rarely in Parkinson disease and can be a useful clinical discriminator (8). Postural instability and falls, bulbar involvement, pyramidal signs including an extensor plantar reflex, and disease progression despite dopaminergic treatment also suggest MSA rather than Parkinson disease (33,34). Executive function tends to be relatively well preserved in MSA compared with Parkinson disease and other APS (35).
Imaging Findings
There are a few distinct MR imaging patterns seen in MSA that differ between MSA-P and MSA-C. In patients with MSA-P, abnormalities are typically confined to the putamen and include atrophy, symmetric hypointensity on T2- and T2*-weighted images, and “slitlike” marginal T2 hyperintensity (27,36,37). The presence of putaminal atrophy appears to help discriminate MSA from Parkinson disease (38), whereas putaminal T2 hypointensity is a nonspecific sign that can also be seen in PSP, Wilson disease, neurodegeneration with brain iron accumulation, and other acquired conditions (9). Similarly, external putaminal T2 hyperintensity can be seen in Parkinson disease, and has even been reported to be a normal finding in healthy subjects at 3.0-T MR imaging (39).
Patients with MSA-C often show selective atrophy of the lower portion of the basis pontis, medulla, middle cerebellar peduncles, and cerebellar hemispheres, with widening of the fourth ventricle (Fig 6a) (9,27). Corresponding increased T2 signal is seen in the pons, middle cerebellar peduncles, and cerebellar white matter, with sparing of the corticospinal tracts and superior cerebellar peduncles (40). These changes may produce a cruciform T2 hyperintensity within the basis pontis, popularly referred to as the hot cross bun sign (Fig 6b). This sign has relatively high sensitivity for MSA-C, being reported in up to 80% of patients (33); however, it is not specific for MSA, since it is also seen in many spinocerebellar ataxia subtypes (39).
Figure 6a.
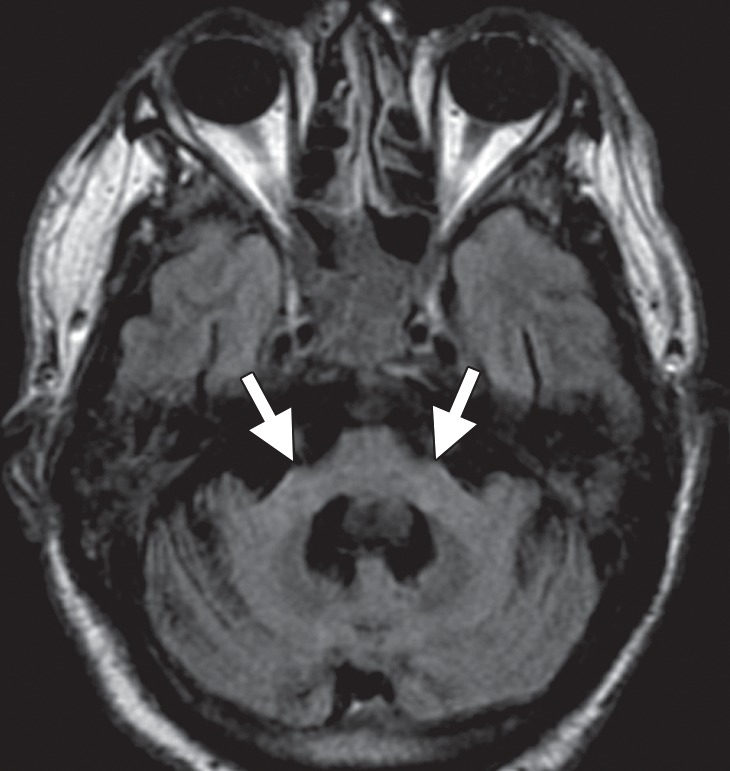
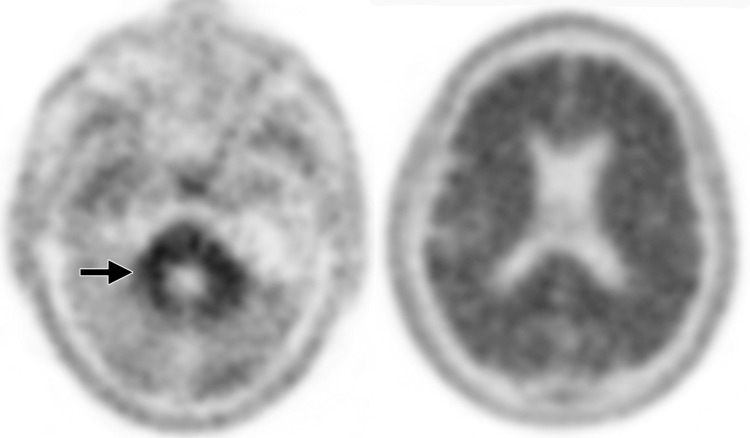
Cerebellar dominant type MSA. (a, b) Axial FLAIR MR images demonstrate marked focal atrophy of the midbrain and both middle cerebral peduncles (arrows in a) with ex vacuo dilatation of the fourth ventricle, as well as subtle cruciform T2 hyperintensity in the pons (hot cross bun sign) (arrow in b). (c, d) Axial FDG PET images demonstrate cerebellar hypometabolism (arrows in c). (e) Amyloid PET image shows normal findings. (f, g) Semiquantitative 3D SSP FDG PET images (f ) and Z-score images (g) obtained for quantitative cortical analysis demonstrate cerebellar hypometabolism (arrows in g), thereby confirming the findings seen at axial FDG PET. (h) 123I ioflupane SPECT image shows bilateral loss of putaminal activity (arrows) and symmetric decreased activity in the caudate nuclei (arrowheads).
Figure 6b.
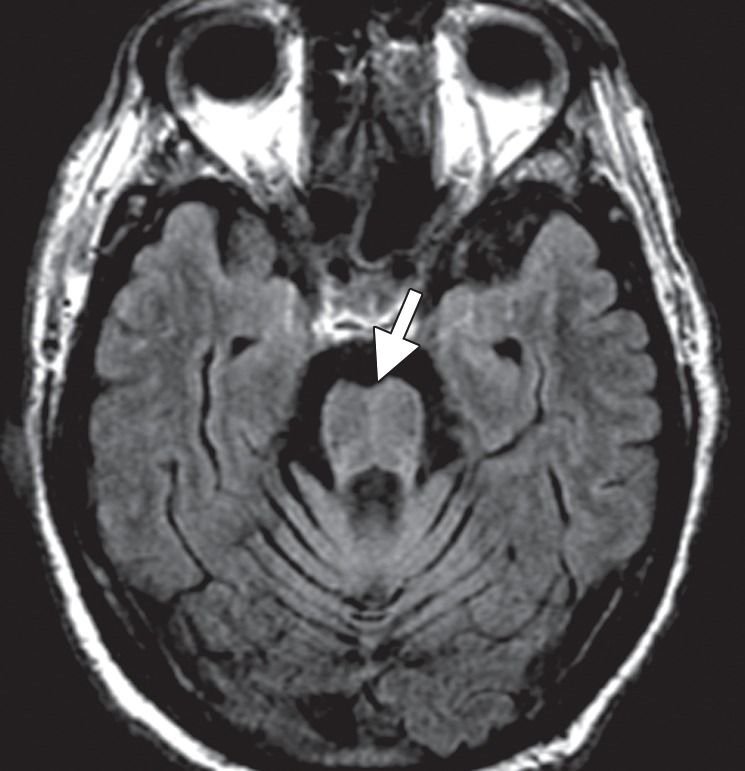
Cerebellar dominant type MSA. (a, b) Axial FLAIR MR images demonstrate marked focal atrophy of the midbrain and both middle cerebral peduncles (arrows in a) with ex vacuo dilatation of the fourth ventricle, as well as subtle cruciform T2 hyperintensity in the pons (hot cross bun sign) (arrow in b). (c, d) Axial FDG PET images demonstrate cerebellar hypometabolism (arrows in c). (e) Amyloid PET image shows normal findings. (f, g) Semiquantitative 3D SSP FDG PET images (f ) and Z-score images (g) obtained for quantitative cortical analysis demonstrate cerebellar hypometabolism (arrows in g), thereby confirming the findings seen at axial FDG PET. (h) 123I ioflupane SPECT image shows bilateral loss of putaminal activity (arrows) and symmetric decreased activity in the caudate nuclei (arrowheads).
Taken in combination, these patterns of atrophy and T2 signal change in the putamen and infratentorial structures in both MSA subtypes are relatively specific in distinguishing patients with Parkinson disease from healthy control subjects. However, their sensitivity in the detection of MSA, particularly in the early stages, is suboptimal (27,33,38).
FDG PET may reveal patterns of regional hypometabolism that mirror areas of atrophy and T2 signal alteration at MR imaging. Specifically, patients with MSA-P demonstrate relatively symmetric decreased putaminal FDG activity, and patients with MSA-C show reduced FDG activity in the cerebellar hemispheres and middle cerebellar peduncles (Fig 6c, 6d, 6f, 6g) (29,30,41). Interestingly, cerebellar hypometabolism may be seen in patients without clinical signs of cerebellar dysfunction, and also in patients with MSA-P (29). These patterns are useful in distinguishing MSA from Parkinson disease, which demonstrates normal putaminal and cerebellar metabolism. No cortical deposition is seen at amyloid PET (Fig 6e). 123I ioflupane SPECT findings are abnormal in MSA patients, with varying degrees of unilateral or bilateral decreased striatal uptake (Fig 6h).
Figure 6c.
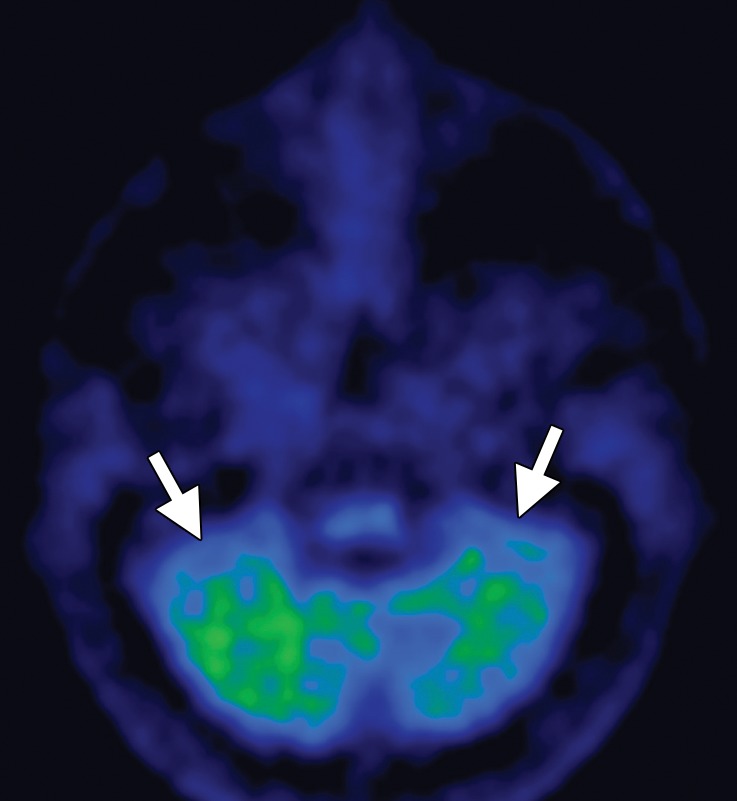
Cerebellar dominant type MSA. (a, b) Axial FLAIR MR images demonstrate marked focal atrophy of the midbrain and both middle cerebral peduncles (arrows in a) with ex vacuo dilatation of the fourth ventricle, as well as subtle cruciform T2 hyperintensity in the pons (hot cross bun sign) (arrow in b). (c, d) Axial FDG PET images demonstrate cerebellar hypometabolism (arrows in c). (e) Amyloid PET image shows normal findings. (f, g) Semiquantitative 3D SSP FDG PET images (f ) and Z-score images (g) obtained for quantitative cortical analysis demonstrate cerebellar hypometabolism (arrows in g), thereby confirming the findings seen at axial FDG PET. (h) 123I ioflupane SPECT image shows bilateral loss of putaminal activity (arrows) and symmetric decreased activity in the caudate nuclei (arrowheads).
Figure 6d.
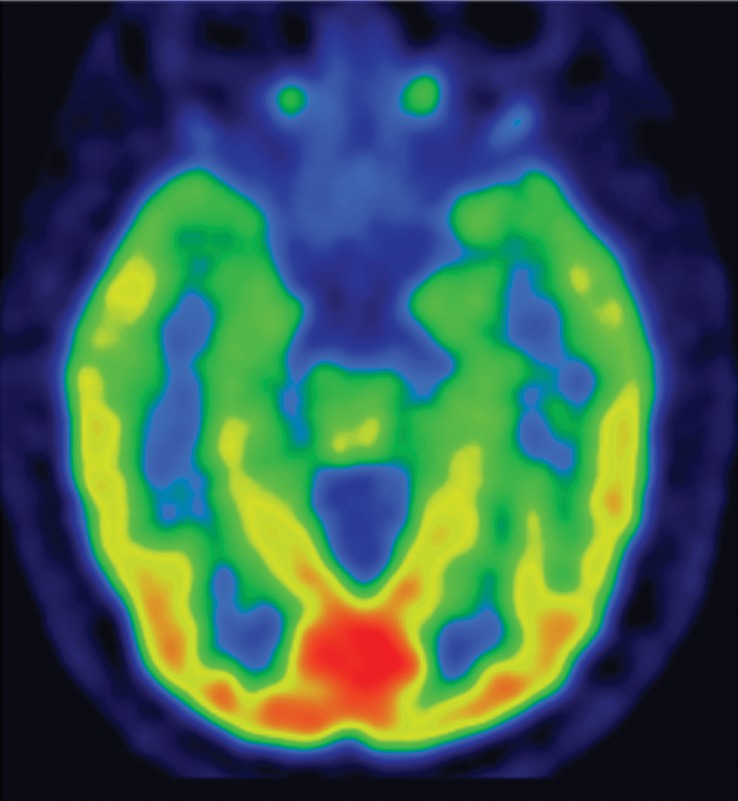
Cerebellar dominant type MSA. (a, b) Axial FLAIR MR images demonstrate marked focal atrophy of the midbrain and both middle cerebral peduncles (arrows in a) with ex vacuo dilatation of the fourth ventricle, as well as subtle cruciform T2 hyperintensity in the pons (hot cross bun sign) (arrow in b). (c, d) Axial FDG PET images demonstrate cerebellar hypometabolism (arrows in c). (e) Amyloid PET image shows normal findings. (f, g) Semiquantitative 3D SSP FDG PET images (f ) and Z-score images (g) obtained for quantitative cortical analysis demonstrate cerebellar hypometabolism (arrows in g), thereby confirming the findings seen at axial FDG PET. (h) 123I ioflupane SPECT image shows bilateral loss of putaminal activity (arrows) and symmetric decreased activity in the caudate nuclei (arrowheads).
Figure 6f.
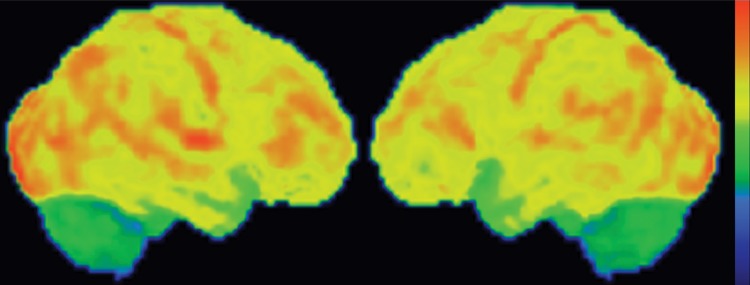
Cerebellar dominant type MSA. (a, b) Axial FLAIR MR images demonstrate marked focal atrophy of the midbrain and both middle cerebral peduncles (arrows in a) with ex vacuo dilatation of the fourth ventricle, as well as subtle cruciform T2 hyperintensity in the pons (hot cross bun sign) (arrow in b). (c, d) Axial FDG PET images demonstrate cerebellar hypometabolism (arrows in c). (e) Amyloid PET image shows normal findings. (f, g) Semiquantitative 3D SSP FDG PET images (f ) and Z-score images (g) obtained for quantitative cortical analysis demonstrate cerebellar hypometabolism (arrows in g), thereby confirming the findings seen at axial FDG PET. (h) 123I ioflupane SPECT image shows bilateral loss of putaminal activity (arrows) and symmetric decreased activity in the caudate nuclei (arrowheads).
Figure 6g.
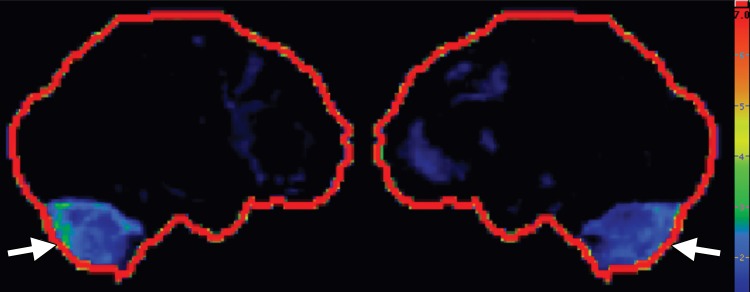
Cerebellar dominant type MSA. (a, b) Axial FLAIR MR images demonstrate marked focal atrophy of the midbrain and both middle cerebral peduncles (arrows in a) with ex vacuo dilatation of the fourth ventricle, as well as subtle cruciform T2 hyperintensity in the pons (hot cross bun sign) (arrow in b). (c, d) Axial FDG PET images demonstrate cerebellar hypometabolism (arrows in c). (e) Amyloid PET image shows normal findings. (f, g) Semiquantitative 3D SSP FDG PET images (f ) and Z-score images (g) obtained for quantitative cortical analysis demonstrate cerebellar hypometabolism (arrows in g), thereby confirming the findings seen at axial FDG PET. (h) 123I ioflupane SPECT image shows bilateral loss of putaminal activity (arrows) and symmetric decreased activity in the caudate nuclei (arrowheads).
Figure 6e.
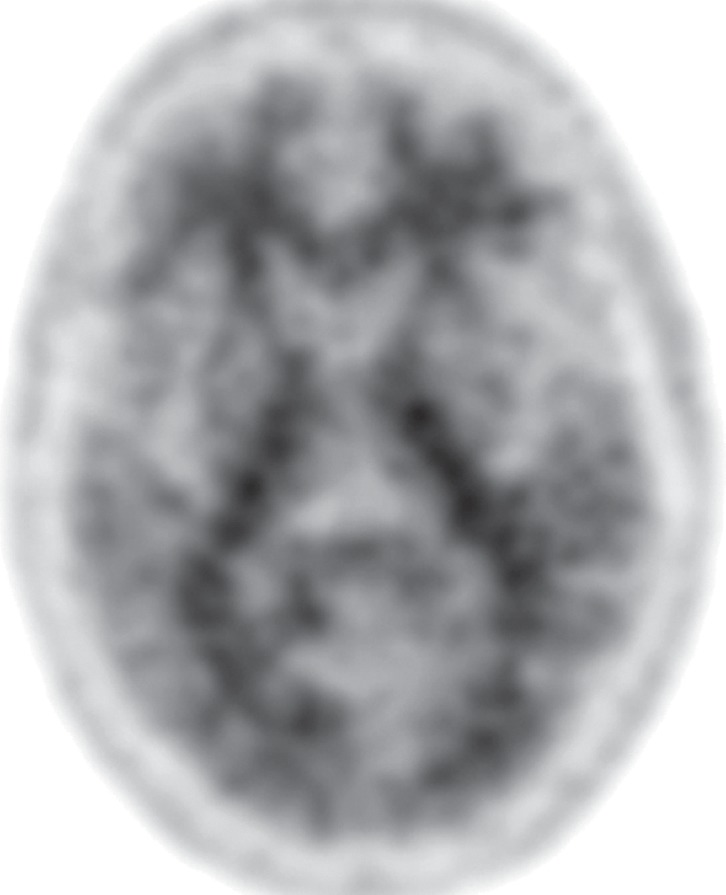
Cerebellar dominant type MSA. (a, b) Axial FLAIR MR images demonstrate marked focal atrophy of the midbrain and both middle cerebral peduncles (arrows in a) with ex vacuo dilatation of the fourth ventricle, as well as subtle cruciform T2 hyperintensity in the pons (hot cross bun sign) (arrow in b). (c, d) Axial FDG PET images demonstrate cerebellar hypometabolism (arrows in c). (e) Amyloid PET image shows normal findings. (f, g) Semiquantitative 3D SSP FDG PET images (f ) and Z-score images (g) obtained for quantitative cortical analysis demonstrate cerebellar hypometabolism (arrows in g), thereby confirming the findings seen at axial FDG PET. (h) 123I ioflupane SPECT image shows bilateral loss of putaminal activity (arrows) and symmetric decreased activity in the caudate nuclei (arrowheads).
Figure 6h.
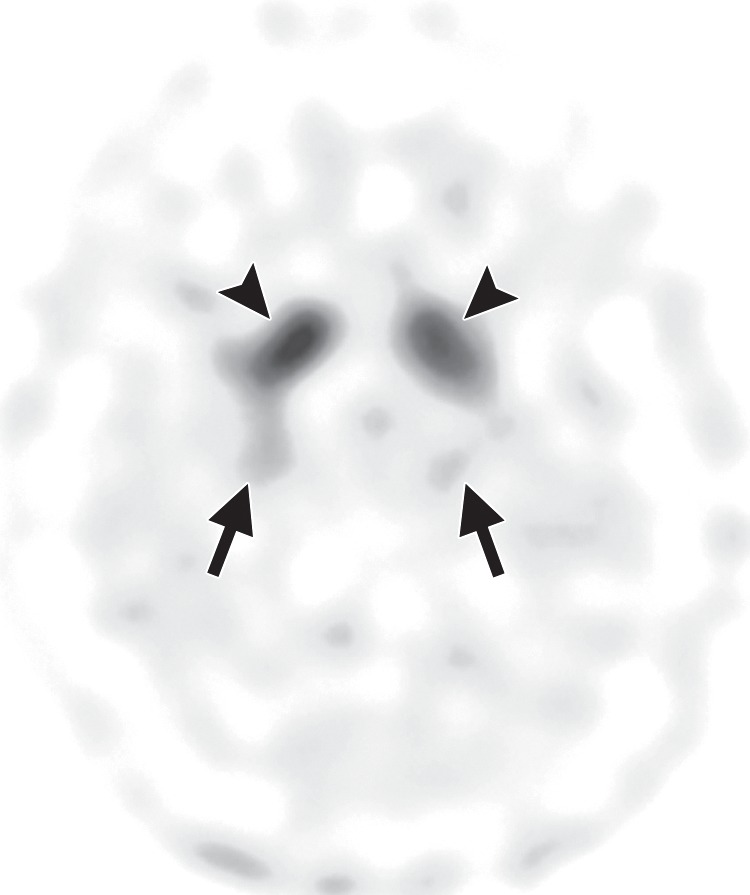
Cerebellar dominant type MSA. (a, b) Axial FLAIR MR images demonstrate marked focal atrophy of the midbrain and both middle cerebral peduncles (arrows in a) with ex vacuo dilatation of the fourth ventricle, as well as subtle cruciform T2 hyperintensity in the pons (hot cross bun sign) (arrow in b). (c, d) Axial FDG PET images demonstrate cerebellar hypometabolism (arrows in c). (e) Amyloid PET image shows normal findings. (f, g) Semiquantitative 3D SSP FDG PET images (f ) and Z-score images (g) obtained for quantitative cortical analysis demonstrate cerebellar hypometabolism (arrows in g), thereby confirming the findings seen at axial FDG PET. (h) 123I ioflupane SPECT image shows bilateral loss of putaminal activity (arrows) and symmetric decreased activity in the caudate nuclei (arrowheads).
Progressive Supranuclear Palsy
Clinical Features
PSP is characterized by parkinsonism with bradykinesia and rigidity, postural instability, and a pseudobulbar syndrome with dysarthria and dysphagia. The key feature of PSP is supranuclear palsy of vertical gaze; however, this finding may be absent at disease onset. In contrast to Parkinson disease, PSP manifests as a symmetric rather than asymmetric akinetic-rigid syndrome. PSP also initially targets the trunk and neck rather than the limbs, causing early postural and gait instability with falls. As such, PSP and MSA are the most likely causes of unexplained postural instability and falls occurring within 1 year after the onset of parkinsonian symptoms (8,42,43).
Imaging Findings
A number of structural and signal changes at MR imaging are unique to PSP. Patients often exhibit atrophy of the midbrain and tegmentum, manifesting as third ventricular dilatation, reduced midbrain anteroposterior diameter, or flattening or concavity of the superior midbrain (27,28,44). Reduced midbrain anteroposterior diameter at the level of the superior colliculi on axial images gives rise to an appearance that some have referred to as the Mickey Mouse sign (Fig 7a). Midbrain atrophy with relative preservation of the pons produces an appearance some refer to as the hummingbird sign (45) or “penguin sign” (46), with the tegmentum representing the head with a long, thin beak, and the pons the body of the hummingbird or penguin (Fig 7b). Additional findings include superior cerebellar peduncle atrophy and increased FLAIR signal, both of which have reasonably high sensitivity and specificity in distinguishing PSP from Parkinson disease and MSA (47,48).
Figure 7a.
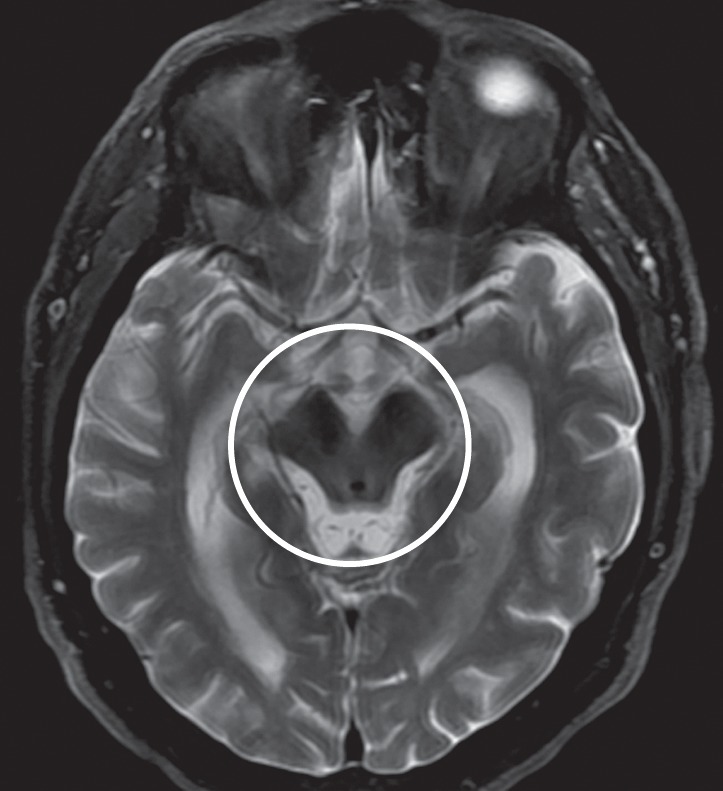
PSP. (a) Axial fast spin-echo T2-weighted MR image demonstrates the Mickey Mouse sign (circle), created by selective midbrain atrophy with relative preservation of the cerebral peduncles and tectum. (b) Midsagittal T1-weighted MR image demonstrates the hummingbird sign (oval), created by selective atrophy of the midbrain tegmentum with relative pontine preservation. (c, d) Axial FDG PET images show hypometabolism in the posterior frontal lobes and basal ganglia, worse on the right side (arrow in c). (e) Amyloid PET image shows normal findings. (f–h) Semiquantitative 3D SSP FDG PET images (f) and Z-score images (g, h) obtained for quantitative analysis show posterior frontal lobe hypometabolism (arrows in g), best seen on the superior view (oval in h). (i) 123I ioflupane SPECT image shows decreased bilateral putaminal dopaminergic activity, more notably on the right side (arrow).
Figure 7b.
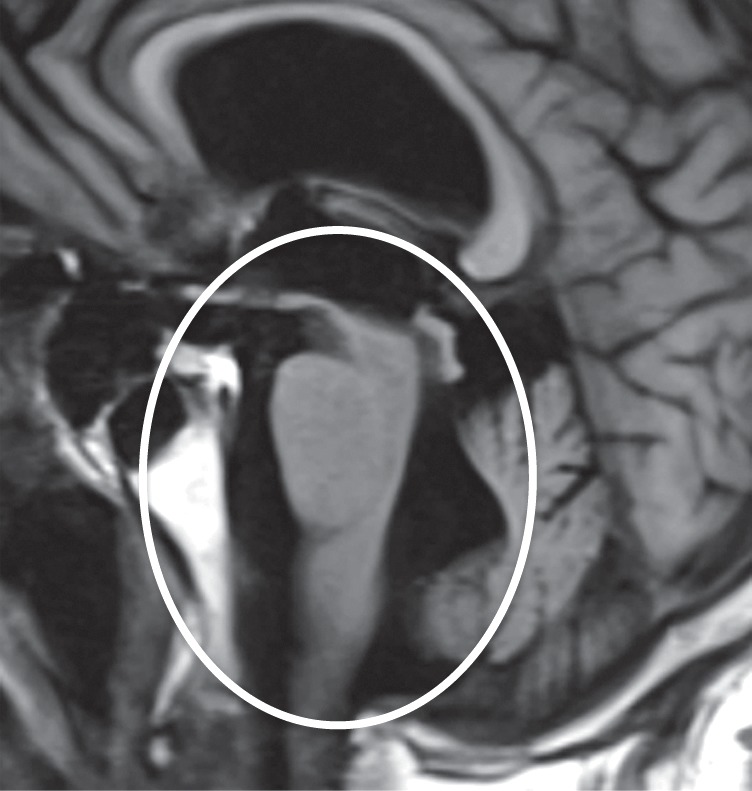
PSP. (a) Axial fast spin-echo T2-weighted MR image demonstrates the Mickey Mouse sign (circle), created by selective midbrain atrophy with relative preservation of the cerebral peduncles and tectum. (b) Midsagittal T1-weighted MR image demonstrates the hummingbird sign (oval), created by selective atrophy of the midbrain tegmentum with relative pontine preservation. (c, d) Axial FDG PET images show hypometabolism in the posterior frontal lobes and basal ganglia, worse on the right side (arrow in c). (e) Amyloid PET image shows normal findings. (f–h) Semiquantitative 3D SSP FDG PET images (f) and Z-score images (g, h) obtained for quantitative analysis show posterior frontal lobe hypometabolism (arrows in g), best seen on the superior view (oval in h). (i) 123I ioflupane SPECT image shows decreased bilateral putaminal dopaminergic activity, more notably on the right side (arrow).
Figure 7g.
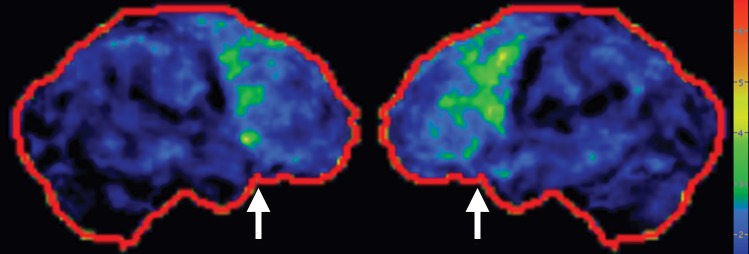
PSP. (a) Axial fast spin-echo T2-weighted MR image demonstrates the Mickey Mouse sign (circle), created by selective midbrain atrophy with relative preservation of the cerebral peduncles and tectum. (b) Midsagittal T1-weighted MR image demonstrates the hummingbird sign (oval), created by selective atrophy of the midbrain tegmentum with relative pontine preservation. (c, d) Axial FDG PET images show hypometabolism in the posterior frontal lobes and basal ganglia, worse on the right side (arrow in c). (e) Amyloid PET image shows normal findings. (f–h) Semiquantitative 3D SSP FDG PET images (f) and Z-score images (g, h) obtained for quantitative analysis show posterior frontal lobe hypometabolism (arrows in g), best seen on the superior view (oval in h). (i) 123I ioflupane SPECT image shows decreased bilateral putaminal dopaminergic activity, more notably on the right side (arrow).
FDG PET reveals decreased glucose metabolism in the basal ganglia, midbrain, and midline frontal lobes—in particular, the anterior cingulate cortices (Fig 7c, 7d, 7f–7h) (29,30,41). There is no corresponding cortical deposition at amyloid PET (Fig 7e). 123I ioflupane SPECT demonstrates reduced striatal dopaminergic activity with variable patterns, which may be symmetric or asymmetric and may affect the putamen or caudate nucleus (Fig 7i) (20).
Figure 7c.
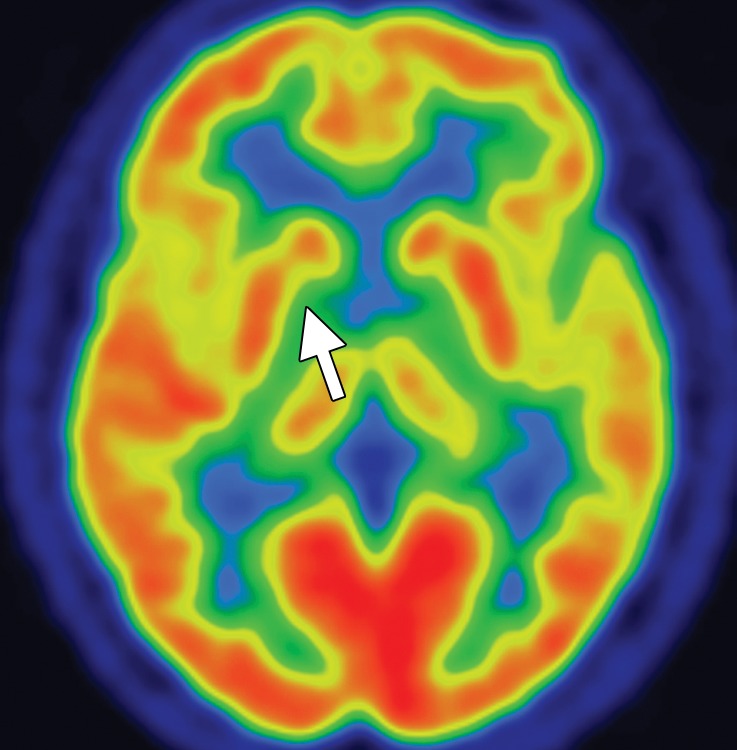
PSP. (a) Axial fast spin-echo T2-weighted MR image demonstrates the Mickey Mouse sign (circle), created by selective midbrain atrophy with relative preservation of the cerebral peduncles and tectum. (b) Midsagittal T1-weighted MR image demonstrates the hummingbird sign (oval), created by selective atrophy of the midbrain tegmentum with relative pontine preservation. (c, d) Axial FDG PET images show hypometabolism in the posterior frontal lobes and basal ganglia, worse on the right side (arrow in c). (e) Amyloid PET image shows normal findings. (f–h) Semiquantitative 3D SSP FDG PET images (f) and Z-score images (g, h) obtained for quantitative analysis show posterior frontal lobe hypometabolism (arrows in g), best seen on the superior view (oval in h). (i) 123I ioflupane SPECT image shows decreased bilateral putaminal dopaminergic activity, more notably on the right side (arrow).
Figure 7d.
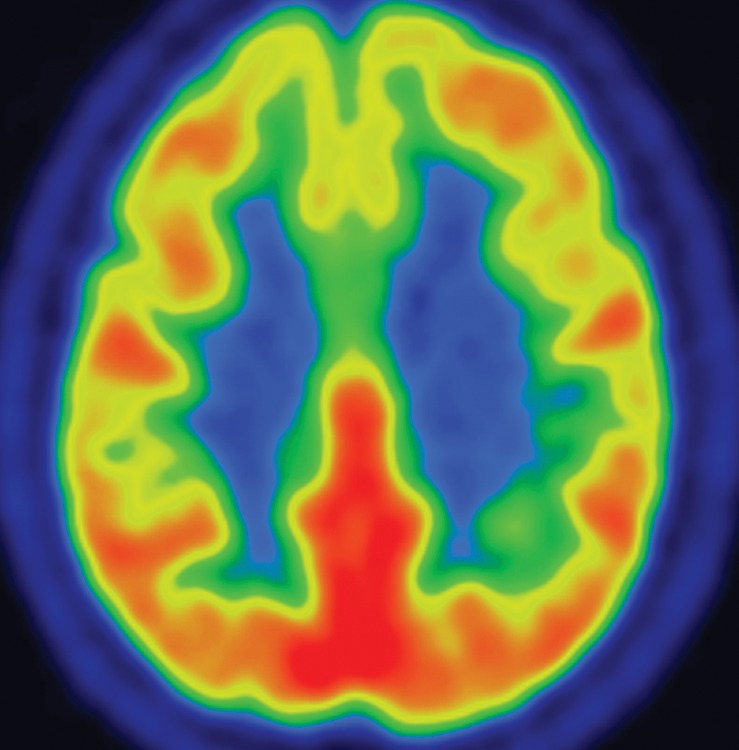
PSP. (a) Axial fast spin-echo T2-weighted MR image demonstrates the Mickey Mouse sign (circle), created by selective midbrain atrophy with relative preservation of the cerebral peduncles and tectum. (b) Midsagittal T1-weighted MR image demonstrates the hummingbird sign (oval), created by selective atrophy of the midbrain tegmentum with relative pontine preservation. (c, d) Axial FDG PET images show hypometabolism in the posterior frontal lobes and basal ganglia, worse on the right side (arrow in c). (e) Amyloid PET image shows normal findings. (f–h) Semiquantitative 3D SSP FDG PET images (f) and Z-score images (g, h) obtained for quantitative analysis show posterior frontal lobe hypometabolism (arrows in g), best seen on the superior view (oval in h). (i) 123I ioflupane SPECT image shows decreased bilateral putaminal dopaminergic activity, more notably on the right side (arrow).
Figure 7f.
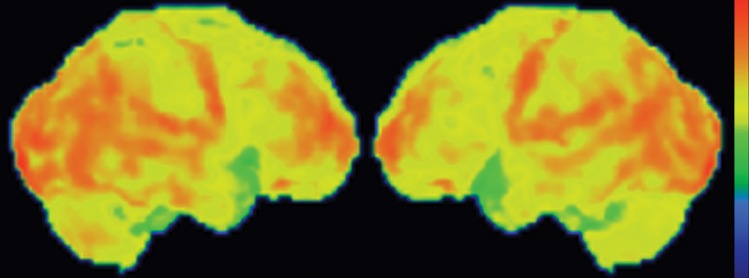
PSP. (a) Axial fast spin-echo T2-weighted MR image demonstrates the Mickey Mouse sign (circle), created by selective midbrain atrophy with relative preservation of the cerebral peduncles and tectum. (b) Midsagittal T1-weighted MR image demonstrates the hummingbird sign (oval), created by selective atrophy of the midbrain tegmentum with relative pontine preservation. (c, d) Axial FDG PET images show hypometabolism in the posterior frontal lobes and basal ganglia, worse on the right side (arrow in c). (e) Amyloid PET image shows normal findings. (f–h) Semiquantitative 3D SSP FDG PET images (f) and Z-score images (g, h) obtained for quantitative analysis show posterior frontal lobe hypometabolism (arrows in g), best seen on the superior view (oval in h). (i) 123I ioflupane SPECT image shows decreased bilateral putaminal dopaminergic activity, more notably on the right side (arrow).
Figure 7h.
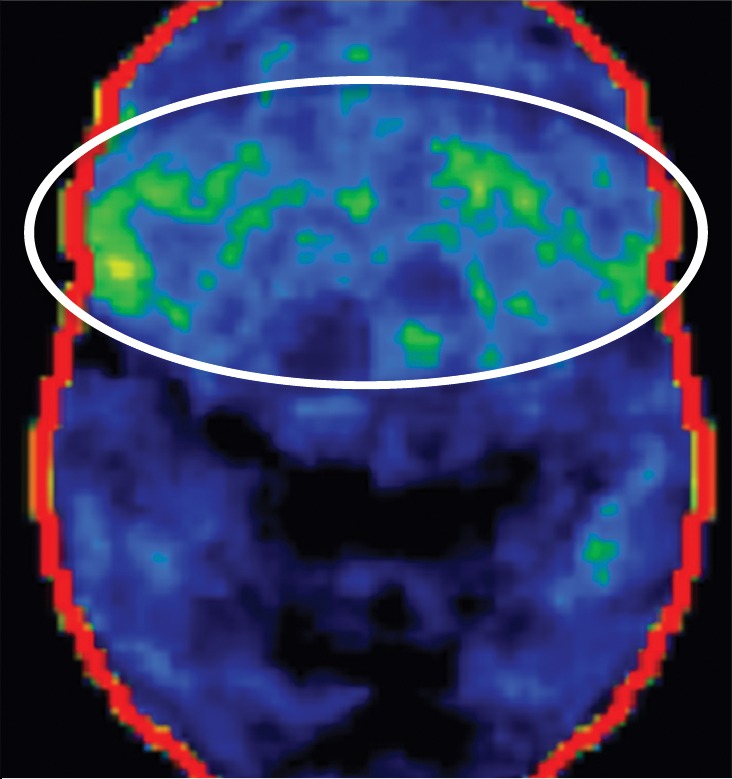
PSP. (a) Axial fast spin-echo T2-weighted MR image demonstrates the Mickey Mouse sign (circle), created by selective midbrain atrophy with relative preservation of the cerebral peduncles and tectum. (b) Midsagittal T1-weighted MR image demonstrates the hummingbird sign (oval), created by selective atrophy of the midbrain tegmentum with relative pontine preservation. (c, d) Axial FDG PET images show hypometabolism in the posterior frontal lobes and basal ganglia, worse on the right side (arrow in c). (e) Amyloid PET image shows normal findings. (f–h) Semiquantitative 3D SSP FDG PET images (f) and Z-score images (g, h) obtained for quantitative analysis show posterior frontal lobe hypometabolism (arrows in g), best seen on the superior view (oval in h). (i) 123I ioflupane SPECT image shows decreased bilateral putaminal dopaminergic activity, more notably on the right side (arrow).
Figure 7e.
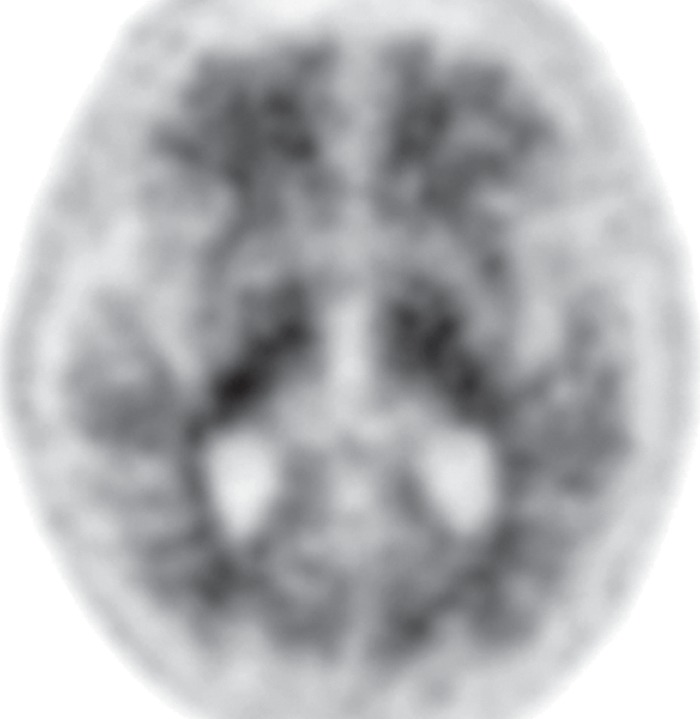
PSP. (a) Axial fast spin-echo T2-weighted MR image demonstrates the Mickey Mouse sign (circle), created by selective midbrain atrophy with relative preservation of the cerebral peduncles and tectum. (b) Midsagittal T1-weighted MR image demonstrates the hummingbird sign (oval), created by selective atrophy of the midbrain tegmentum with relative pontine preservation. (c, d) Axial FDG PET images show hypometabolism in the posterior frontal lobes and basal ganglia, worse on the right side (arrow in c). (e) Amyloid PET image shows normal findings. (f–h) Semiquantitative 3D SSP FDG PET images (f) and Z-score images (g, h) obtained for quantitative analysis show posterior frontal lobe hypometabolism (arrows in g), best seen on the superior view (oval in h). (i) 123I ioflupane SPECT image shows decreased bilateral putaminal dopaminergic activity, more notably on the right side (arrow).
Figure 7i.
PSP. (a) Axial fast spin-echo T2-weighted MR image demonstrates the Mickey Mouse sign (circle), created by selective midbrain atrophy with relative preservation of the cerebral peduncles and tectum. (b) Midsagittal T1-weighted MR image demonstrates the hummingbird sign (oval), created by selective atrophy of the midbrain tegmentum with relative pontine preservation. (c, d) Axial FDG PET images show hypometabolism in the posterior frontal lobes and basal ganglia, worse on the right side (arrow in c). (e) Amyloid PET image shows normal findings. (f–h) Semiquantitative 3D SSP FDG PET images (f) and Z-score images (g, h) obtained for quantitative analysis show posterior frontal lobe hypometabolism (arrows in g), best seen on the superior view (oval in h). (i) 123I ioflupane SPECT image shows decreased bilateral putaminal dopaminergic activity, more notably on the right side (arrow).
Dementia with Lewy Bodies
Clinical Features
In the elderly population, DLB is the second most common cause of neurodegenerative dementia after Alzheimer disease. The central feature of DLB is dementia, with core features including fluctuating cognition, recurrent detailed visual hallucinations, and parkinsonism. Supportive features include behavioral disorders during rapid eye movement (REM) sleep, neuroleptic sensitivity, repeated falls, dysautonomia, delusions, and depression (49). Parkinsonian symptoms are seen in 70%–90% of patients with DLB and can often be as severe as those exhibited in Parkinson disease (50), although they are usually more symmetric than in Parkinson disease. Although patients with Parkinson disease can also develop dementia, patients with DLB develop dementia before or concomitant with the development of parkinsonian signs; in contrast, dementia generally occurs in well-established parkinsonism in Parkinson disease (51,52).
Imaging Findings
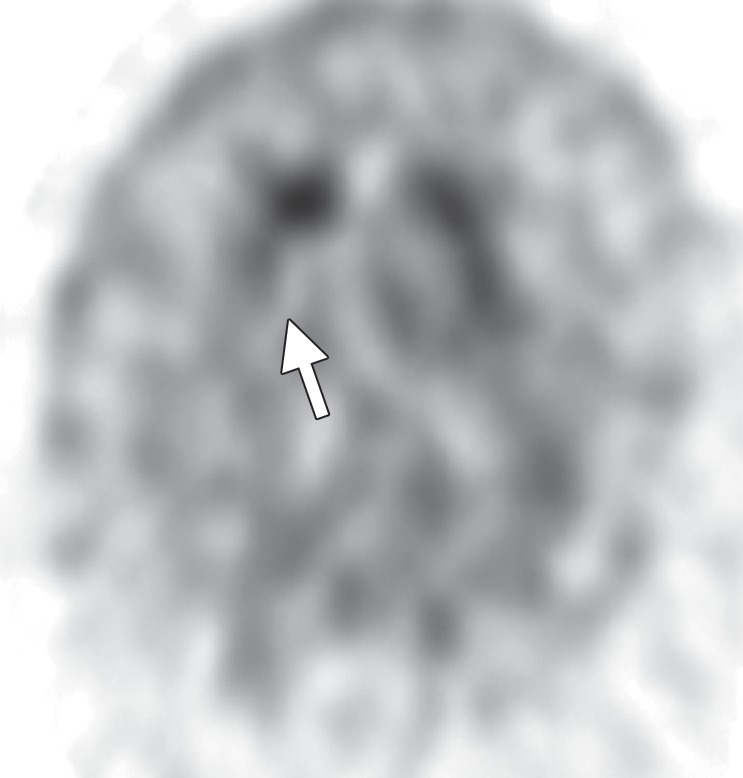
Conventional MR imaging findings in patients with DLB are frequently nonspecific, with varying patterns of atrophy and white matter signal change. Despite clinical visual cortex dysfunction, which manifests as visuospatial dysfunction, selective occipital lobe atrophy is not observed (Fig 8a) (53). FDG PET shows generalized decreased FDG activity, with more profound decreased metabolism in both occipital and parieto-occipital regions (Fig 8b, 8d, 8e) (17,41,54). This pattern appears to have good sensitivity in distinguishing DLB from Alzheimer disease (55), which shows decreased metabolism centered more anteriorly in the temporoparietal lobes, with relative sparing of the visual cortex. Unlike patients with Parkinson disease and other APS, 50%–70% of patients with DLB demonstrate cortical deposition at amyloid PET (Fig 8c) (12,15), a finding that, if present, can be critical in suggesting the diagnosis.
Figure 8a.
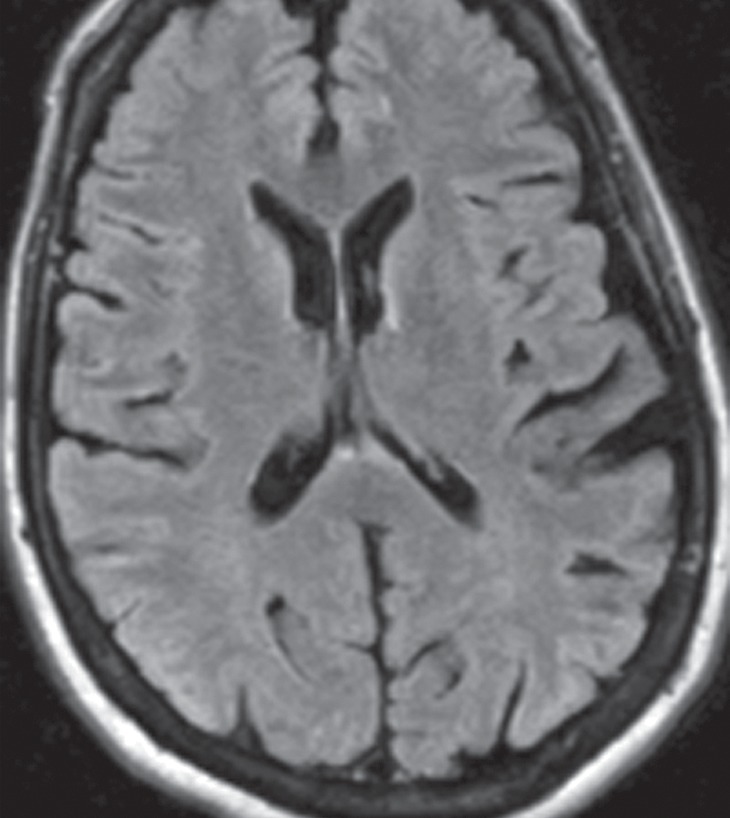
DLB. (a) Axial FLAIR MR image reveals moderate diffuse cerebral volume loss without focal atrophy. (b) Axial FDG PET image shows diffuse cortical hypometabolism, more marked in the occipital lobes (ovals). (c) Amyloid PET image shows diffuse cortical deposition. (d, e) Semiquantitative 3D SSP FDG PET images (d) and Z-score images (e) obtained for quantitative analysis demonstrate prominent occipital hypometabolism (arrows in e). (f ) 123I ioflupane SPECT image reveals bilateral absence of putaminal activity (arrows) and asymmetrically decreased activity in the right caudate nucleus (arrowhead).
Figure 8b.
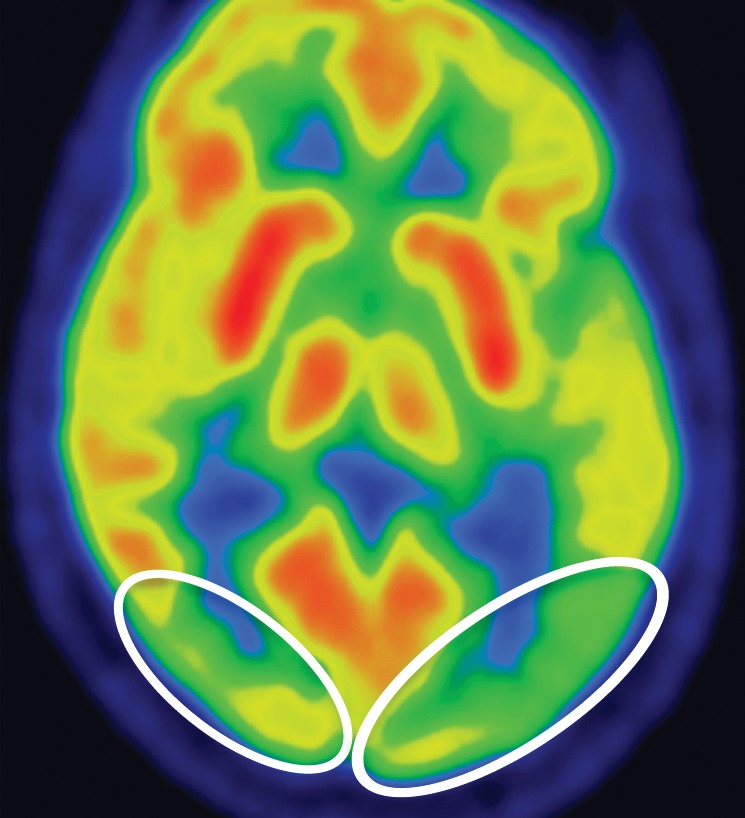
DLB. (a) Axial FLAIR MR image reveals moderate diffuse cerebral volume loss without focal atrophy. (b) Axial FDG PET image shows diffuse cortical hypometabolism, more marked in the occipital lobes (ovals). (c) Amyloid PET image shows diffuse cortical deposition. (d, e) Semiquantitative 3D SSP FDG PET images (d) and Z-score images (e) obtained for quantitative analysis demonstrate prominent occipital hypometabolism (arrows in e). (f ) 123I ioflupane SPECT image reveals bilateral absence of putaminal activity (arrows) and asymmetrically decreased activity in the right caudate nucleus (arrowhead).
Figure 8d.
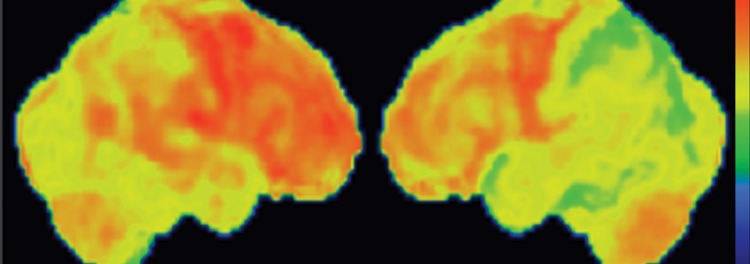
DLB. (a) Axial FLAIR MR image reveals moderate diffuse cerebral volume loss without focal atrophy. (b) Axial FDG PET image shows diffuse cortical hypometabolism, more marked in the occipital lobes (ovals). (c) Amyloid PET image shows diffuse cortical deposition. (d, e) Semiquantitative 3D SSP FDG PET images (d) and Z-score images (e) obtained for quantitative analysis demonstrate prominent occipital hypometabolism (arrows in e). (f ) 123I ioflupane SPECT image reveals bilateral absence of putaminal activity (arrows) and asymmetrically decreased activity in the right caudate nucleus (arrowhead).
Figure 8e.
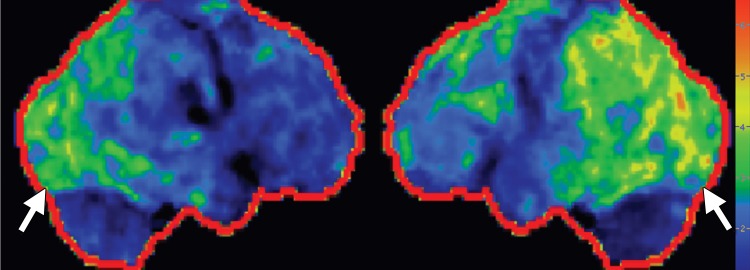
DLB. (a) Axial FLAIR MR image reveals moderate diffuse cerebral volume loss without focal atrophy. (b) Axial FDG PET image shows diffuse cortical hypometabolism, more marked in the occipital lobes (ovals). (c) Amyloid PET image shows diffuse cortical deposition. (d, e) Semiquantitative 3D SSP FDG PET images (d) and Z-score images (e) obtained for quantitative analysis demonstrate prominent occipital hypometabolism (arrows in e). (f ) 123I ioflupane SPECT image reveals bilateral absence of putaminal activity (arrows) and asymmetrically decreased activity in the right caudate nucleus (arrowhead).
Figure 8c.
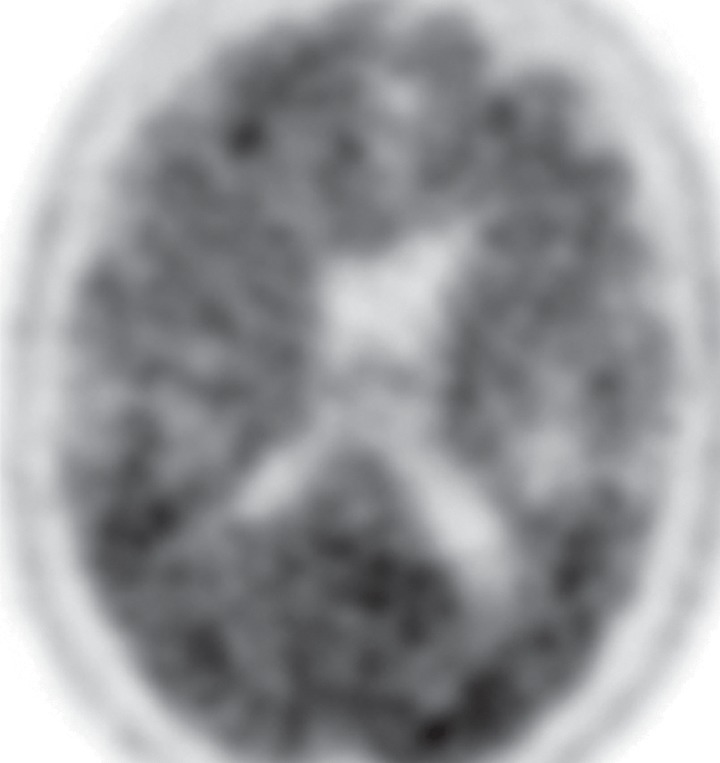
DLB. (a) Axial FLAIR MR image reveals moderate diffuse cerebral volume loss without focal atrophy. (b) Axial FDG PET image shows diffuse cortical hypometabolism, more marked in the occipital lobes (ovals). (c) Amyloid PET image shows diffuse cortical deposition. (d, e) Semiquantitative 3D SSP FDG PET images (d) and Z-score images (e) obtained for quantitative analysis demonstrate prominent occipital hypometabolism (arrows in e). (f ) 123I ioflupane SPECT image reveals bilateral absence of putaminal activity (arrows) and asymmetrically decreased activity in the right caudate nucleus (arrowhead).
123I ioflupane SPECT demonstrates variable patterns of decreased dopaminergic activity in patients with DLB (Fig 8f). These patterns are useful in differentiating DLB from Alzheimer disease, which demonstrates preserved dopaminergic activity (4,56,57). Large multicenter trials have demonstrated excellent sensitivity and specificity for this purpose (58), and abnormal 123I ioflupane SPECT findings have been included as a suggestive feature of DLB (49,58). However, it is not possible to distinguish DLB from other APS with 123I ioflupane SPECT owing to overlapping patterns.
Figure 8f.
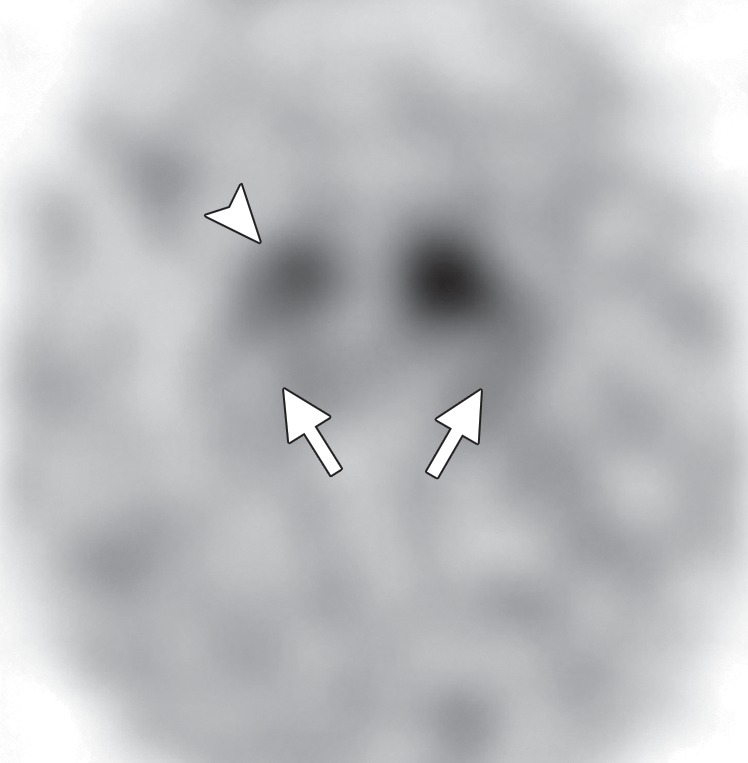
DLB. (a) Axial FLAIR MR image reveals moderate diffuse cerebral volume loss without focal atrophy. (b) Axial FDG PET image shows diffuse cortical hypometabolism, more marked in the occipital lobes (ovals). (c) Amyloid PET image shows diffuse cortical deposition. (d, e) Semiquantitative 3D SSP FDG PET images (d) and Z-score images (e) obtained for quantitative analysis demonstrate prominent occipital hypometabolism (arrows in e). (f ) 123I ioflupane SPECT image reveals bilateral absence of putaminal activity (arrows) and asymmetrically decreased activity in the right caudate nucleus (arrowhead).
Corticobasal Degeneration
Clinical Features
CBD was originally described as an asymmetric, akinetic-rigid neurodegenerative syndrome with cortical dysfunction. However, it is now recognized as often beginning with cognitive or behavioral disturbance, with eventual movement dysfunction (59–61). The movement abnormalities initially affect one limb and may include varying degrees of akinesia, extreme rigidity, focal myoclonus, dystonia, ideomotor apraxia, and alien limb phenomenon. Unlike in patients with Parkinson disease and MSA, there is often marked apraxia. Patients may complain that their clumsy, stiff limb feels as if it belonged to someone else (8). Cognitive features include executive dysfunction, aphasia, apraxia, behavioral change, and visuospatial disturbances (8,62). Lack of response to levodopa is typical in patients with CBD and helps distinguish them clinically from patients with Parkinson disease (8,42).
Imaging Findings
Even in the early stages of disease, conventional MR imaging findings may be abnormal. Asymmetric atrophy centered in the posterior frontal and parietal lobes develops in a significant proportion of patients (Fig 9b). There may be associated atrophy of the ipsilateral cerebral peduncle (27,63,64). FLAIR images may reveal subcortical white matter hyperintensity in the atrophic frontoparietal sulci, presumably reflecting neuronal degeneration (9). Unlike many of the other APS, CBD does not demonstrate volume or signal changes in the basal ganglia in the majority of cases (Fig 9a) (63).
Figure 9b.
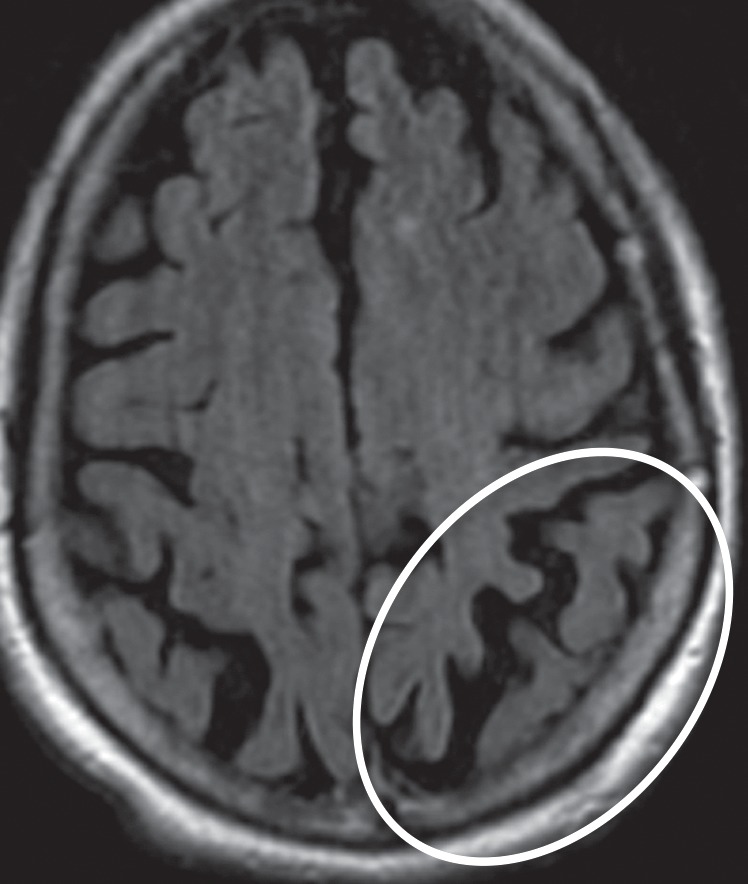
CBD. (a, b) Axial FLAIR MR images show structurally intact basal ganglia and focal left parietal lobe atrophy (oval in b). (c) Amyloid PET image shows normal findings. (d, e) Axial FDG PET images show preserved basal ganglia activity and left parietal hypometabolism (oval in e). (f) 123I ioflupane SPECT image shows decreased activity in the left putamen (arrow). (g–i) Semiquantitative 3D SSP FDG PET images (g) and Z-score images (h, i) demonstrate isolated left parietal hypometabolism, most evident on the superior view (oval in i).
Figure 9a.
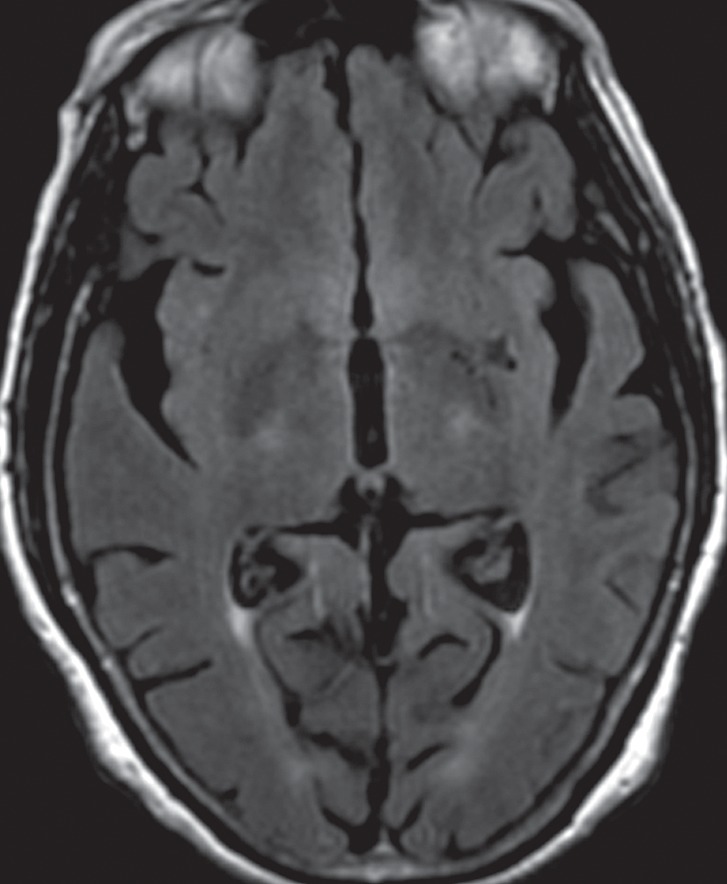
CBD. (a, b) Axial FLAIR MR images show structurally intact basal ganglia and focal left parietal lobe atrophy (oval in b). (c) Amyloid PET image shows normal findings. (d, e) Axial FDG PET images show preserved basal ganglia activity and left parietal hypometabolism (oval in e). (f) 123I ioflupane SPECT image shows decreased activity in the left putamen (arrow). (g–i) Semiquantitative 3D SSP FDG PET images (g) and Z-score images (h, i) demonstrate isolated left parietal hypometabolism, most evident on the superior view (oval in i).
Figure 9h.
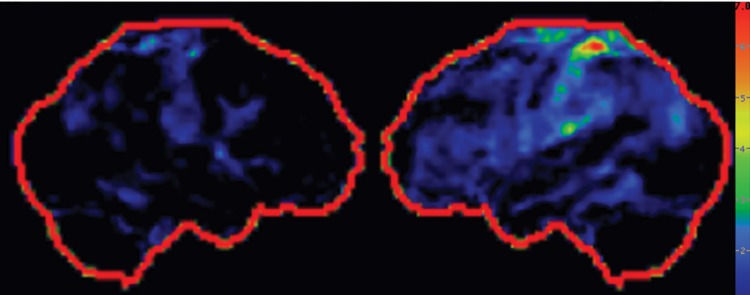
CBD. (a, b) Axial FLAIR MR images show structurally intact basal ganglia and focal left parietal lobe atrophy (oval in b). (c) Amyloid PET image shows normal findings. (d, e) Axial FDG PET images show preserved basal ganglia activity and left parietal hypometabolism (oval in e). (f) 123I ioflupane SPECT image shows decreased activity in the left putamen (arrow). (g–i) Semiquantitative 3D SSP FDG PET images (g) and Z-score images (h, i) demonstrate isolated left parietal hypometabolism, most evident on the superior view (oval in i).
The classic finding at FDG PET is asymmetric basal ganglia and cortical glucose hypometabolism contralateral to the affected side (Fig 9d, 9e, 9g–9i) (29,30,41,65). Interestingly, several studies have shown that patients with CBD can have increased FDG activity in the basal ganglia and cortex ipsilateral to the clinically affected side (29,65). Amyloid PET shows no corresponding deposition (Fig 9c). 123I ioflupane SPECT demonstrates variable decreased putaminal activity that, like the atrophy at MR imaging and the hypometabolism at FDG PET, is often asymmetric and contralateral to the affected side (Fig 9f) (66,67).
Figure 9d.
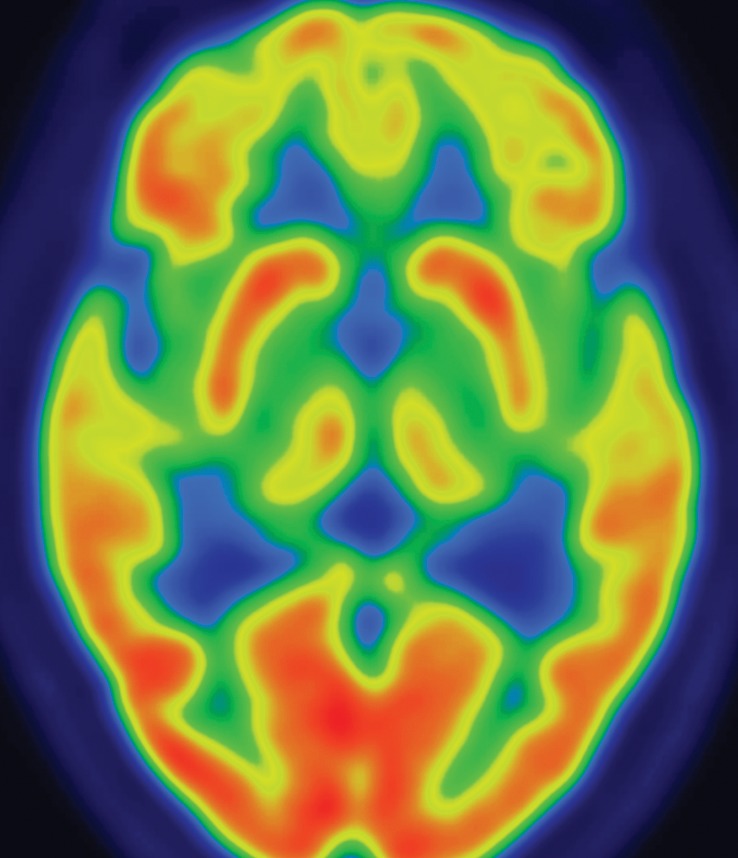
CBD. (a, b) Axial FLAIR MR images show structurally intact basal ganglia and focal left parietal lobe atrophy (oval in b). (c) Amyloid PET image shows normal findings. (d, e) Axial FDG PET images show preserved basal ganglia activity and left parietal hypometabolism (oval in e). (f) 123I ioflupane SPECT image shows decreased activity in the left putamen (arrow). (g–i) Semiquantitative 3D SSP FDG PET images (g) and Z-score images (h, i) demonstrate isolated left parietal hypometabolism, most evident on the superior view (oval in i).
Figure 9e.
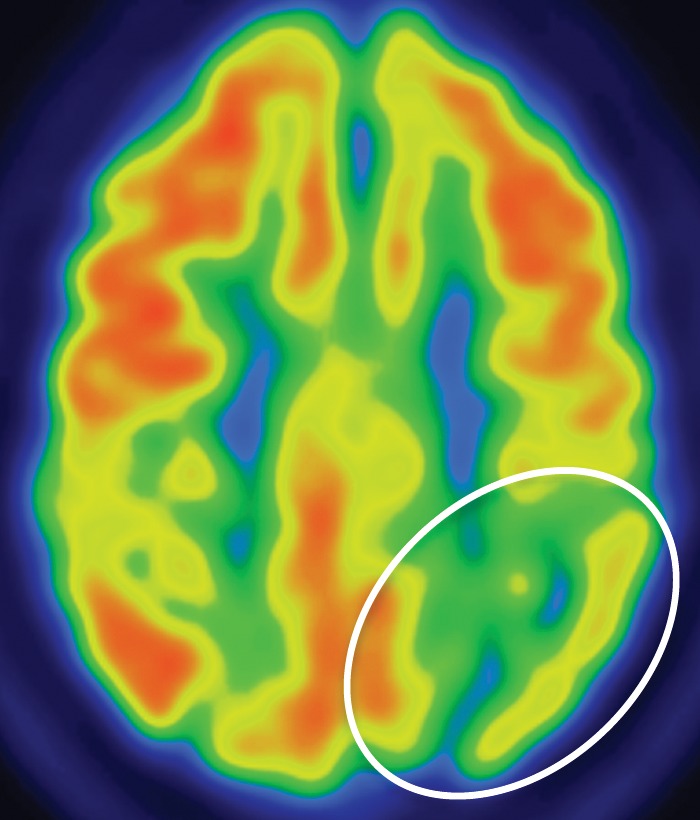
CBD. (a, b) Axial FLAIR MR images show structurally intact basal ganglia and focal left parietal lobe atrophy (oval in b). (c) Amyloid PET image shows normal findings. (d, e) Axial FDG PET images show preserved basal ganglia activity and left parietal hypometabolism (oval in e). (f) 123I ioflupane SPECT image shows decreased activity in the left putamen (arrow). (g–i) Semiquantitative 3D SSP FDG PET images (g) and Z-score images (h, i) demonstrate isolated left parietal hypometabolism, most evident on the superior view (oval in i).
Figure 9g.
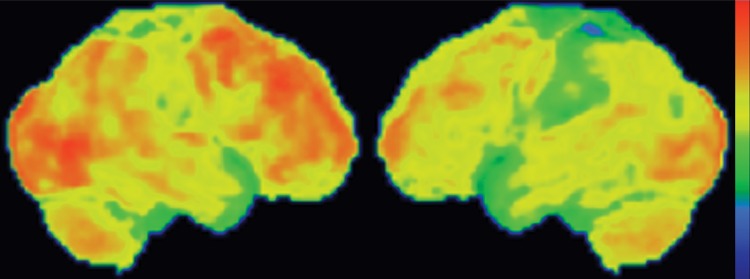
CBD. (a, b) Axial FLAIR MR images show structurally intact basal ganglia and focal left parietal lobe atrophy (oval in b). (c) Amyloid PET image shows normal findings. (d, e) Axial FDG PET images show preserved basal ganglia activity and left parietal hypometabolism (oval in e). (f) 123I ioflupane SPECT image shows decreased activity in the left putamen (arrow). (g–i) Semiquantitative 3D SSP FDG PET images (g) and Z-score images (h, i) demonstrate isolated left parietal hypometabolism, most evident on the superior view (oval in i).
Figure 9i.
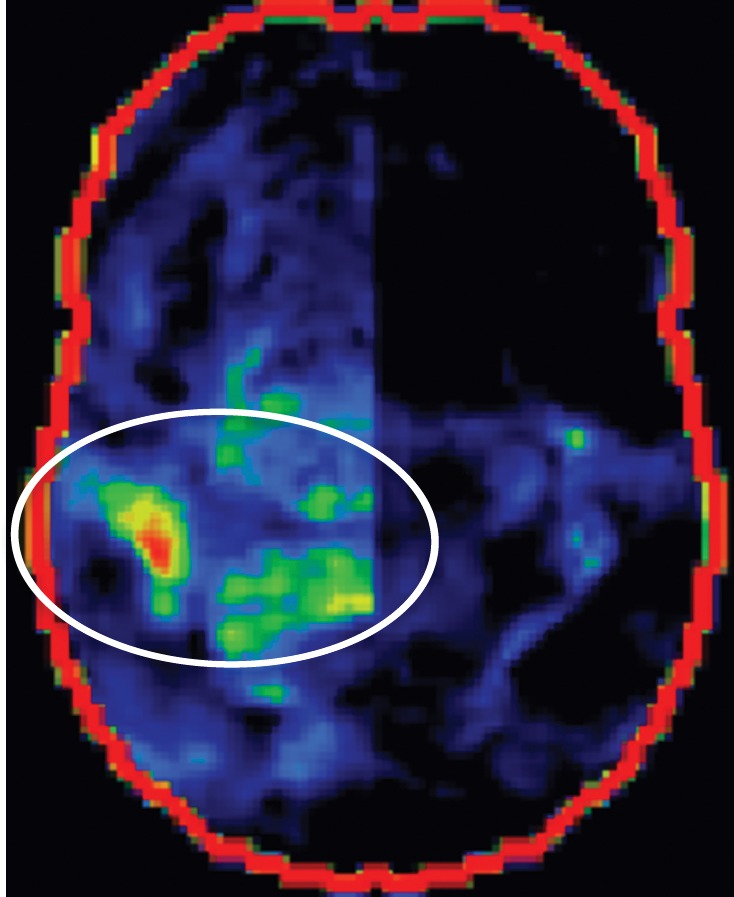
CBD. (a, b) Axial FLAIR MR images show structurally intact basal ganglia and focal left parietal lobe atrophy (oval in b). (c) Amyloid PET image shows normal findings. (d, e) Axial FDG PET images show preserved basal ganglia activity and left parietal hypometabolism (oval in e). (f) 123I ioflupane SPECT image shows decreased activity in the left putamen (arrow). (g–i) Semiquantitative 3D SSP FDG PET images (g) and Z-score images (h, i) demonstrate isolated left parietal hypometabolism, most evident on the superior view (oval in i).
Figure 9c.
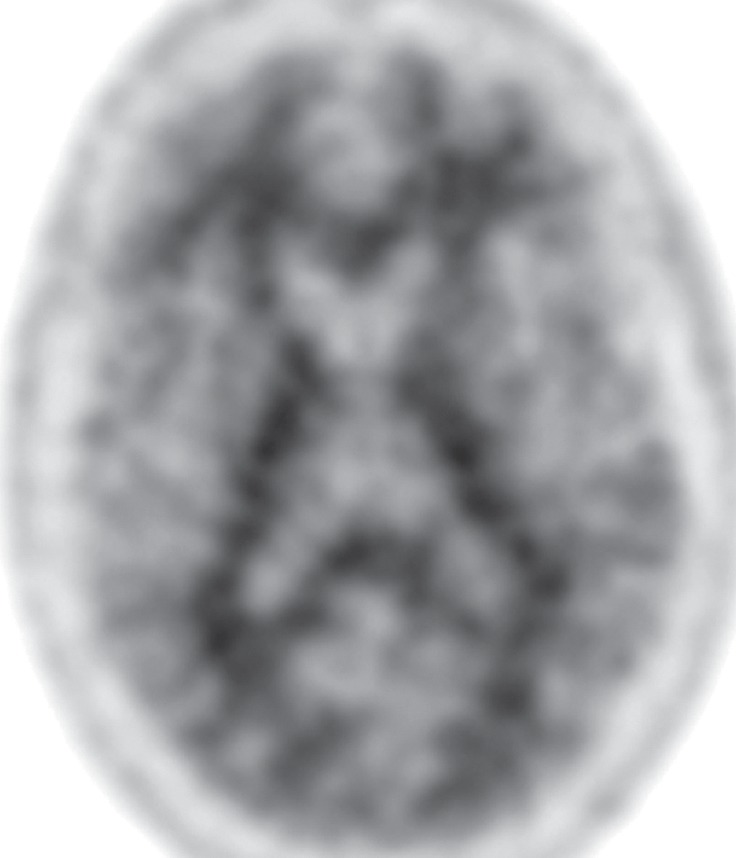
CBD. (a, b) Axial FLAIR MR images show structurally intact basal ganglia and focal left parietal lobe atrophy (oval in b). (c) Amyloid PET image shows normal findings. (d, e) Axial FDG PET images show preserved basal ganglia activity and left parietal hypometabolism (oval in e). (f) 123I ioflupane SPECT image shows decreased activity in the left putamen (arrow). (g–i) Semiquantitative 3D SSP FDG PET images (g) and Z-score images (h, i) demonstrate isolated left parietal hypometabolism, most evident on the superior view (oval in i).
Figure 9f.
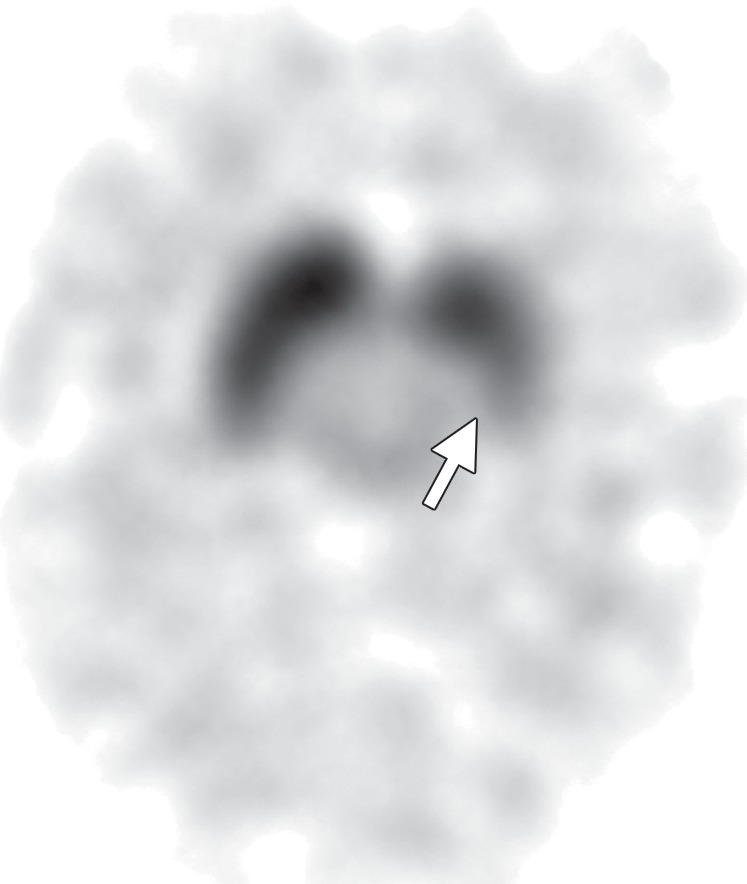
CBD. (a, b) Axial FLAIR MR images show structurally intact basal ganglia and focal left parietal lobe atrophy (oval in b). (c) Amyloid PET image shows normal findings. (d, e) Axial FDG PET images show preserved basal ganglia activity and left parietal hypometabolism (oval in e). (f) 123I ioflupane SPECT image shows decreased activity in the left putamen (arrow). (g–i) Semiquantitative 3D SSP FDG PET images (g) and Z-score images (h, i) demonstrate isolated left parietal hypometabolism, most evident on the superior view (oval in i).
Future Directions
A variety of new functional and quantitative MR imaging techniques have shown promise in the diagnosis and management of both Parkinson disease and APS but are not yet part of standard clinical practice. Voxel-based morphometry is useful in quantifying specific areas of volume loss in parkinsonian conditions. On the basis of coregistration of high-resolution 3D datasets normalized to study-specific templates, this technique allows automated analysis of morphologic brain changes without a priori bias. Diffusion-weighted and diffusion-tensor MR imaging allow objective evaluation of the gray matter–white matter microstructure. Neuronal loss and gliosis in neurodegenerative conditions disrupt the organized central nervous system architecture, resulting in measurable changes in diffusivity—namely, an increased apparent diffusion coefficient and decreased fractional anisotropy. Finally, magnetization transfer MR imaging can be used to examine the interactions between protons bound to macroproteins (as in cell membranes and myelin) and those in free water. By comparing sequences with and without selective saturation of bound protons, a magnetization transfer ratio can be determined, which can be used as a measure of microstructural integrity (9,28).
Other molecular imaging techniques may prove useful in the understanding, differentiation, and diagnosis of Parkinson disease and APS. Given the overlapping patterns of presynaptic dopamine transporter reduction in Parkinson disease and APS, the use of PET and SPECT with D2-receptor antagonists has been studied to evaluate postsynaptic D2 receptor availability in parkinsonian syndromes. Striatal dopamine receptors are localized on medium spiny GABAergic neurons. These remain intact in Parkinson disease until very late in the disease process but undergo degeneration in some APS such as MSA and PSP. Therefore, unlike with 123I ioflupane SPECT, MSA and PSP can be differentiated from Parkinson disease on the basis of decreased activity at postsynaptic D2-receptor imaging (3,4,9,68).
Although currently limited to the research setting, these tools offer a glimpse into the future, where an even greater array of techniques should advance the diagnostic algorithm and positively affect the management of patients with parkinsonian disorders.
Conclusion
Movement disorders with parkinsonian features are common, and imaging is playing an increasingly important role in diagnosis and management. It is important that radiologists be familiar with the classic MR imaging appearances of some APS, gain confidence in interpreting molecular imaging studies, and recognize the most common patterns of Parkinson disease and APS at FDG PET, amyloid PET, and 123I ioflupane SPECT. This knowledge will allow a more accurate diagnosis than with clinical evaluation alone and can aid in selecting the appropriate therapy for patients with parkinsonism.
Recipient of Excellence in Design and Certificate of Merit awards for an education exhibit at the 2012 RSNA Annual Meeting.
For this journal-based SA-CME activity, the author V.J.L. has provided disclosures (see “Disclosures of Conflicts of Interest”); all other authors, the editor, and the reviewers have disclosed no relevant relationships.
Funding: The work was supported by the National Institutes of Health [grant numbers P50-AG16574, U01-AG06786, R01-AG11378, RO1-AG041851, and UL1-RR024150]; the Elsie and Marvin Dekelboum Family Foundation; GE Healthcare; and the Robert H. and Clarice Smith and Abigail Van Buren Alzheimer’s Disease Research Program of the Mayo Foundation.
Disclosures of Conflicts of Interest.—V.J.L.: Activities related to the present article: disclosed no relevant relationships. Activities not related to the present article: grants from GE Healthcare, Siemens Molecular Imaging, and AVID Radiopharmaceuticals; consultant for Bayer Pharmaceuticals. Other relationships: disclosed no relevant relationships.
Abbreviations:
- APS
- atypical parkinsonian syndromes
- CBD
- corticobasal degeneration
- DLB
- dementia with Lewy bodies
- FDA
- U.S. Food and Drug Administration
- FDG
- 2-[fluorine-18]fluoro-2-deoxy-d-glucose
- FLAIR
- fluid-attenuated inversion recovery
- MSA
- multiple system atrophy
- MSA-C
- cerebellar ataxia type MSA
- MSA-P
- parkinsonian type MSA
- PiB
- Pittsburgh compound B
- PSP
- progressive supranuclear palsy
- SSP
- stereotactic surface projection
- 3D
- three-dimensional
References
- 1.de Rijk MC, Tzourio C, Breteler MM, et al. Prevalence of parkinsonism and Parkinson’s disease in Europe: the EUROPARKINSON Collaborative Study. European Community Concerted Action on the Epidemiology of Parkinson’s disease. J Neurol Neurosurg Psychiatry 1997;62(1):10–15. [DOI] [PMC free article] [PubMed] [Google Scholar]
- 2.Lang AE, Lozano AM. Parkinson’s disease: first of two parts. N Engl J Med 1998;339(15):1044–1053. [DOI] [PubMed] [Google Scholar]
- 3.Brooks DJ. Imaging approaches to Parkinson disease. J Nucl Med 2010;51(4):596–609. [DOI] [PubMed] [Google Scholar]
- 4.Tatsch K. Extrapyramidal syndromes: PET and SPECT. Neuroimaging Clin N Am 2010;20(1): 57–68. [DOI] [PubMed] [Google Scholar]
- 5.Marek K, Innis R, van Dyck C, et al. [123I]beta-CIT SPECT imaging assessment of the rate of Parkinson’s disease progression. Neurology 2001;57(11):2089–2094. [DOI] [PubMed] [Google Scholar]
- 6.Suchowersky O, Reich S, Perlmutter J, et al. Practice parameter: diagnosis and prognosis of new onset Parkinson disease (an evidence-based review)—report of the Quality Standards Subcommittee of the American Academy of Neurology. Neurology 2006; 66(7):968–975. [DOI] [PubMed] [Google Scholar]
- 7.Hughes AJ, Daniel SE, Kilford L, Lees AJ. Accuracy of clinical diagnosis of idiopathic Parkinson’s disease: a clinico-pathological study of 100 cases. J Neurol Neurosurg Psychiatry 1992;55(3):181–184. [DOI] [PMC free article] [PubMed] [Google Scholar]
- 8.Brooks DJ. Diagnosis and management of atypical parkinsonian syndromes. J Neurol Neurosurg Psychiatry 2002;72(suppl 1):I10–I16. [DOI] [PMC free article] [PubMed] [Google Scholar]
- 9.Mascalchi M, Vella A, Ceravolo R. Movement disorders: role of imaging in diagnosis. J Magn Reson Imaging 2012;35(2):239–256. [DOI] [PubMed] [Google Scholar]
- 10.Minoshima S, Frey KA, Koeppe RA, Foster NL, Kuhl DE. A diagnostic approach in Alzheimer’s disease using three-dimensional stereotactic surface projections of fluorine-18-FDG PET. J Nucl Med 1995;36(7):1238–1248. [PubMed] [Google Scholar]
- 11.Clapp AJ, Hunt CH, Johnson GB, Peller PJ. Semiquantitative analysis of brain metabolism in patients with paraneoplastic neurologic syndromes. Clin Nucl Med 2013;38(4):241–247. [DOI] [PubMed] [Google Scholar]
- 12.Rowe CC, Villemagne VL. Brain amyloid imaging. J Nucl Med 2011;52(11):1733–1740. [DOI] [PubMed] [Google Scholar]
- 13.Klunk WE, Engler H, Nordberg A, et al. Imaging brain amyloid in Alzheimer’s disease with Pittsburgh Compound-B. Ann Neurol 2004;55(3):306–319. [DOI] [PubMed] [Google Scholar]
- 14.Clark CM, Schneider JA, Bedell BJ, et al. Use of florbetapir-PET for imaging beta-amyloid pathology. JAMA 2011;305(3):275–283. [DOI] [PMC free article] [PubMed] [Google Scholar]
- 15.Rowe CC, Ng S, Ackermann U, et al. Imaging beta-amyloid burden in aging and dementia. Neurology 2007;68(20):1718–1725. [DOI] [PubMed] [Google Scholar]
- 16.Lowe VJ, Kemp BJ, Jack CR, Jr, et al. Comparison of 18F-FDG and PiB PET in cognitive impairment. J Nucl Med 2009;50(6):878–886. [DOI] [PMC free article] [PubMed] [Google Scholar]
- 17.Ng S, Villemagne VL, Berlangieri S, et al. Visual assessment versus quantitative assessment of 11C-PIB PET and 18F-FDG PET for detection of Alzheimer’s disease. J Nucl Med 2007;48(4):547–552. [DOI] [PubMed] [Google Scholar]
- 18.Djang DS, Janssen MJ, Bohnen N, et al. SNM practice guideline for dopamine transporter imaging with 123I-ioflupane SPECT 1.0. J Nucl Med 2012; 53(1):154–163. [DOI] [PubMed] [Google Scholar]
- 19.Benamer TS, Patterson J, Grosset DG, et al. Accurate differentiation of parkinsonism and essential tremor using visual assessment of [123I]-FP-CIT SPECT imaging: the [123I]-FP-CIT Study Group. Mov Disord 2000;15(3):503–510. [PubMed] [Google Scholar]
- 20.Vlaar AM, de Nijs T, Kessels AG, et al. Diagnostic value of 123I-ioflupane and 123I-iodobenzamide SPECT scans in 248 patients with parkinsonian syndromes. Eur Neurol 2008;59(5):258–266. [DOI] [PubMed] [Google Scholar]
- 21.Booij J, Habraken JB, Bergmans P, et al. Imaging of dopamine transporters with iodine-123-FP-CIT SPECT in healthy controls and patients with Parkinson’s disease. J Nucl Med 1998;39(11):1879–1884. [PubMed] [Google Scholar]
- 22.Tissingh G, Booij J, Bergmans P, et al. Iodine-123-N-omega-fluoropropyl-2beta-carbomethoxy-3beta-(4-iodophenyl)tropane SPECT in healthy controls and early-stage, drug-naive Parkinson’s disease. J Nucl Med 1998;39(7):1143–1148. [PubMed] [Google Scholar]
- 23.Gelb DJ, Oliver E, Gilman S. Diagnostic criteria for Parkinson disease. Arch Neurol 1999;56(1):33–39. [DOI] [PubMed] [Google Scholar]
- 24.Ahlskog JE. Diagnosis and differential diagnosis of Parkinson’s disease and parkinsonism. Parkinsonism Relat Disord 2000;7(1):63–70. [DOI] [PubMed] [Google Scholar]
- 25.Tolosa E, Wenning G, Poewe W. The diagnosis of Parkinson’s disease. Lancet Neurol 2006;5(1): 75–86. [DOI] [PubMed] [Google Scholar]
- 26.Brooks DJ. Morphological and functional imaging studies on the diagnosis and progression of Parkinson’s disease. J Neurol 2000;247(suppl 2): II11–II18. [DOI] [PubMed] [Google Scholar]
- 27.Savoiardo M. Differential diagnosis of Parkinson’s disease and atypical parkinsonian disorders by magnetic resonance imaging. Neurol Sci 2003;24(suppl 1):S35–S37. [DOI] [PubMed] [Google Scholar]
- 28.Seppi K, Poewe W. Brain magnetic resonance imaging techniques in the diagnosis of parkinsonian syndromes. Neuroimaging Clin N Am 2010;20(1): 29–55. [DOI] [PubMed] [Google Scholar]
- 29.Eckert T, Barnes A, Dhawan V, et al. FDG PET in the differential diagnosis of parkinsonian disorders. Neuroimage 2005;26(3):912–921. [DOI] [PubMed] [Google Scholar]
- 30.Tripathi M, Dhawan V, Peng S, et al. Differential diagnosis of parkinsonian syndromes using F-18 fluorodeoxyglucose positron emission tomography. Neuroradiology 2013;55(4):483–492. [DOI] [PubMed] [Google Scholar]
- 31.Brooks DJ. Assessment of Parkinson’s disease with imaging. Parkinsonism Relat Disord 2007;13(suppl 3):S268–S275. [DOI] [PubMed] [Google Scholar]
- 32.Stefanova N, Bücke P, Duerr S, Wenning GK. Multiple system atrophy: an update. Lancet Neurol 2009;8(12):1172–1178. [DOI] [PubMed] [Google Scholar]
- 33.Watanabe H, Saito Y, Terao S, et al. Progression and prognosis in multiple system atrophy: an analysis of 230 Japanese patients. Brain 2002;125(pt 5): 1070–1083. [DOI] [PubMed] [Google Scholar]
- 34.Wenning GK, Colosimo C, Geser F, Poewe W. Multiple system atrophy. Lancet Neurol 2004;3(2): 93–103. [DOI] [PubMed] [Google Scholar]
- 35.Bak TH, Crawford LM, Hearn VC, Mathuranath PS, Hodges JR. Subcortical dementia revisited: similarities and differences in cognitive function between progressive supranuclear palsy (PSP), corticobasal degeneration (CBD) and multiple system atrophy (MSA). Neurocase 2005;11(4):268–273. [DOI] [PubMed] [Google Scholar]
- 36.Gilman S, Wenning GK, Low PA, et al. Second consensus statement on the diagnosis of multiple system atrophy. Neurology 2008;71(9):670–676. [DOI] [PMC free article] [PubMed] [Google Scholar]
- 37.Kraft E, Schwarz J, Trenkwalder C, Vogl T, Pfluger T, Oertel WH. The combination of hypointense and hyperintense signal changes on T2-weighted magnetic resonance imaging sequences: a specific marker of multiple system atrophy? Arch Neurol 1999;56(2):225–228. [DOI] [PubMed] [Google Scholar]
- 38.Brooks DJ, Seppi K; Neuroimaging Working Group on MSA. Proposed neuroimaging criteria for the diagnosis of multiple system atrophy. Mov Disord 2009;24(7):949–964. [DOI] [PubMed] [Google Scholar]
- 39.Lee WH, Lee CC, Shyu WC, Chong PN, Lin SZ. Hyperintense putaminal rim sign is not a hallmark of multiple system atrophy at 3T. AJNR Am J Neuroradiol 2005;26(9):2238–2242. [PMC free article] [PubMed] [Google Scholar]
- 40.Savoiardo M, Strada L, Girotti F, et al. Olivopontocerebellar atrophy: MR diagnosis and relationship to multisystem atrophy. Radiology 1990;174(3 pt 1): 693–696. [DOI] [PubMed] [Google Scholar]
- 41.Zhao P, Zhang B, Gao S. 18F-FDG PET study on the idiopathic Parkinson’s disease from several parkinsonian-plus syndromes. Parkinsonism Relat Disord 2012;18(suppl 1):S60–S62. [DOI] [PubMed] [Google Scholar]
- 42.Aerts MB, Esselink RA, Post B, van de Warrenburg BP, Bloem BR. Improving the diagnostic accuracy in parkinsonism: a three-pronged approach. Pract Neurol 2012;12(2):77–87. [DOI] [PubMed] [Google Scholar]
- 43.Litvan I, Agid Y, Calne D, et al. Clinical research criteria for the diagnosis of progressive supranuclear palsy (Steele-Richardson-Olszewski syndrome): report of the NINDS-SPSP International Workshop. Neurology 1996;47(1):1–9. [DOI] [PubMed] [Google Scholar]
- 44.Righini A, Antonini A, De Notaris R, et al. MR imaging of the superior profile of the midbrain: differential diagnosis between progressive supranuclear palsy and Parkinson disease. AJNR Am J Neuroradiol 2004;25(6):927–932. [PMC free article] [PubMed] [Google Scholar]
- 45.Kato N, Arai K, Hattori T. Study of the rostral midbrain atrophy in progressive supranuclear palsy. J Neurol Sci 2003;210(1-2):57–60. [DOI] [PubMed] [Google Scholar]
- 46.Oba H, Yagishita A, Terada H, et al. New and reliable MRI diagnosis for progressive supranuclear palsy. Neurology 2005;64(12):2050–2055. [DOI] [PubMed] [Google Scholar]
- 47.Kataoka H, Tonomura Y, Taoka T, Ueno S. Signal changes of superior cerebellar peduncle on fluid-attenuated inversion recovery in progressive supranuclear palsy. Parkinsonism Relat Disord 2008;14(1): 63–65. [DOI] [PubMed] [Google Scholar]
- 48.Paviour DC, Price SL, Stevens JM, Lees AJ, Fox NC. Quantitative MRI measurement of superior cerebellar peduncle in progressive supranuclear palsy. Neurology 2005;64(4):675–679. [DOI] [PubMed] [Google Scholar]
- 49.McKeith IG, Dickson DW, Lowe J, et al. Diagnosis and management of dementia with Lewy bodies: third report of the DLB Consortium. Neurology 2005;65(12):1863–1872. [DOI] [PubMed] [Google Scholar]
- 50.Aarsland D, Ballard C, McKeith I, Perry RH, Larsen JP. Comparison of extrapyramidal signs in dementia with Lewy bodies and Parkinson’s disease. J Neuropsychiatry Clin Neurosci 2001;13(3): 374–379. [DOI] [PubMed] [Google Scholar]
- 51.Lippa CF, Duda JE, Grossman M, et al. DLB and PDD boundary issues: diagnosis, treatment, molecular pathology, and biomarkers. Neurology 2007;68(11):812–819. [DOI] [PubMed] [Google Scholar]
- 52.McKeith I, Mintzer J, Aarsland D, et al. Dementia with Lewy bodies. Lancet Neurol 2004;3(1):19–28. [DOI] [PubMed] [Google Scholar]
- 53.Burton EJ, McKeith IG, Burn DJ, Williams ED, O’Brien JT. Cerebral atrophy in Parkinson’s disease with and without dementia: a comparison with Alzheimer’s disease, dementia with Lewy bodies and controls. Brain 2004;127(pt 4):791–800. [DOI] [PubMed] [Google Scholar]
- 54.Mirzaei S, Rodrigues M, Koehn H, Knoll P, Bruecke T. Metabolic impairment of brain metabolism in patients with Lewy body dementia. Eur J Neurol 2003;10(5):573–575. [DOI] [PubMed] [Google Scholar]
- 55.Minoshima S, Foster NL, Sima AA, Frey KA, Albin RL, Kuhl DE. Alzheimer’s disease versus dementia with Lewy bodies: cerebral metabolic distinction with autopsy confirmation. Ann Neurol 2001;50(3): 358–365. [DOI] [PubMed] [Google Scholar]
- 56.Koeppe RA, Gilman S, Junck L, Wernette K, Frey KA. Differentiating Alzheimer’s disease from dementia with Lewy bodies and Parkinson’s disease with (+)-[11C]dihydrotetrabenazine positron emission tomography. Alzheimers Dement 2008;4(1 suppl 1):S67–S76. [DOI] [PubMed] [Google Scholar]
- 57.O’Brien JT, Colloby S, Fenwick J, et al. Dopamine transporter loss visualized with FP-CIT SPECT in the differential diagnosis of dementia with Lewy bodies. Arch Neurol 2004;61(6):919–925. [DOI] [PubMed] [Google Scholar]
- 58.McKeith I, O’Brien J, Walker Z, et al. Sensitivity and specificity of dopamine transporter imaging with 123I-FP-CIT SPECT in dementia with Lewy bodies: a phase III, multicentre study. Lancet Neurol 2007;6(4):305–313. [DOI] [PubMed] [Google Scholar]
- 59.Graham NL, Bak TH, Hodges JR. Corticobasal degeneration as a cognitive disorder. Mov Disord 2003;18(11):1224–1232. [DOI] [PubMed] [Google Scholar]
- 60.Lee SE, Rabinovici GD, Mayo MC, et al. Clinicopathological correlations in corticobasal degeneration. Ann Neurol 2011;70(2):327–340. [DOI] [PMC free article] [PubMed] [Google Scholar]
- 61.Murray R, Neumann M, Forman MS, et al. Cognitive and motor assessment in autopsy-proven corticobasal degeneration. Neurology 2007;68(16): 1274–1283. [DOI] [PubMed] [Google Scholar]
- 62.Wenning GK, Litvan I, Jankovic J, et al. Natural history and survival of 14 patients with corticobasal degeneration confirmed at postmortem examination. J Neurol Neurosurg Psychiatry 1998;64(2):184–189. [DOI] [PMC free article] [PubMed] [Google Scholar]
- 63.Koyama M, Yagishita A, Nakata Y, Hayashi M, Bandoh M, Mizutani T. Imaging of corticobasal degeneration syndrome. Neuroradiology 2007;49(11): 905–912. [DOI] [PubMed] [Google Scholar]
- 64.Schrag A, Good CD, Miszkiel K, et al. Differentiation of atypical parkinsonian syndromes with routine MRI. Neurology 2000;54(3):697–702. [DOI] [PubMed] [Google Scholar]
- 65.Teune LK, Bartels AL, de Jong BM, et al. Typical cerebral metabolic patterns in neurodegenerative brain diseases. Mov Disord 2010;25(14):2395–2404. [DOI] [PubMed] [Google Scholar]
- 66.Klaffke S, Kuhn AA, Plotkin M, et al. Dopamine transporters, D2 receptors, and glucose metabolism in corticobasal degeneration. Mov Disord 2006;21(10):1724–1727. [DOI] [PubMed] [Google Scholar]
- 67.Pirker W, Asenbaum S, Bencsits G, et al. [123I]beta-CIT SPECT in multiple system atrophy, progressive supranuclear palsy, and corticobasal degeneration. Mov Disord 2000;15(6):1158–1167. [DOI] [PubMed] [Google Scholar]
- 68.Brücke T, Djamshidian S, Bencsits G, Pirker W, Asenbaum S, Podreka I. SPECT and PET imaging of the dopaminergic system in Parkinson’s disease. J Neurol 2000;247(suppl 4):IV, 2–7. [DOI] [PubMed] [Google Scholar]


