

Abstract
Transcriptional regulation of the glial fibrillary acidic protein gene (GFAP) is of interest because of its astrocyte specificity and its upregulation in response to CNS injuries. We have used a transgenic approach instead of cell transfection to identify promoter elements of the human GFAP gene, since previous observations show that GFAP transcription is regulated differently in transfected cultured cells from in the mouse. We previously showed that block mutation of enhancer regions spanning from bp −1488 to −1434 (the C1.1 segment) and −1443 to −1399 (C1.2) resulted in altered patterns of expression and loss of astrocyte specificity, respectively. This analysis has now been extended upstream to bp −1612 to −1489 (the B region), which previously has been shown especially important for expression. Block mutation of each of four contiguous sequences, which together span the B region, each decreased the level of transgene activity by at least 50%, indicating that multiple sites contribute to the transcriptional activity in a cooperative manner. Several of the block mutations also altered the brain region pattern of expression, astrocyte specificity and/or the developmental time course. Transgenes were then analyzed in which mutations were limited to specific transcription factor binding sites in each of the 4 B block segments as well as in C1.1 and C1.2. Whereas mutation of the conserved consensus AP-1 site unexpectedly had little effect on transgene expression; NFI, SP1, STAT3, and NF-κB were identified as having important roles in regulating the strength of GFAP promoter activity and/or its astrocyte specificity.
Keywords: transgenic mice, transcription, GFAP, AP-1, NFI, SP1, STAT3, GATA, NF-κB
Introduction
Transcriptional regulation of the glial fibrillary acidic protein (GFAP) gene has attracted interest due to its astrocyte specificity and its upregulation in response to various CNS injuries. We have previously shown that the gfa2 promoter, a DNA fragment extending 2.2 kb upstream of the RNA start site (bp +1), drives expression of a LacZ reporter in mice in a manner similar to that of the endogenous GFAP gene (Brenner et al., 1994). Footprinting and cell transfection studies identified three subregions as important contributors to activity in addition to the basal promoter (BP), regions A (bp −1757 to −1613), B (−1612 to −1489), and D (−132 to −56). A construct made by juxtaposing the A, B, and D regions with the basal promoter proved 10 times more active than gfa2 when transfected into glioma cells, but when used as a transgene produced the surprising results that expression was no greater than that of gfa2, that it was brain region specific, and that it was present to a significant extent in several populations of neurons (Lee et al., 2006). Reinsertion of a 233 bp segment just downstream of B (bp −1488 to − 1256, the C1 segment) resulted in transgene expression indistinguishable from that of gfa2. Thus, the C1 segment contains sequences required for astrocytes to express in certain brain regions, and for suppression of GFAP expression in neurons. Block mutations within the C1 segment revealed that the first 55 bp, region C1.1, contributes to uniform brain expression, and that the next 45 bp, C1.2, suppresses activity in neurons.
The analysis of the GFAP promoter has now been extended to the B segment, which cell transfection studies had shown to be the enhancer region that makes the greatest contribution to transcriptional activity (Besnard et al., 1991). These studies were performed using the ABC1D construct, as one of the goals is to identify the minimal promoter elements required to mimic the activity of the endogenous gene. Four contiguous segments that together span the B region were individually block mutated within the ABC1D-nLac transgene, and their effects were analyzed in mice. When all four proved to have marked effects on expression, the effects were examined of mutations of specific, candidate transcription factor binding sites within each of the four B block mutations, as well as in the C1.1 and C1.2 segments.
Materials and Methods
Transgene Construction and Generation of Transgenic Mice
Experimental protocols involving mice were approved by the Institutional Animal Care and Use Committees of the University of Alabama at Birmingham and the University of Wisconsin, Madison. Schematic depictions of constructs used in this work are presented in Fig. 1. The gfa2-nLac and gfaABC1D-nLac transgenes are described in Lee et al. (2008). The B subregion block mutants were constructed by using PCR primers to introduce transversion base substitutions (A ↔ C, G ↔ T) throughout the entire region (bp −1612 to −1582 for B1; bp −1581 to −1549 for B2; bp −1548 to −1520 for B3; bp −1519 to −1489 for B4) using methods similar to those described previously (Masood et al., 1993). A similar PCR-based method was used to introduce the specific transcription factor (TF) site mutations. In most instances the selection of nucleotides to mutate to prevent TF binding was based on published work (Table 1). The presence of the intended mutations was confirmed by DNA sequencing. Mouse lines carrying the B block mutants were made by the Transgenic Animal/Embryonic Stem Cell Resource at the University of Alabama at Birmingham in a B6/SJL F2 hybrid background. These mice were subsequently bred to C57BL/6 mice (The Jackson Laboratory, Bar Harbor, ME) and generally analyzed after one to five backcrosses. Mice carrying the TF site mutants were made at the University of Wisconsin-Madison in an FVB background and analyzed either on the FVB background or after one to three backcrosses to C57BL/6. The total numbers of founder lines produced and of those that expressed the transgenes are shown in Table 2.
FIGURE 1.

Schematic depictions of transgenes. Construction of gfa2-nLac, gfaABC1D-nLac and the C1.1 and C1.2 block mutants has been previously described (Brenner et al., 1994; Lee et al., 2008). Coordinates for the 4 B subregions and the approximate position of the transcription factor (TF) binding sites are shown. The block mutants B1m, B2m, B3m and B4m were made by transversions, and the TF binding site mutations by specific site mutations as described in Materials and Methods and Table 1. BP = basal promoter.
TABLE 1.
GFAP TF binding sites selected for mutation
| Region | TF site | Wild type sequences | Mutated sequences | References |
|---|---|---|---|---|
| B1 | AP-1 | −1592 TGACTCA −1586 | TTCAGAA | Lee et al., 1987 |
| B2 | NFI | −1585 CCTTGGCACAGACAC −1571 | CCTTAACACAGACAC | Brun et al., 2009 |
| B3 | SP1 | −1543 TTCCCGCCGC −1534 | TCCCGATGC | Shi et al., 2001 |
| −1531 CCCAGCCCC −1523 | CCCAGATCC | Le Goff et al., 2003 | ||
| B4 | STAT3 | −1511 TTCCGAGAAG −1502 | TGCCGACAAG | Yu et al., 1999 |
| C1.1 | GATA | −1448 GGATAAA −1442 | GACTAAA | Clabby et al., 2003 |
| C1.2 | NF-κB | −1423 GGGCTGCCC −1415 | TCTCTGCCC | Kanda et al., 2000 |
Numbers flanking each wild type sequence give its position upstream of the RNA start site, which is nucleotide 5047 in NCBI Reference Sequence NG_008401.1. Underlined nucleotides were changed as indicated.
TABLE 2.
Numbers of transgenic lines
| B block mutant | Mutated transcription factor binding site | Total | |||||||||
|---|---|---|---|---|---|---|---|---|---|---|---|
| Lines | B1 | B2 | B3 | B4 | AP-1 | NFI | SP1 | STAT3 | GATA | NF-κB | |
| Expressing | 2 | 4 | 3 | 4 | 5 | 2 | 2 | 2 | 6 | 2 | 32 |
| Totala | 6 | 6 | 3 | 8 | 14 | 5 | 5 | 7 | 10 | 5 | 69 |
The totals include one founder each for B1, B2 and AP-1 that did not transmit the transgene to progeny.
Tissue Preparation
Single adult brains were prepared for both beta-galactosidase (β-gal) assay and activity staining with 5-bromo-4-chloro-3-indolyl-beta-D-galactopyranoside (X-gal) as previously described (Su et al., 2004; Lee et al., 2006) with slight modification. In brief, adult mice aged 2–6 months were rapidly decapitated, and the brain removed and cut into hemispheres. One hemisphere was snap frozen on dry ice and stored at −84°C for up to one month until used for β-gal assay (no decrease in β-gal activity was observed for samples stored for one month). The other hemisphere was immersion fixed in 4% paraformaldehyde (PFA) in 0.1M phosphate buffer (pH 7.4) for 1 hr on ice, then further processed for X-gal staining as described previously (Brenner, et al., 1994). To prepare a single brain for both immunohistochemistry (IHC) and X-gal staining, adult mice were anesthetized with Avertin® (2, 2, 2-Tribromoethanol) and then perfused transcardially with 30–50 mL of phosphate buffered saline (PBS) followed by 100 mL 4% PFA. One hemisphere was further processed for IHC and the other hemisphere processed for X-gal staining as described previously (Brenner, et al., 1994; Lee et al., 2006). We observed no difference in X-gal staining intensity between brains that were immersion fixed or perfusion fixed. For developmental studies, P1 brains and E15.5 embryonic heads were snap frozen and processed for β-gal assay. E15.5 embryonic brains were prepared for X-gal staining as described in Lee et al. (2006).
LacZ Assays
LacZ staining and β-gal quantitative assays were performed using brain hemispheres as described previously (Brenner et al., 1994; Lee et al., 2006) except that protein concentration was measured using the Coomassie protein assay kit (Pierce, Rockford, IL).
Immunohistochemistry
Immunohistochemistry were performed as previously described in Lee et al. (2008) with a slight modification. Cryosections about 10 μm thick mounted on Superfrost Plus slides (Fisher, Pittsburgh, PA) were washed in washing buffer (0.1% Triton X-100 in PBS) three times for 10 min, incubated for 1 hr in a blocking solution of 10% normal goat serum (Jackson ImmunoResearch Laboratories, West Grove, PA) in PBST (0.3% Triton X-100 in PBS), and then incubated overnight at 4°C with primary antibody. The next day, sections were washed three times for 10 min with washing buffer and incubated for 2 hr at room temperature with secondary antibodies. They were then washed six times for 10 min with washing buffer, briefly washed with Milli-Q water, briefly dried, and coverslipped with Prolong-Gold (Sigma, St. Louis, MO). Primary antibodies used for β-galactosidase/GFAP double labeling were mouse monoclonal anti-β-galactosidase (Promega, Madison, WI; 1:400) and rabbit polyclonal anti-GFAP (Dako, Glostrup, Denmark; 1:500); secondary antibodies were fluorescein goat anti-mouse IgG (Molecular Probes, Eugene, OR; 1:100) and Texas red-goat anti-rabbit IgG (Molecular Probes; 1:100), respectively. Primary antibodies used for β-galactosidase/NeuN double labeling were rabbit polyclonal anti-β-galactosidase (Cappel; 1:1000) and mouse monoclonal anti-NeuN (Chemicon, Temecula, CA; 1:200); secondary antibodies were Alexa Fluor 488 goat anti-rabbit IgG (Molecular Probes; 1:100) and Alexa Fluor 594 goat anti-rabbit IgG (Molecular Probes; 1:100), respectively. All antibodies were diluted in 1% normal goat serum in PBST. Images were obtained using a Zeiss AxioImager microscope.
Primary Astrocyte Culture and Transfection
The cells from the cortex of postnatal day 2 pups were dissociated in a papain solution with a modification of the method of Cahoy et al. (2008) In brief, the tissue was incubated in papain solution (20 U/mL, Worthington) for 30 min at 37°C in a cell culture incubator, followed by trituration for 10 times with a 1000 μl pipet tip to dissociate the cells. Ovomucoid protease inhibitor was added to inactivate the papain, and then incubated for 5 min at 37°C and spun down for 5 min at 250g. Then, the cell pellet was resuspended in culture media pre-equilibrated in a CO2 incubator at ~1 × 10⁶ cells/mL. The media consists of 10% fetal bovine serum (Hyclone), 10 U/mL penicillin, 10 μg/mL streptomycin, and 20 mM D-glucose in Minimal Essential Medium. Resuspended cells were plated in 25 cm2 cell culture flasks and incubated in a cell culture incubator for 2 hr. Unattached cells were removed by changing media twice with gentle shaking. The attached cells were grown for 7–10 days to confluency with media changes every other day. Confluent cells were replated at 2.5 × 10⁵ per well in 6 well plates. Two days after replating, when cells were about 75% confluent, transfections were performed using a Lipofectamine PLUS kit (Invitrogen, Carlsbad, CA) following the manufacturer’s instructions. Each well received 1.9 μg of a test plasmid (pnLacF served as the negative control) together with 0.1 μg of pGL3 (Promega) to normalize for transfection efficiency. LacZ and luciferase activities were assayed as described previously (Lee et al., 2006).
Statistical Analysis
Results are expressed as the mean and standard deviation of the mean. Student t-test was applied and P<0.05 was as taken statistically significant.
Results
Pattern and Strength of B Subregion Mutants of GfaABC1D-nLac
To find regulatory sites responsible for GFAP expression in vivo, the B region of the gfaABC1D-nLac transgene was divided into four similar sized subregions (B1 to B4) and the entire sequence of each mutated by transversions. At least two transgenic lines expressing each construct were examined for expression properties. As a reference we used gfaABC1D-nLac line U4–18, which was representative of the 10 gfaABC1D-nLac lines previously examined (Lee et al., 2008), and is hereafter referred to as the wild type. X-gal staining indicated that the B1, B2, and B3 block mutants each had significantly reduced expression compared with the wild type (Fig. 2, left side). This was confirmed by quantitative β-galactosidase solution assay, which also revealed reduced expression for the B4 block mutation (Fig. 3). Two of six transgenic lines carrying the B1 mutation expressed, but at extremely low levels (Figs. 2c,d and 3A). These results suggest that the B1 region contains regulatory sites critical for GFAP expression. Four of eight transgenic lines carrying the B2 mutant expressed lacZ. Each of these lines displayed a region specific expression pattern (Fig. 2g,h); whereas the wild type shows strong expression throughout the brain (Fig. 2a,b), the B2 block mutants expressed strongly only in the hippocampus, colliculus, and dorsal-medial cortex. The expression level of each line was significantly reduced, ranging from 8% to 19% of the wild type level (Fig. 3B). These results suggest that the B2 region contains regulatory sites that generally affect promoter activity, but that have a greater role in some astrocyte populations than others. B3 block mutations also strongly depressed transgene expression, as revealed by quantitative β-gal solution assay (Fig. 3C). Of the three lines that expressed, the first (B3m-1) had only 3% of the wild type activity and the third (B3m-3) only 8%. The activity of the second line (B3m-2) depended on whether the transgene was inherited through the female germline (5% activity) or male germline (37% activity) (inheritance denoted as B3m-2F and B3m-2M, respectively). Each of the lines expressed in a regionally specific manner, but each was different from the others. As an extreme example of this presumptive gene imprinting (Bartolomei, 2009), the maternally inherited transgene (B3m-2F) expressed more strongly in the thalamus than other brain regions (Fig. 2k,l), whereas the paternally inherited transgene (B3m-2M) expressed uniformly except in the thalamus (data not shown). Thus, the B3 block mutation produced no consistent effect on expression pattern. Four of eight B4 block mutants initially expressed the transgene and were analyzed for their expression pattern by X-gal staining; however, one of these lines ceased expression before quantitative assays were performed. The quantitative assay showed a significant reduction in activity, albeit not as dramatic as that for the other B block mutations (Fig. 3D) (the initial activity for the 4th line would likely have been at the lower end of the group, based on its X-gal staining). Each of the lines showed a regional pattern of expression, with activity being especially low in the thalamus and in the ventro-lateral aspect of cortex (Fig. 2o,p), indicating that the B4 region, like the B2 region, contains elements that regulate the regional pattern of expression as well as overall strength. Expression of the fourth line was even more localized, being largely restricted to the hippocampus and cerebellum. In summary, the results of X-gal staining and β-gal solution assays indicate that all four B subregions contain important regulatory sites for promoter strength, and that the B2 and B4 subregions also contain sites that are more important in certain astrocyte populations.
FIGURE 2.

Expression strength and pattern of B subregion mutants and their TF Site mutants compared to the wild type gfaABC1D-nLac. Brains from adult mice were stained for 24 hr with X-gal as described in the Materials and Methods section. The X-gal stained brains from the most representative line of each mutant are shown as follows (but see text for details of variability, especially for the B3 mutants); B1m-1 line for B1 block mutant (B1m), B2m-2 line for B2 mutant, B3m-2F line (inherited through the female germline—see text) for B3 mutant, B4m-3 line for B4 mutant, AP-1m-1 line for AP-1 mutant, NFIm-1 line for NFI mutant, SP1m-2 line for SP1 mutant, and STAT3m-2 line for STAT3 mutant. Numbers in parentheses are the number of the lines presenting the most common patterns (or, same as the representative line) among expressing mouse lines (about half of the founder lines made for each transgene expressed—see Table 2 for the numbers of expressing lines among total lines for each transgene).
FIGURE 3.

Relative promoter activities of B subregion block mutations and specific TF site mutants in transgenic mice as a percent of the wild type gfaABC1D promoter. For each mutant, at least two independent lines were assayed. No bar is shown for the two B1 block mutant lines, B1m-1 and B1m-2, because their activities were only about 0.2% that of wild type. For the B3 block mutant line 2, B3m-2F indicates offspring from a Female transgenic parent, and B3m-2M from a Male transgenic parent. The data are the average of 2–4 adult mice (2–6 month old) for each line. Error bars indicate the standard deviation of the mean.
Cell Specificity of B Subregion Mutants
We previously found that the gfaABD-nLac transgene shows significant neuronal expression, and that this is largely eliminated by restoring the C1 segment to produce a gfaABC1D-nLac transgene, thus identifying the C1 segment as contributing to astrocyte specificity (Lee et al., 2008). To determine if the B region also contributes to cell specificity, we examined those lines carrying B subregion block mutations whose expression was sufficient to permit double label immunofluorescent analysis. These were all of the B2 and B4 block mutation lines, and line 2 with the B3 block when paternally inherited. This B3m-2M line appeared to retain astrocyte specificity in all brain regions examined, which included cortex, hippocampus, olfactory bulb, cerebellum, and spinal cord (data not shown). However, the B2 and B4 block mutants expressed in neurons in one or more subregions of the hippocampus (Fig. 4 and Table 3). Each of the 4 B4 block mutations displayed strong neuronal expression in the dentate, as did two of the four B2 block mutations; and all four of the B2 block mutations showed some neuronal expression in the CA1 region, as did three of the 4 B4 block mutations. Neuronal expression outside of the hippocampus was rarely observed.
FIGURE 4.

Hippocampal neuronal expression of mutant transgenes. Staining is shown in the dentate gyrus for the wild type (WT), B2 mutant (B2m-2 line), NFI site mutant (NFIm-2 line), and in the CA1 region for the NF-κB site mutant (NF-κBm-2 line). Saggital sections from adult mice were double-stained for β-galactosidase and NeuN (for neurons) as described in the Materials and Methods section. Images were taken at 40x magnification.
TABLE 3.
Neuronal expression patterns of B block mutants and TF site mutants
| Transgene | Lines | Olfactory Bulb | Cortex | Dentate Gyrus | CA3 | CA1 | Cerebellum |
|---|---|---|---|---|---|---|---|
| WT | U4–18 | ++ | − | − | − | − | − |
| B1m | B1m-1,2,3 | Activity too low | |||||
| AP-1m | AP-1m-1,2,3 | ++ | − | − | − | − | − |
| B2m | B2m-1 | − | − | +++ | − | + | − |
| B2m-2 | − | −/+ | +++ | − | +++ | − | |
| B2m-3 | −ND | − | − | − | + | − | |
| B2m-4 | − | − | − | +/− | +/− | − | |
| NFIm | NFIm-1 | − | +/− | + | − | − | − |
| NFIm-2 | − | + | + | + | + | + | |
| B3m | B3m-1,2F,3 | Activity too low | |||||
| B3m-2M | − | − | − | − | − | − | |
| SP1m | SP1m-1,2 | Activity too low | |||||
| B4m | B4m-1 | − | − | +++ | − | − | − |
| B4m-2 | − | − | +++ | + | + | − | |
| B4m-3 | ++ | − | +++ | + | + | − | |
| B4m-4 | ND | ND | +++ | + | + | − | |
| STAT3m | STAT3m-1,2 | Activity too low | |||||
| GATAm | GATAm-3 | − | − | + | + | − | − |
| GATAm-4 | − | − | − | − | − | − | |
| GATAm-5 | − | − | + | + | − | − | |
| NF-κBm | NF-κBm-1 | − | + | + | + | + | − |
| NF-κBm-2 | − | + | + | + | + | − |
The cell specificity of the lacZ transgene was determined by double labeled IHC for beta-galactosidase and either GFAP (for astrocytes) or NeuN (for neurons) as described in the Materials and Methods section. +++ indicates strong expression, ++ indicates moderate expression, +indicates weak but clearly evident expression, +/− indicates very weak expression in a few cells, - indicates no expression, ND indicates cell specificity could not be determined because transgene expression was absent in astrocytes and neurons. Activity too low indicates mutant lines that displayed such low expression as assayed by X-gal staining that double label IHC was not feasible.
Developmental Expression of B Subregion Mutants
Each of the B region block mutants showed significantly reduced activity in adult mice compared to the wild type. To determine when this difference arose, we extended the analysis back to early development. As was the case for cell specificity, the lines with adequate activity to perform these analyses were the B2 and B4 block mutants and B3m-2M. We confirmed the previous observation of Lee et al. (2006) that expression of the wild type gfaABC1D-nLac transgene can clearly be detected by X-gal staining by E13.5, but found no B2, B3, and B4 mutant staining until E15.5. Because the activity of the block mutants is significantly lower than that of the wild type, this delay in visualizing activity could be an artifact of detection sensitivity rather than an altered time course. To distinguish between these two possibilities, we measured the relative change in activity between E15.5 and P1, reasoning that this ratio would be the same for mutants and wild type if the time course were the same, but would be larger for the mutants if the time course were initially delayed. As shown in Fig. 5A, the wild type and B2 mutant showed the same fold increase between E15.5 and P1, but the B3 and B4 mutants showed a much higher ratio, suggesting their expression was indeed temporally delayed.
FIGURE 5.
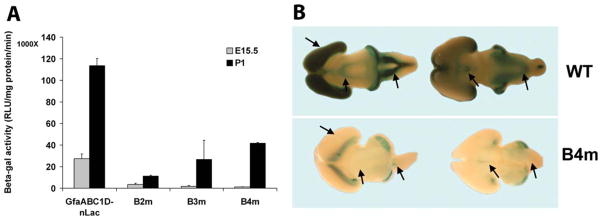
B2, B3, and B4 block mutant expression in developing brains. A: β-gal activities of the wild type and B2, B3, and B4 mutants at E15.5 and P1. The B2 mutant line B2m-2 and B4 mutant line B4m-3 were chosen for assay since these lines display representative expression properties. For B3 mutant, the highest expressing B3m-2M was chosen. Error bars indicate the standard deviation of the mean from 2 to 5 independent animals. B: X-gal stained E15.5 brains of gfaABC1D-nLac wild type (WT) and B4 mutant line B4m-3. Similar results were obtained for the B2 mutant line B2m-2. Arrows point to marked differences in expression between the WT and B4 mutant.
We also examined when in development the restricted pattern of expression of the B2 and B4 block mutants could first be discerned. Regional expression was previously observed for gfaABD-nLac, and was detected as early as E13.5 (Lee et al., 2006). E15.5 brains of the B2 and B4 mutants showed only a thin strip of X-gal staining along the caudal border of the dorsal cortex, in contrast to strong staining throughout the dorsal cortex of the wild type gfaABC1D brain (Fig. 5B). In addition, the mutants showed little staining of the mid brain and medulla oblongata (arrows in Fig. 5B). Thus, the regional pattern of expression of the B2 and B4 mutants appears to be established early in development.
B block Mutant Expression in Transfected Primary Astrocytes
The B block mutant study was performed using a transgenic approach because we had previously found that cell culture experiments did not provide a reliable readout of the effects of gross changes in the GFAP promoter. In particular, the gfaABD-nLac construct expressed equally well when transfected into primary cerebellar or hippocampal astrocytes, whereas in mice it expressed well only in the latter (Lee et al., 2006). To determine if the more subtle alterations involved in the B block mutations might be amenable to analysis by cell transfection, and thus, more readily studied, primary astrocytes were transfected with each of the constructs. Disappointingly, little correlation was found between the expression levels in transfected cells and in transgenic mice. In contrast to the large decrement in activity seen for each of the B block mutations in mice, only the B1 block mutant showed significantly reduced activity in the transfected cells, and even that reduction (40% activity remaining) was far greater than that seen in the mice (0.2% activity) (Fig. 6). Accordingly, we continued to use transgenic mice to explore the regulatory sites within each of the B subregions responsible for the observed phenotypes. Because of the time and cost required, a single candidate transcription factor site was selected for each of the subregions.
FIGURE 6.

B block mutant promoter strengths in transfected primary astrocytes and transgenic mouse brains. The Y-axis is activity relative to the wild type construct. The relative promoter activities of each B block mutant in transgenic mice are the averages of the values for the mutant lines shown in Fig. 3. Transfections of primary astrocytes were performed as described in the Materials and Methods section. The data are the average of two independent experiments, each performed in duplicate. Error bars indicate the standard deviation of the mean. Asterisks indicate p<0.001 by student t-test.
Selection of Candidate Transcription Factor Sites
Candidate transcription factor (TF) binding sites within each of the B subregions were identified using MATCH™ public version 1.0 with a matching score≥0.900. From these we selected those showing conservation among mammalian species using the UCSC genomic browser, “Vertebrate Multiz Alignment & Phastcons Conservation (28 species).” Finally, from this group a single candidate for each B subregion was selected based on a literature search for ones known to have CNS expression and for possible involvement with GFAP transcription. The candidates selected were AP-1 for the B1 block, NFI for the B2 block, SP1 for the B3 block, and STAT3 for the B4 block.
We also extended this analysis to the C1.1 and C1.2 segments, which our previous study had shown to harbor important regulatory elements, selecting GATA4 for the C1.1 region and NF-κB for the C1.2 region. Mice were analyzed carrying gfaABC1D-nLac transgenes in which a small number of nucleotide changes were introduced to specifically inactivate each of the selected TF binding sites (Table 1; note that the B3 region contains 2 SP1 sites, both of which were mutated).
Effect of TF Site Mutants on Expression Level and Pattern
Five lines of mice were obtained that expressed the AP-1 mutant transgene. Surprisingly, each expressed significantly throughout the brain, similar to the wild type and in sharp contrast to the almost complete absence of activity in the B1 mutants (Fig. 2a–f). Quantitative β-gal activity assay of three lines maintained for more detailed study confirmed that the AP-1 mutation did not account for the activity loss produced by the B1 block mutation (Fig. 3A). The AP-1 mutation did tend to reduce transgene expression compared with wild type, but this difference did not reach statistical significance (P=0.062).
Two lines expressing the NFI mutant transgene were obtained. Line NFIm-1 displayed a regional expression pattern very similar to that seen for the B2 block mutants (Fig. 2, compare g,h to i,j). However, the other line (NFIm-2) showed general expression throughout the brain almost identical to that of the wild type (data not shown). Thus, it is questionable whether the NFI site contributes to regional expression. Both NF1 mutant lines expressed more weakly than the wild type but more strongly than the B2 block mutants (Fig. 3B). Together, these data suggest that the NF1 site has an important role in GFAP expression, but that other sequences within the B2 segment also contribute.
Two lines were also obtained that express the SP1 site mutant transgene. Both the pattern and level of expression of these two lines were similar to that of the B3 block mutants (Figs. 2k–n and 3C), indicating that the SP1 site can account for the properties of the B3 block mutation.
The STAT3 mutant transgene was also expressed in two mouse lines. Surprisingly, the expression level of the two STAT3 mutant transgenes was markedly lower than that of the block mutations (Figs. 2o–r and 3D), although this difference did not reach statistical significance. The pattern of expression also appeared different; for example, the olfactory bulb was one of the regions with highest transgene activity in the B4 block mutants, but not in the STAT3 mutants, whereas in the thalamus and brain stem the STAT3 mutants were not as silent as the B4 block mutants (Fig. 2o–r).
Block mutation of the C1.1 region of the ABC1D-nLac transgene results in a regional pattern of expression similar to that of the ABD-nLac transgene (Lee et al., 2008). Seven lines were obtained which expressed a transgene carrying a specific GATA site mutation within the C1.1 region. Of these, five displayed activity throughout the brain, similar to the wild type, 1 displayed relatively weaker expression in cortex and one lacked expression in the lateral-ventral cortex (data not shown). Thus, this GATA site is not required for uniform expression. However, 5 of 6 lines assayed had β-galactosidase activities lower than that of the wild type (27%, 38%, 48%, 51%, 68%, and 115%), suggesting a role in promoter strength (P < 0.01 by one sample t-test). Previous studies had also shown that block mutation of the C1.2 region of the ABC1D-nLac transgene led to neuronal expression of the transgene, but did not affect either the level or pattern of expression. Both expressing lines obtained in which the C1.2 NF-κB site was mutated had a normal pattern (data not shown) and level of activity (55% and 114% of wild type). Effects on neuronal activity are described below.
Effect of TF Site Mutants on Cell Specificity
The extremely low activity level of the B1 block mutant lines prevented examination of effects on cell specificity; however, this could be performed for the AP-1 specific mutants, as they had significant activity. All three lines examined showed an absence of neuronal expression in cortex, hippocampus, and cerebellum. All three did show significant neuronal expression in the olfactory bulb, but since several wild type lines also express in olfactory bulb neurons (Table 3, Lee et al., 2008), we conclude that the AP-1 binding site does not appear to contribute to the specificity of GFAP expression. In contrast, both NFI mutant lines displayed clear neuronal expression in the hippocampus like that of the B2 block mutants, although the specific regions with neuronal activity were variable (Fig. 4 and Table 3). Neither the SP1 nor the STAT3 transgene were sufficiently active to permit assessment of their cell specificity of expression. Of the three lines expressing the transgene with the GATA site mutation in the C1.1 region, one had weak neuronal expression in the dentate, this line plus another had weak neuronal expression in the CA3 region, and the third line was completely astrocyte specific (Table 3). The C1.1 GATA site thus has a questionable effect on cell specificity, consistent with findings for the C1.1 block mutation (Lee et al., 2008). Both lines expressing the C1.2 NF-κB mutant transgene showed neuronal activity, similar to that displayed by the C1.2 block mutant lines (Table 3).
Discussion
GFAP Promoter Strength
We previously found that the 681 bp gfaABC1D promoter drove expression of an nLac transgene with the same developmental, spatial, and cell specificity properties as the 2.2 kb gfa2 promoter (Lee et al., 2008). That study also investigated the regulatory role of the C1 region, observing that the C1.1 segment contributed to the pattern of expression and that the C1.2 segment contributed to astrocyte specificity. These studies have now been extended to the B region by block mutating each of four contiguous segments that together span the B region, and to the investigation of the contributions of specific TF binding sites within each of the B segments and the C1.1 and C1.2 segments. Each of the four B region block mutations markedly reduced transgene activity—the B1 block mutation lowered expression by over 99%, the B2 mutation by about 84%, the B3 mutation by about 87%, and the B4 mutation by about 58%. This nonadditivity of effects of the block mutations indicates that multiple interacting sites control GFAP gene expression.
Since using transgenics to probe promoter function is expensive and laborious, we investigated whether the in vivo properties of the B block mutations could be replicated in transfected cells. This proved not to be the case (Fig. 6). We had noted similar results previously. The gfaABD promoter expressed 10-times more strongly than gfa2 when transfected into a glioma cell line, but as a transgene expressed at a level only equal to gfa2 in some brain regions and much more weakly in others. It also expressed well when transfected into primary cerebellar astrocytes, but poorly in these cells as a transgene. Similarly, enhanced GFAP promoters containing duplicated regulatory regions were over 100-times more active in transfected cells than gfa2, but essentially silent as transgenes (de Leeuw et al., 2006). Accordingly, transgenics continued to be used for the further probing of the GFAP promoter.
The first specific site investigated, that for binding of AP-1 TFs, revealed another striking, and quite unexpected example of the disconnect between observations in cell culture and in mice. The AP-1 site was selected as the most likely candidate for the dramatic loss of activity of the B1 block mutation because it is a conserved, consensus binding sequence, and there is evidence of a role for AP-1 in GFAP transcription. We previously found that mutation of a single nucleotide within the AP-1 site dramatically decreased expression in transiently transfected cells (Masood et al., 1993), and transfection of a dominant negative form of c-Jun inhibited GFAP expression in a glioma cell line (Gopalan, et al., 2006). In vivo, upregulation of GFAP expression was markedly attenuated in a c-Jun null mouse (Raivich et al., 2004). It was with considerable surprise, therefore, that we observed in this study that complete obliteration of the B1 block AP-1 site had little if any effect on expression in transgenic mice, especially since our ChIP assays showed that Jun proteins do bind to the wild type site, and that this binding is prevented by the mutation (data not shown). A possible explanation for these apparently conflicting observations is that the AP-1 site is not critical for the basal level of GFAP expression, but participates in its upregulation in response to injury. This is consistent with suggestions that cell lines and cultured neonatal astrocytes that are used for the cell transfection experiments share features of reactive astrocytes (Nakagawa et al., 2004). Preliminary results from our lab indeed suggest that the AP-1 mutant transgene responds less well to injury than its wild type counterpart (unpublished experiments).
Since mutation of the AP-1 site does not explain the nearly complete loss of transgene activity produced by the B1 block mutation, what other sites might be responsible? Two prime candidates are TCF11 and deltaEF1 (Zeb1). Both have consensus, conserved binding sites in the B1 segment, and both proteins are expressed in the CNS (Allen Institute). However, we could find no report of a CNS function for TCF11, and only a single report for deltaEF1 (Zeb1), which described its expression in proliferating progenitor cells in embryonic hind brain and motor neurons (Darling et al., 2003). A function for either TF in GFAP expression would thus be a novel finding. Another contributing TF could be NFI, which is discussed below as a candidate for the B2 segment, but has the first two nucleotides of its 15 bp recognition sequence (TTGGCN5GCCAA) present in the B1 region (the divisions of the B region were arbitrarily made, prior to knowledge being available of many of the potential TF binding sites). However, specific mutation of the NFI binding site, or even complete block mutation of B2, did not have as severe an effect on lacZ expression as the B1 block mutation.
Specific mutation of the NFI site reduced transgene activity by about 55%, accounting for a significant portion of the 84% reduction observed for the B2 block mutation. Just as for AP-1, a role for NFI had previously been inferred from cell transfection and gene knockout experiments. The role of the human GFAP NFI binding sites located at bp −120 to −106, −1585 to −1571 (the one tested in our study), and −1633 to −1619 were examined by Brun et al. (2009) by cell transfection. The most proximal site was tested alone, and produced about a fivefold decrease in promoter activity, whereas the second and third sites were only tested together, with their combined mutation resulting in about a twofold activity decrease. Our data suggest that the first of these two upstream sites is the important one, with the caveat that comparison of cell transfection and in vivo results is problematical. Our data are also consistent with findings that knockout of either the NFIA or NFIB gene results in a ten or fivefold reduction in GFAP levels, respectively (Steele-Perkins et al., 2005), although such gene knockout approaches do not distinguish between direct effects on GFAP transcription and indirect effects mediated through other regulatory pathways.
As the NFI specific mutation did not reduce transgene activity to the same extent as the B2 block mutation, additional TFs may act in this segment. A strong candidate is a consensus, conserved C/EBP site. A study of astrocyte differentiation in cell culture reported that C/EBPα expression increased as astrocytes differentiated (Cristiano et al., 2005). The C/EBPβ was reported to be involved in cortical neural differentiation (Paquin et al., 2005) and an LPS-induced inflammation response (Ejarque-Ortiz et al., 2007). In contrast, a C/EBPβ null mouse showed no decrease in GFAP expression (Kapadia et al., 2006).
The B3 region contains two putative binding sites for SP1, and one each for Pax4, IK-2, and CdxA. Each of these are consensus sites and highly conserved. The SP1 sites were selected for mutation in our study because this was the only TF for which there was data concerning an involvement in astrocyte gene expression (Loeffler et al., 2005). Abolition of these two sites reduced transgene expression to the same extent as the B3 block mutation, suggesting for the first time a role for SP1 in stimulating GFAP transcription. A previous study using cell transfection had instead suggested that SP1 acts as a repressor of GFAP transcription Dore et al., (2009). In addition to the caveat concerning cell transfection studies, this finding could differ from ours because a different SP1 site was studied; it is located in the B2 region, and was not included in our analyses because it fell below our cutoff score for a consensus sequence. SP1 function may be activated by the BMP-Smad signaling pathway (reviewed by Massague et al., 2005). This pathway has previously been implicated in astrocyte differentiation and GFAP gene activation, and proposed to act in conjunction with STAT3 (Yanagisawa et al., 2001). Our findings raise the possibility that BMP-Smad could instead, or in addition, regulate GFAP transcription through SP1.
Consistent with multiple previous studies performed in cell culture and in mice (Nakashima et al., 2002; Herrmann et al., 2008), specific mutation of the STAT3 binding site in the B4 segment markedly reduced transgene activity. The reduction was, in fact, to an even greater extent than the B4 block mutation, although the difference did not reach statistical significance. This raises the possibility that the B4 segment also contains a site that functions to inhibit transcription. A search for such a site using the MATCH™ public version 1.0 software, however, identified no candidates.
The large reductions in activity produced by the SP1 and STAT3 site mutations indicate that these TFs act in concert rather than independently. A possible mechanism could be synergistic binding to the promoter. However, ChIP assays showed that binding of neither SP1 nor STAT3 was affected when the site for the other was mutated (data not shown).
Regional Patterns of Expression
In addition to severely affecting the level of promoter activity, the B2 and B4 block mutations also resulted in expression being restricted to specific brain regions. Similar observations had previously been made for both the ABD promoter (Lee et al., 2006) and for the ABC1D promoter containing a C1.1 block mutation (Lee et al., 2008). The B2, B4, and C1.1 block mutations are similar in that expression is almost absent in the lateral cortex, but retained in the medial-dorsal cortex. However, the details of their expression patterns differ; for example, B2 mutants express significantly only in the posterior dorsal cortex, whereas the B4 mutants express throughout the cortex except for the lateral ventral region (Fig. 2g,o). These observations show a remarkable heterogeneity among astrocytes in their regulation of GFAP gene activity. Previous findings for the ABD and C1.1 block mutations, and made here for the B2 and B4 block mutations, suggest that this heterogeneity may arise early in development. Surprisingly, none of the region specific expression patterns was produced by the specific TF site mutations selected within each block. Thus, other sites are required either alone or in combination with those mutated here. Possible candidates are a consensus C/EBP site in the B2 region and a C/EBPα site in the C1.1 region; no additional sites were identified in the B4 region.
Astrocyte Specificity of Expression
We previously observed that an ABC1D-nLac transgene with a C1.2 block mutation displayed significant activity in hippocampal neurons (Lee et al., 2008), and now have a similar finding for the B2 and B4 block mutants. Similar neuronal expression was observed for the NFI site-specific mutation in the B2 region and for the NF-κB site-specific mutation in the C1.2 region; the effect of the STAT3 specific mutation in the B4 region could not be tested because of its extremely low expression level. These data suggest that NFI and NF-κB suppress GFAP expression in neurons. Thus, NFI appears to act as an activator of GFAP transcription in astrocytes, but as a suppressor in neurons. Possible explanations for these opposite effects could be presence in astrocytes and neurons of different combinations of the four NFI subunit proteins, or interactions with different cofactors. In contrast to NFI, mutation of the NF-κB site had no significant effect on astrocyte expression. Consistent with this observation, no binding of NF-κB to either the ABC1D-nLac transgene or to the endogenous mouse GFAP promoter could be detected by ChIP assay (data not shown). NFI and NF-κB are thus prime candidates for the suppression of GFAP, and perhaps other astrocytic genes, in neurons. Such a role is consistent with previous studies showing that NFI is involved in the development of hippocampal radial glia which give rise to hippocampal neurons, and that NF-κB is involved in cell proliferation in the initial stage of neural stem cell differentiation (Zhang et al., 2012). Part of the program of neuronal differentiation supported by these two TFs could be suppression of expression of astrocytic genes such as GFAP.
Acknowledgments
Grant sponsor: NINDS; Grant number: RO1NS39055; Grant sponsor: NIH IDDRC; Grant numbers: P30HD38985, P30HD03352; Grant sponsor: NIH Alabama Neuroscience Blueprint Cores; Grant number: NS057098; Grant sponsor: UAB Neuroscience Core; Grant number: P30NS47466.
The authors thank John Morello for construction of the B region block transgenes, Youngjin Lee for construction of the STAT3, GATA, and NF-κB transgenes, Denice Springman for generation of the transgenic founders, and Priya Vattem for assistance with the mouse colony.
References
- Bartolomei MS. Genomic imprinting: Employing and avoiding epigenetic processes. Genes Dev. 2009;23:2124–2133. doi: 10.1101/gad.1841409. [DOI] [PMC free article] [PubMed] [Google Scholar]
- Besnard F, Brenner M, Nakatani Y, Chao R, Purohit HJ, Freese E. Multiple interacting sites regulate astrocyte-specific transcription of the human gene for glial fibrillary acidic protein. J Biol Chem. 1991;266:18877–18883. [PubMed] [Google Scholar]
- Brenner M, Kisseberth WC, Su Y, Besnard F, Messing A. GFAP promoter directs astrocyte-specific expression in transgenic mice. J Neurosci. 1994;14:1030–1037. doi: 10.1523/JNEUROSCI.14-03-01030.1994. [DOI] [PMC free article] [PubMed] [Google Scholar]
- Brun M, Coles JE, Monckton EA, Glubrecht DD, Bisgrove D, Godbout R. Nuclear factor I regulates brain fatty acid-binding protein and glial fibrillary acidic protein gene expression in malignant glioma cell lines. J Mol Biol. 2009;391:282–300. doi: 10.1016/j.jmb.2009.06.041. [DOI] [PubMed] [Google Scholar]
- Cahoy JD, Emery B, Kaushal A, Foo LC, Zamanian JL, Christopherson KS, Xing Y, Lubischer JL, Krieg PA, Krupenko SA, Thompson WJ, Barres BA. A transcriptome database for astrocytes, neurons, and oligodendrocytes: A new resource for understanding brain development and function. J Neurosci. 2008;28:264–278. doi: 10.1523/JNEUROSCI.4178-07.2008. [DOI] [PMC free article] [PubMed] [Google Scholar]
- Clabby ML, Robison TA, Quigley HF, Wilson DB, Kelly DP. Retinoid X receptor alpha represses GATA-4-mediated transcription via a retinoid-dependent interaction with the cardiac-enriched repressor FOG-2. J Biol Chem. 2003;278:5760–5767. doi: 10.1074/jbc.M208173200. [DOI] [PubMed] [Google Scholar]
- Cristiano L, Cimini A, Moreno S, Ragnelli AM, Paola Cerù M. Peroxisome proliferator-activated receptors (PPARs) and related transcription factors in differentiating astrocyte cultures. Neuroscience. 2005;131:577–587. doi: 10.1016/j.neuroscience.2004.11.008. [DOI] [PubMed] [Google Scholar]
- Darling DS, Stearman RP, Qi Y, Qiu MS, Feller JP. Expression of Zfhep/deltaEF1 protein in palate, neural progenitors, and differentiated neurons. Gene Exp Patt. 2003;3:709–717. doi: 10.1016/s1567-133x(03)00147-9. [DOI] [PMC free article] [PubMed] [Google Scholar]
- Dore JJ, DeWitt JC, Setty N, Donald MD, Joo E, Chesarone MA, Birren SJ. Multiple signaling pathways converge to regulate bone-morphogenetic-protein-dependent glial gene expression. Dev Neurosci. 2009;31:473–486. doi: 10.1159/000210187. [DOI] [PMC free article] [PubMed] [Google Scholar]
- Ejarque-Ortiz A, Medina MG, Tusell JM, Pérez-González AP, Serratosa J, Saura J. Upregulation of CCAAT/enhancer binding protein beta in activated astrocytes and microglia. Glia. 2007;55:178–188. doi: 10.1002/glia.20446. [DOI] [PubMed] [Google Scholar]
- Gopalan SM, Wilczynska KM, Konik BS, Bryan L, Kordula T. Astrocyte-specific expression of the alpha1-antichymotrypsin and glial fibrillary acidic protein genes requires activator protein-1. J Biol Chem. 2006;281:1956–1963. doi: 10.1074/jbc.M510935200. [DOI] [PubMed] [Google Scholar]
- Herrmann JE, Imura T, Song B, Qi J, Ao Y, Nguyen TK, Korsak RA, Takeda K, Akira S, Sofroniew MV. STAT3 is a critical regulator of astrogliosis and scar formation after spinal cord injury. J Neurosci. 2008;28:7231–7243. doi: 10.1523/JNEUROSCI.1709-08.2008. [DOI] [PMC free article] [PubMed] [Google Scholar]
- Kapadia R, Tureyen K, Bowen KK, Kalluri H, Johnson PF, Vemuganti R. Decreased brain damage and curtailed inflammation in transcription factor CCAAT/enhancer binding protein beta knockout mice following transient focal cerebral ischemia. J Neurochem. 2006;98:1718–17131. doi: 10.1111/j.1471-4159.2006.04056.x. [DOI] [PubMed] [Google Scholar]
- Lee W, Mitchell P, Tjian R. Purified transcription factor AP-1 interacts with TPA-inducible enhancer elements. Cell. 1987;49:741–752. doi: 10.1016/0092-8674(87)90612-x. [DOI] [PubMed] [Google Scholar]
- Lee Y, Su M, Messing A, Brenner M. Astrocyte heterogeneity revealed by expression of a GFAP-LacZ transgene. Glia. 2006;53:677–687. doi: 10.1002/glia.20320. [DOI] [PubMed] [Google Scholar]
- Lee Y, Messing A, Su M, Brenner M. GFAP promoter elements required for region-specific and astrocyte-specific expression. Glia. 2008;56:481–493. doi: 10.1002/glia.20622. [DOI] [PubMed] [Google Scholar]
- de Leeuw B, Su M, ter Horst M, Iwata S, Rodijk M, Hoeben RC, Messing A, Smitt PS, Brenner M. Increased glia-specific transgene expression with glial fibrillary acidic protein promoters containing multiple enhancer elements. J Neurosci Res. 2006;83:744–753. doi: 10.1002/jnr.20776. [DOI] [PubMed] [Google Scholar]
- Le Goff W, Guerin M, Petit L, Chapman MJ, Thillet J. Regulation of human CETP gene expression: Role of SP1 and SP3 transcription factors at promoter sites −690, −629, and −37. J Lipid Res. 2003;44:1322–1331. doi: 10.1194/jlr.M200425-JLR200. [DOI] [PubMed] [Google Scholar]
- Loeffler S, Fayard B, Weis J, Weissenberger J. Interleukin-6 induces transcriptional activation of vascular endothelial growth factor (VEGF) in astrocytes in vivo and regulates VEGF promoter activity in glioblastoma cells via direct interaction between STAT3 and Sp1. Int J Cancer. 2005;115:202–213. doi: 10.1002/ijc.20871. [DOI] [PubMed] [Google Scholar]
- Masood K, Besnard F, Su Y, Brenner M. Analysis of a segment of the human glial fibrillary acidic protein gene that directs astrocyte-specific transcription. J Neurochem. 1993;61:160–166. doi: 10.1111/j.1471-4159.1993.tb03551.x. [DOI] [PubMed] [Google Scholar]
- Massagué J, Seoane J, Wotton D. Smad transcription factors. Genes Dev. 2005;19:2783–2810. doi: 10.1101/gad.1350705. [DOI] [PubMed] [Google Scholar]
- Nakagawa T, Schwartz JP. Gene expression patterns in in vivo normal adult astrocytes compared with cultured neonatal and normal adult astrocytes. Neurochem Int. 2004;45:203–242. doi: 10.1016/j.neuint.2003.09.007. [DOI] [PubMed] [Google Scholar]
- Nakashima K, Taga T. Mechanisms underlying cytokine-mediated cell-fate regulation in the nervous system. Mol Neurobiol. 2002;25:233–244. doi: 10.1385/MN:25:3:233. [DOI] [PubMed] [Google Scholar]
- Paquin A, Barnabé-Heider F, Kageyama R, Miller FD. CCAAT/enhancer-binding protein phosphorylation biases cortical precursors to generate neurons rather than astrocytes in vivo. J Neurosci. 2005;25:10747–10758. doi: 10.1523/JNEUROSCI.2662-05.2005. [DOI] [PMC free article] [PubMed] [Google Scholar]
- Raivich G, Bohatschek M, Da Costa C, Iwata O, Galiano M, Hristova M, Nateri AS, Makwana M, Riera-Sans L, Wolfer DP, Lipp HP, Aguzzi A, Wagner EF, Behrens A. The AP-1 transcription factor c-Jun is required for efficient axonal regeneration. Neuron. 2004;43:57–67. doi: 10.1016/j.neuron.2004.06.005. [DOI] [PubMed] [Google Scholar]
- Shi Q, Le X, Abbruzzese JL, Peng Z, Qian CN, Tang H, Xiong Q, Wang B, Li XC, Xie K. Constitutive Sp1 activity is essential for differential constitutive expression of vascular endothelial growth factor in human pancreatic adenocarcinoma. Cancer Res. 2001;61:4143–4154. [PubMed] [Google Scholar]
- Steele-Perkins G, Plachez C, Butz KG, Yang G, Bachurski CJ, Kinsman SL, Litwack ED, Richards LJ, Gronostajski RM. The transcription factor gene Nfib is essential for both lung maturation and brain development. Mol Cell Biol. 2005;25:685–698. doi: 10.1128/MCB.25.2.685-698.2005. [DOI] [PMC free article] [PubMed] [Google Scholar]
- Su M, Hu H, Lee Y, d’Azzo A, Messing A, Brenner M. Expression specificity of GFAP transgenes. Neurochem Res. 2004;29:2075–2093. doi: 10.1007/s11064-004-6881-1. [DOI] [PubMed] [Google Scholar]
- Yanagisawa M, Nakashima K, Takizawa T, Ochiai W, Arakawa H, Taga T. Signaling crosstalk underlying synergistic induction of astrocyte differentiation by BMPs and IL-6 family of cytokines. FEBS Lett. 2001;489:139–143. doi: 10.1016/s0014-5793(01)02095-6. [DOI] [PubMed] [Google Scholar]
- Zhang Y, Liu J, Yao S, Li F, Xin L, Lai M, Bracchi-Ricard V, Xu H, Yen W, Meng W, Liu S, Yang L, Karmally S, Liu J, Zhu H, Gordon J, Khalili K, Srinivasan S, Bethea JR, Mo X, Hu W. Nuclear factor kappa B signaling initiates early differentiation of neural stem cells. Stem Cells. 2012;30:510–524. doi: 10.1002/stem.1006. [DOI] [PMC free article] [PubMed] [Google Scholar]