

Abstract
Objective
To investigate the determinants and quality of coverage decisions among uninsured choosing plans in a hypothetical health insurance marketplace.
Study Setting
Two samples of uninsured individuals: one from an Internet-based sample comprised largely of young, healthy, tech-savvy individuals (n = 276), and the other from low-income, rural Virginians (n = 161).
Study Design
We assessed whether health insurance comprehension, numeracy, choice consistency, and the number of plan choices were associated with participants' ability to choose a cost-minimizing plan, given their expected health care needs (defined as choosing a plan costing no more than $500 in excess of the total estimated annual costs of the cheapest plan available).
Data Collection
Primary data were collected using an online questionnaire.
Principal Findings
Uninsured who were more numerate showed higher health insurance comprehension; those with more health insurance comprehension made choices of health insurance plans more consistent with their stated preferences; and those who made choices more concordant with their stated preferences were less likely to choose a plan that cost more than $500 in excess of the cheapest plan available.
Conclusions
Increasing health insurance comprehension and designing exchanges to facilitate plan comparison will be critical to ensuring the success of health insurance marketplaces.
Keywords: Affordable Care Act, health insurance exchanges/marketplaces, insurance choice, numeracy, health insurance comprehension, uninsured
With the implementation of the Affordable Care Act (ACA) and its mandate requiring health care coverage, millions of Americans have started shopping for health insurance—and are doing so in a new way. Those who do not have employer-based or government-sponsored insurance will purchase coverage through online exchanges, which, depending on state of residence, will be administered by the federal government or the state.
While this presents an opportunity for millions of uninsured, there are enormous challenges facing both those running the exchanges and those who must use them. Outreach is a significant challenge, especially because most of the uninsured had very little understanding of their responsibility to purchase coverage just a few months before the exchanges opened. In April 2013, 3 years after the law was passed and just a few months before the commencement of enrollment, more than half of young people and almost 60 percent of the uninsured did not even know the law was still in effect, much less details about their responsibilities (Kaiser Family Foundation 2013).
Moreover, even after an eligible person is successfully reached and understands the need to obtain coverage, he or she must make a decision on which plan to purchase from what company, which may have significant economic and health-related consequences. Previous research from the market for Medicare prescription drug coverage has shown that individuals find it difficult to navigate multiple choices and the accompanying information. As a result, they often spend more money than they need to and rarely switch to a more appropriate plan later on (Zhou and Zhang 2012; Abaluck and Gruber 2013). Providing information that is necessary—but not so much that it causes more confusion—is the major challenge facing those building such information systems.
The exchanges present a daunting challenge because of the people who need to use them. The uninsured differ from other population groups in several ways. While younger (and thus more likely to be facile at using online materials), they are less likely to be married, have lower income and education levels, and are more likely to be minorities and immigrants (O'Neill and O'Neill 2009). Younger individuals, moreover, tend to be more risk-taking and impulsive (Steinberg 2008; Steinberg et al. 2009).
In this article, we compare two samples of uninsured individuals that we constructed, surveyed, and tested: one from an Internet-based sample comprised largely of young, healthy, tech-savvy individuals, and the other of low-income, rural Virginians. We conduct a computer-based experiment using a hypothetical exchange like the one the uninsured will face in the marketplace and examine the quality of the decisions they make in choosing health insurance. Of particular interest are the determinants of the quality of choices made. Going forward, these results can be used by federal and state officials and the research community in devising more effective health insurance marketplaces.
Previous Research and Hypotheses
The section is subdivided into three determinants of the quality of insurance choices that are represented in a conceptual model in Appendix SA1 and examined empirically below: health insurance comprehension, amount of choice, and numerical ability or numeracy. For the purposes of our study, insurance choice quality is defined as whether consumers choose a plan that aligns with their stated preferences and, ultimately, whether they choose a cost-minimizing plan given their expected health care needs.
Health Insurance Comprehension
Health insurance comprehension has been defined as “the degree to which individuals have the knowledge, ability, and confidence to find and evaluate information about health plans, select the best plan for their own (or their family's) financial and health circumstances, and use the plan once enrolled” (Consumers Union 2011). It can be thought of as a decision-making ability, rather than a trait per se, reflecting consumers' understanding of health insurance information. Therefore, it is likely influenced by cognitive abilities consumers possess (e.g., numeracy) and the amount of information available in the decision environment.
While it may be a critical ability for consumers choosing in health insurance marketplaces, we know little about whether and how health insurance comprehension is related to insurance choices. The few studies to date on health insurance comprehension have focused on enrollees' comprehension of private insurance (e.g., Loewenstein et al. 2013) and specific aspects of public insurance programs (e.g., Medicare; Greenwald et al. 2006; McCormack et al. 2009) and the enrollee characteristics correlated with this comprehension. These studies find that insured Americans have difficulty understanding traditional health insurance plans because they are too complicated (Loewenstein et al. 2013). Although there has been scant evidence on health insurance comprehension and coverage choices (see Kim, Braun, and Williams 2013, for a review), findings from the finance literature suggest consumers with higher financial comprehension are more likely to rely on objective planning measures (e.g., financial calculators, experts, education) and are more successful in retirement and investment planning (Lusardi and Mitchell 2011). Therefore, we hypothesize that uninsured consumers with higher health insurance comprehension will make better coverage decisions insofar as they will be more likely to choose a cost-minimizing plan given their expected health care needs (Hypothesis 1).
Amount of Choice
Choice size has been identified as an important factor affecting consumers' health insurance decisions. The Medicare Prescription Drug Program (Part D) provides the best evidence to date on how individuals deal with health insurance choice. In a series of experiments, both younger and older participants more easily identified the cheapest insurance plan available when there were fewer choices (Hanoch et al. 2009, 2011; Barnes et al. 2012). This result is consistent with Herbert Simon's (1955) theory of bounded rationality and implies consumers facing information-rich environments often make suboptimal choices due to cognitive overload.
Several studies have also been conducted using “real world” data from the Medicare drug program. Using data from the first 4 years of the program, Abaluck and Gruber (2013) found that 20 percent of beneficiaries were choosing the plan that minimized total costs (premiums plus out-of-pocket expenses) in 2006, the first year of the program, and that over the next 3 years, even fewer did due to inertia. Zhou and Zhang (2012) demonstrated that only 5 percent of beneficiaries successfully chose the lowest cost plan in 2009, with the typical person spending over $350 more than he or she had to during the year. From this evidence base, we generate several hypotheses. First, health insurance comprehension should be negatively influenced by the amount of information in the decision environment. That is, having more plan options, and hence a more cognitively demanding decision environment, will be associated with lower health insurance comprehension scores (Hypothesis 2). Second, as the number of insurance choices increases, consumers will have more difficulty choosing a cost-minimizing plan given their expected health care needs (Hypothesis 3). We further hypothesize that, to the extent that more plan options in the choice set adversely affects the quality of coverage choices, the cognitive overload effect of having more information in the decision environment will be mediated by health insurance comprehension (Hypothesis 4).
Numeracy
Numeracy—or the ability to understand, use, and manipulate numbers—has received much attention from researchers, as it has been shown to play a vital role within the health domain. Researchers have also shown that numeracy is an independent factor, distinct from education and intelligence, that influences medical (Reyna et al. 2009) and health insurance decision making (Wood et al. 2011). For example, Wood et al. (2011; see also Hanoch et al. 2009; Hanoch et al., 2011) have identified numeracy as a key determinant of both younger and older adults' ability to choose the cheapest Medicare Part D plan, and Szrek and Bundorf (2011) reported that high levels of numeracy are directly associated with the likelihood of enrolling in the Medicare Part D program. We hypothesize that more numerate consumers will be more likely to choose a cost-minimizing plan (Hypothesis 5).
With regard to health insurance comprehension, Hibbard and colleagues (1998) have demonstrated that numeracy is strongly related to the capability to comprehend and evaluate health insurance plans. In another study, Hibbard and colleagues (2007) found that numeracy is the best predictor for evaluating participants' comprehension levels and capacity to correctly answer questions about measures of hospital quality, costs, and identifying the best hospital from a given list. We therefore predict that consumers with higher numeric ability will have higher health insurance comprehension (Hypothesis 6).
Data and Methods
Participants
Data were collected from two sources: a rural sample of uninsured and an online sample of uninsured.
Rural Sample of Uninsured
A community sample of uninsured individuals residing in the rural southern and southwestern counties of Virginia were recruited using several media outlets, including flyers posted in libraries and clinics; public service announcements aired on the radio, television, and community websites; and through community recruiters. Adults who self-identified as uninsured and were under age 65 were enrolled in the study and asked to complete an online survey. Typically, these surveys were conducted on computers at the local public libraries. Participants were compensated $25 for their time and the study was approved by the institutional review board of the university managing the study. In total, 201 uninsured rural individuals composed the first segment of our participants.
Online Sample of Uninsured
To collect data from an online sample of uninsured, a single question Human Intelligence Task (HIT) was published on Amazon's Mechanical Turk (Paolacci, Chandler, and Ipeirotis 2010) asking participants whether they were “covered by health insurance or some other kind of health care plan.” All respondents (N = 1,771) were compensated $0.25 for answering the eligibility question. Those who self-reported they were uninsured were offered $1.00 to answer the survey (N = 309).
Responses from the online and rural sample were then combined into a single dataset comprised of 510 responses. Twenty were dropped from the survey because they responded that they were insured. Another 53 observations were not included in the regression analysis due to missing data, resulting in a final analytic sample of 437 participants.
Survey
The survey consisted of seven sections: (1) demographics, (2) health status, (3) health services utilization, (4) insurance choice task, (5) numeracy, (6) patient activation, and (7) risk and time preferences (Appendix SA2).
Insurance Choice Variables
Eighty-eight single coverage plan quotes were obtained in the summer of 2012 for a hypothetical 35-year-old male nonsmoker residing in Virginia from eHealthInsurance.com. eHealthInsurance.com has recently contracted with the Department of Health and Human Services (DHHS) and is expected to enroll millions of Americans in federally run health insurance marketplaces (Mangan 2013). Plan quotes from common sellers in the nongroup market in Virginia (e.g., Anthem, Aetna, and United) were used to create nine exchange plans across three tiers—three bronze, three silver, and three gold—that varied on cost and coverage.
Participants were asked to read the following prompt:
Think about your health in this past year including how many times you saw your doctor, went to the emergency room, or stayed in the hospital. Also consider your current income. Imagine your health remains exactly the same this year as last year. Which health insurance plan do you think will best meet your individual needs this year?
Then, participants were presented with three or nine insurance plans in random order. Each plan choice included information on 10 attributes (e.g., copay, annual deductible). In the three-plan condition, one plan from each tier (bronze, silver, and gold) was presented to participants. In the nine-plan condition, two additional options were included in each tier (Figure 1). All participants chose a plan in both conditions.
Figure 1.
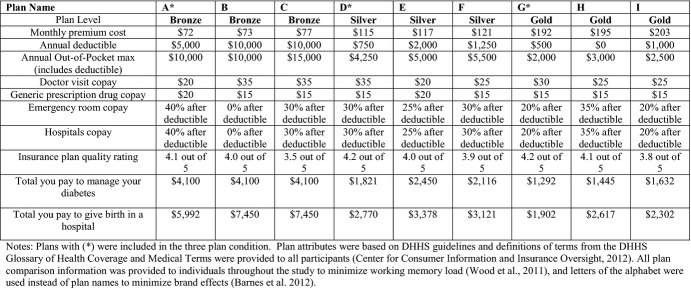
Three- and Nine-Plan Choice Condition
Chose a More Costly Plan Given Expected Health Care Needs
Using participants' self-reported health care utilization over the past 12 months as a proxy for expected health care needs, we estimated whether participants chose an insurance plan that minimized their total expected annual costs (i.e., premium plus out-of-pocket expenses). Utilization questions were adapted from the 2009 Medical Expenditure Panel Survey (MEPS) Household Component survey (U.S. Department of Health and Human Services 2009). Costs of self-reported health care use were approximated using median expenditures for each service in the 2009 MEPS (Appendix SA3).
From these data, total annual costs for each plan option were constructed for each individual that included premiums and, if services were used, copays for each service and out-of-pocket costs. For service utilizations that included a range (e.g., 2–3 doctors' visits), the minimum was used. Total annual costs for plans chosen averaged $2,434 (range $864-$15,924). Differences in total costs between the plan chosen and each alternative were calculated, and averaged $597 (range $0- $11,620). A binary variable was constructed to indicate whether individuals chose a plan that was at least $500 more in total annual costs than the lowest cost plan given their expected health care needs. On average, a $500 cost difference represented approximately 20 percent of total expenditures.
Choice Consistency
Respondents were also asked which 3 of the 10 plan attributes were most important in their decisions. To measure the extent to which participants stated and revealed preferences aligned, we defined choice consistency as whether the attributes that participants indicated were most important (stated preference) matched with whether these attributes were minimized (or maximized) in their plan choice (revealed preference). For example, if a participant indicated premiums were most important in their plan choice, did they choose a plan with the lowest premium? As few (3 percent) respondents were able to align all three preferences, consistent responses on two and three preference categories were combined. Thus, choice consistency was defined as 0, 1, 2 (or 3).
Health Insurance Comprehension
Four health insurance comprehension questions were asked, including (1) whether the plan chosen had a lower out-of-pocket max than other available plans; (2) whether the chosen plan had a lower annual deductible than other available plans; (3) which plan would be the lowest cost plan if no health services were needed in a year; and (4) which plan would be the lowest cost plan if $10,000 in health services were needed in a year. Health insurance comprehension scores were the sum of correct responses.
Covariates of Interest
Number of Plan Options
A binary variable was created indicating whether participants were choosing in the three- or nine-plan condition.
Numeracy
Numeracy was assessed using four items consisting of basic probability calculations from the Lipkus scale (Lipkus, Samsa, and Rimer 2001).
Control Variables
The adjusted analyses also controlled for participants' patient activation scores (Hibbard et al. 2005), risk preferences (DOSPERT; Blais and Weber 2006), discount rates (Khwaja, Silverman, and Sloan 2007), age, gender, race/ethnicity, education, marital status, income (below federal poverty level), in the online or rural sample, health status (SF-12 V2; Ware et al. 1995), presence of any chronic conditions, and, in health insurance comprehension and choice consistency regressions, whether participants were “high-utilizers” of health services (i.e., had more than one emergency department or inpatient admission in the past year) (Appendix SA4).
Statistical Analyses
Descriptive statistics are presented for each study sample and for the overall sample. T-tests and chi-square tests were used to determine whether any unadjusted differences exist in the means or frequencies of the variables between the two study samples. In the adjusted models, generalized estimating equations were fit assuming a Poisson distribution for health insurance comprehension and choice consistency, whereas a binomial distribution was assumed for choice of a more costly plan. Adjusted results are reported as count ratios (CRs) in the health insurance comprehension and choice consistency models and as odd ratios (ORs) for the model of whether participants chose a cost-minimizing plan. In all regression models, robust standard errors are used to correct variance estimates for clustering. Formal mediation analyses were conducted by estimating the indirect effect (i.e., the coefficient for the association between X and Y when mediator M is absent minus the coefficient for the association between X and Y when M is present [MacKinnon and Dwyer 1993]). Percentile method confidence intervals for indirect effects were obtained via bootstrapping using 10,000 replicates (Bollen and Stine 1990; Lockwood and MacKinnon 1998; Hayes and Scharkow 2013). All analyses were conducted in Stata 12 (StataCorp 2011).
Results
Sample Characteristics
Of the 437 uninsured participants comprising our analytic sample, 276 (63.2 percent) were from the online sample and the remainder from the rural sample (Table 1). Among all respondents, 40 percent chose a health plan costing at least $500 more than an available alternative given their expected health care needs. In our sample, participants had difficulty choosing plans that aligned with their stated preferences (consistency score 1.17, SD 0.78) and could correctly answer around two of the four health insurance comprehension questions (mean 2.61, SD 1.19) as well as two of the four numeracy questions (mean 2.15, SD 1.37).
Table 1.
Sample Characteristics
| Overall (n = 437) | Online (n = 276) | Rural (n = 161) | |
|---|---|---|---|
| Outcomes | |||
| Chose plan costing at least $500 more than the lowest cost plan | 40% | 34% | 52%* |
| Choice consistency (range 0–2) (SD) | 1.17 (0.78) | 1.20 (0.77) | 1.13 (0.79) |
| Health insurance comprehension (range 0–4) (SD) | 2.61 (1.19) | 2.97 (1.06) | 1.99*(1.15) |
| Regressors of interest | |||
| Nine-plan condition | 50% | 50% | 50%NA |
| Numeracy (range 0–4) (SD) | 2.15 (1.37) | 2.76 (1.18) | 1.10*(0.96) |
| Covariates | |||
| Patient activation (range 0–100) (SD) | 79.80 (10.23) | 78.90 (10.00) | 81.27*(10.18) |
| Missing patient activation | 36% | 48% | 19%* |
| DOSPERT (range 1–7) | |||
| Health risk (SD) | 2.76 (1.06) | 2.94 (1.04) | 2.44*(1.01) |
| Financial investment (SD) | 3.19 (1.52) | 3.24 (1.39) | 3.10 (1.73) |
| Financial risk (SD) | 1.62 (1.09) | 1.66 (1.12) | 1.55 (1.03) |
| Time discounting (range 0–4) | 2.11 (1.45) | 2.13 (1.45) | 2.09 (1.42) |
| Age (SD) | 33.52 (11.72) | 29.60 (8.96) | 40.31*(12.80) |
| Male | 54% | 65% | 34%* |
| Non-Hispanic White | 60% | 82% | 22%* |
| Non-Hispanic African American (NHAA) | 30% | 4% | 75%* |
| Other ethnicity | 10% | 14% | 3%* |
| High school or less | 36% | 21% | 56%* |
| Some college | 38% | 42% | 31%* |
| College or more | 28% | 37% | 13%* |
| Currently employed | 57% | 61% | 51%* |
| Federal poverty level (FPL) | 36% | 24% | 57%* |
| Rural sample | 37% | 0% | 100%NA |
| Fair or poor health | 24% | 21% | 28%* |
| Any chronic disease | 42% | 34% | 54%* |
| High-utilizer | 14% | 6% | 28%* |
Indicates bivariate test (t-test or chi-square) of differences between online and rural sample characteristics significant at p < .05.
Unadjusted Associations of Choosing a More Costly Plan
Before adjustment, there was no significant difference in the probability of choosing a plan that was at least $500 more expensive than the cheapest alternative when participants chose from three (37.4 percent) or nine plans (42.9 percent) (p = .11). The average cost difference between the plan chosen and the cheapest alternative was $537 in the three-plan condition and $656 in the nine-plan condition. The probability of choosing a more costly plan significantly decreased as consistency score increased (p < .01). The difference in excess costs for participants with a choice consistency score of 2 or higher was $529 versus $656 for participants with a consistency score of 0. The likelihood of choosing a more costly plan decreased significantly as insurance comprehension increased (p < .01) with participants scoring perfectly on comprehension having $360 in average excess costs and those scoring 0 having a difference of $1,109.
Adjusted Associations of Choosing a More Costly Plan, Choice Consistency, and Health Insurance Comprehension
Chose a More Costly Plan Given Expected Health Care Needs
After adjustment, we found evidence supporting hypothesis 1 that health insurance comprehension was negatively associated with the odds of choosing a plan that was at least $500 more expensive in total estimated annual costs (OR 0.84, p < .05, Table 2).1 We also found support for a positive relationship between the number of plans and consumers' choice of a more costly plan (OR 1.31, p < .05; hypothesis 3) before controlling for health insurance comprehension. However, after controlling for comprehension, the effect of more plan choice decreased in magnitude and was not significant. Our mediation test indicated the effect of more plan options on choosing a more costly plan may operate indirectly through health insurance comprehension (OR 1.10, p < .05; hypothesis 4). However, we found no evidence to support hypothesis 5 that higher levels of numeracy were associated with a decreased likelihood of choosing a more costly plan.
Table 2.
Correlates of Choice of a Plan at Least $500 More Than the Lowest Cost Plan Given Expected Health Care Needs
| Odds Ratio (SE) | Odds Ratio (SE) | Odds Ratio (SE) | |
|---|---|---|---|
| Regressors of interest | |||
| Choice consistency | – | – | 0.42*** (0.05) |
| Health insurance comprehension | – | 0.84** (0.06) | 0.94 (0.07) |
| Nine-plan condition | 1.31** (0.16) | 1.19 (0.16) | 1.18 (0.17) |
| Numeracy | 0.96 (0.08) | 0.99 (0.08) | 0.99 (0.09) |
| Covariates | |||
| Patient activation | 1.00 (0.01) | 1.00 (0.01) | 1.00 (0.01) |
| Missing patient activation | 0.52** (0.10) | 0.54*** (0.11) | 0.60** (0.11) |
| Health risk | 0.83** (0.08) | 0.84* (0.08) | 0.86 (0.08) |
| Financial investment | 1.08 (0.07) | 1.09 (0.07) | 1.06 (0.07) |
| Financial risk | 1.17* (0.09) | 1.16* (0.09) | 1.15* (0.09) |
| Time discounting | 1.05 (0.06) | 1.06 (0.06) | 1.04 (0.06) |
| Age | 1.01 (0.01) | 1.01 (0.01) | 1.00 (0.01) |
| Male | 1.04 (0.21) | 1.03 (0.21) | 0.92 (0.18) |
| NHAA | 1.06 (0.29) | 1.00 (0.27) | 1.18 (0.34) |
| Other race | 0.73 (0.22) | 0.71 (0.20) | 0.80 (0.21) |
| Some college | 0.65** (0.13) | 0.65** (0.13) | 0.57** (0.12) |
| College or more | 1.06 (0.27) | 1.03 (0.26) | 0.82 (0.22) |
| Employed | 1.11 (0.19) | 1.11 (0.19) | 0.98 (0.18) |
| FPL | 1.33 (0.25) | 1.33 (0.25) | 1.30 (0.26) |
| Rural | 1.16 (0.34) | 1.09 (0.32) | 1.05 (0.31) |
| Fair or poor health | 1.04 (0.24) | 1.04 (0.24) | 0.83 (0.19) |
| Any chronic disease | 1.23 (0.25) | 1.24 (0.25) | 1.43* (0.29) |
| Constant | 0.67 (0.62) | 0.91 (0.86) | 2.30 (2.33) |
| Indirect effects¶ (mediation) | |||
| Nine plans | – | 1.10** (0.05) | 1.10* (0.07) |
| Health insurance comprehension | – | – | 0.90*** (0.03) |
| Observations | 852 | 852 | 848 |
| Number of individuals | 437 | 437 | 437 |
Correlates of choosing a more costly plan modeled using GEE assuming a binomial distribution for the outcomes. Robust standard errors were used.
Indirect effects were calculated by subtracting the unexponentiated coefficient of interest in the model controlling for the mediator from the same coefficient in the model without the mediator. Standard errors and percentile method confidence intervals for indirect effects were obtained by bootstrapping using 10,000 replicates.
p < .10,
p < .05,
p < .01.
Increased choice consistency was associated with lower odds of choosing a more costly plan (OR 0.42, p < .01). With choice consistency in the model, the health insurance comprehension and nine-plan choice coefficients were no longer significant. Formal mediation tests indicate the effect of health insurance comprehension on choosing a more costly plan was indirect via choice consistency (OR 0.90, p < .01). We also found weak evidence that the effect increased plan choice on making a more costly coverage choice was mediated by choice consistency (OR 1.11, p < .10), presumably via health insurance comprehension.
Choice Consistency
Higher health insurance comprehension scores were significantly associated with the consistency between stated and revealed preferences in participants' plan choices (CR 1.13, p < .01, Table 3), providing support for hypothesis 1. In addition, we found evidence in support of hypothesis 3 of an inverse relationship between number of plan options and choice consistency (CR 0.93, p < .05). We also found support for hypothesis 4 that the effect of the number of plan options on consistency was mediated by health insurance comprehension (CR 1.08, p < .01).
Table 3.
Correlates of Choice Consistency†
| Count Ratio (SE) | Count Ratio (SE) | |
|---|---|---|
| Regressors of interest | ||
| Health insurance comprehension | – | 1.13*** (0.03) |
| Nine-plan condition | 0.93** (0.03) | 1.00 (0.04) |
| Numeracy | 1.01 (0.03) | 0.99 (0.02) |
| Covariates | ||
| Patient activation | 1.00 (0.01) | 1.00 (0.01) |
| Missing patient activation | 1.15** (0.07) | 1.13* (0.07) |
| Health risk | 1.05* (0.03) | 1.04 (0.03) |
| Financial investment | 0.97 (0.01) | 0.97 (0.02) |
| Financial risk | 0.98 (0.03) | 0.99 (0.03) |
| Time discounting | 0.99 (0.02) | 0.98 (0.02) |
| Age | 1.00 (0.01) | 1.00 (0.01) |
| Male | 0.90* (0.05) | 0.91 (0.05) |
| NHAA | 1.10 (0.09) | 1.15 (0.09) |
| Other race | 1.11 (0.10) | 1.13 (0.10) |
| Some college | 0.93 (0.06) | 0.92 (0.05) |
| College or more | 0.81*** (0.06) | 0.82*** (0.06) |
| Employed | 0.89** (0.05) | 0.89** (0.04) |
| FPL | 0.96 (0.06) | 0.97 (0.06) |
| Rural | 0.91 (0.09) | 0.95 (0.09) |
| Fair or poor health | 0.81*** (0.06) | 0.81** (0.06) |
| Any chronic disease | 1.08 (0.07) | 1.08 (0.06) |
| High utilization | 1.07 (0.09) | 1.09 (0.08) |
| Constant | 1.31 (0.37) | 1.03 (0.28) |
| Indirect effects§ (mediation) | ||
| Nine plans | – | 1.08*** (0.02) |
| Observations | 848 | 848 |
| Number of individuals | 437 | 437 |
Correlates of choice consistency modeled using GEE assuming a Poisson distribution for the outcome. Robust standard errors were used.
Indirect effects were calculated by subtracting the coefficient of interest in the model controlling for the mediator from the same unexponentiated coefficient in the model without the mediator. Standard errors and percentile method confidence intervals for indirect effects were obtained by bootstrapping using 10,000 replicates.
p < .10,
p < .05,
p < .01.
Health Insurance Comprehension
We found support for the second hypothesis that increasing the number of insurance plan options was associated with lower health insurance comprehension scores (CR 0.79, p < .01, Table 4). Supporting hypothesis 6, higher levels of numeracy were also significantly associated with higher health insurance comprehension scores (CR 1.09, p < .01).
Table 4.
Correlates of Health Insurance Comprehension†
| Count Ratio (SE) | |
|---|---|
| Regressors of interest | |
| Nine-plan condition | 0.79*** (0.02) |
| Numeracy | 1.09*** (0.02) |
| Covariates | |
| Patient activation | 1.00 (0.01) |
| Missing patient activation | 1.06 (0.04) |
| Health risk | 1.03* (0.02) |
| Financial investment | 1.02* (0.01) |
| Financial risk | 0.96** (0.01) |
| Time discounting | 1.02* (0.01) |
| Age | 1.00** (0.01) |
| Male | 0.97 (0.04) |
| NHAA | 0.84*** (0.05) |
| Other race | 0.97 (0.04) |
| Some college | 1.01 (0.04) |
| College or more | 0.94 (0.04) |
| Employed | 1.00 (0.03) |
| FPL | 0.98 (0.04) |
| Rural | 0.86** (0.05) |
| Fair or poor health | 1.01 (0.04) |
| Any chronic disease | 1.01 (0.04) |
| High utilization | 0.93 (0.05) |
| Constant | 1.94*** (0.34) |
| Observations | 852 |
| Number of individuals | 437 |
Correlates of health insurance comprehension were modeled using generalized estimating equations (GEE) assuming a Poisson distribution for the outcome. Robust standard errors were used.
p < .10,
p < .05,
p < .01.
Sensitivity Tests
We tested the sensitivity of our main results to empirical definitions of choosing a cost-minimizing plan (i.e., dichotomous vs. linear cost difference) and choice consistency, missing data, interactions between the sample indicator and regressors of interest, collinearity, and preferences for plan quality. These are presented in Appendix SA5. Broadly, the main results are robust to the alternative model specifications examined.
Discussion
Our study is among the first to explore how uninsured populations are expected to perform in health insurance exchanges. In line with earlier work on Medicare Part D (Hanoch et al. 2009; Abaluck and Gruber 2013), the findings revealed that many consumers did not choose a cost-minimizing plan. Furthermore, the younger, more tech-savvy uninsured in the online sample, and poorer, more rural uninsured both performed poorly in the coverage decision tasks. Participants in the sample, furthermore, had difficulty choosing plans that aligned with their stated preferences (choice consistency), correctly answering factual questions about health insurance choices (health insurance comprehension), and calculating simple probabilities (numeracy).
These results are not isolated ones. Others have also found that even insured individuals face serious obstacles in answering questions about health insurance (Loewenstein et al. 2013). An investigation by Finucane et al. (2005) revealed that young and old participants have difficulties answering simple questions about health insurance information, such as being able to identify the lowest copayment for an office visit from a grid that included only four different plans. Earlier examinations (Marquis 1983), likewise, have shown that even families who possess health insurance are unable to respond correctly to questions about their own health care coverage.
Five of our six hypotheses were supported by our data analysis. The results are consistent with the idea that consumers' decision-making abilities, in conjunction with the amount of information in their choice environment, affect the quality of the health insurance choices they make. Two important factors at play in coverage choices are numeracy and health insurance comprehension, and they were statistically significant in the regression analyses. Those who were more numerate showed higher health insurance comprehension; those with more health insurance comprehension made choices of health insurance plans more consistent with their stated preferences; and those who made choices more concordant with their stated preference were less likely to choose a plan that cost more than $500 in excess of the cheapest plan available. The amount of information in the decision environment was also important. Participants facing more plan choices showed lower health insurance comprehension. Further, the results suggest that cognitive overload from too much information in the decision environment operates on choice quality via insurance comprehension.
These findings augment and extend earlier work focusing on Medicare and Medicare Part D. Studies by Hibbard and colleagues (2001) looking at health insurance within Medicare and Hanoch et al. (2009, Hanoch et al. 2011; Wood et al. 2011), focusing on Medicare Part D, found that individuals encounter difficulties in making health insurance decisions. Indeed, in Hanoch et al. (2009) and Wood et al. (2011), individuals who faced a greater array of prescription drug options made worse decisions, findings that were later supported by examining real-world data (Abaluck and Gruber 2013). Finally, the results further highlight the importance of numeracy within the medical arena, and especially with regard to understanding insurance. Peters et al. (2007), as well as Szrek and Bundorf (2011, 2013), also found that more numerate individuals make better insurance-related decisions.
Limitations
Although our data and design have many strengths, several limitations suggest caution should be taken when interpreting our results. Neither the rural nor online sample was representative of uninsured in rural regions of the United States or of the entire U.S. population of uninsured. By design, they represent two very different populations who will be enrolling in health insurance marketplaces: younger, healthier, more tech-savvy uninsured and less healthy, rural uninsured who may be less facile with computer technology. The results may also be limited by the lack of incentive-compatibility in the choice experiments. Participant compensation was not aligned with performance and so, without “skin in the game,” various factors, including self-serving biases, inattention, and strategic motives, could cause them to misreport their true preferences, limiting the generalizability of the findings to real-world decision making (see Camerer and Hogarth 1999 for a discussion).
Using cost minimization as the choice objective may limit the scope of the findings as well. For example, no particular coverage choice is necessarily a bad choice in the real world due to differences in provider networks across plan offerings. Furthermore, plans with the same expected costs may have different risk properties, such as the risk of higher maximum out-of-pocket costs. However, earlier evidence suggests that cost is one of the most salient and important factors in coverage choices (Mechanic 1989; MedPAC 2006) and so we empirically defined our insurance choice outcomes in the experiments to delineate between clear winners and losers based on costs. In doing so, two sources of measurement error arise from our empirical treatment of the excess cost outcome. The data do not allow the use of the actual costs participants faced and, even if they did, participants may not accurately recall their utilization history. Furthermore, the consistency of the estimates in each of the models may be affected by omitted variables bias. For example, past experiences with health insurance plan choices (e.g., through a previous job) are not controlled for. If such experiences are strongly and positively correlated with health insurance comprehension and choosing a cost-minimizing plan, then we would expect the insurance comprehension estimate to be biased away from zero.
Conclusions
The Congressional Budget Office estimates 26 million Americans will be covered in exchanges by 2020 (Congressional Budget Office 2013). Our results are among the first to demonstrate that numeracy and health insurance comprehension will be critical skills in choosing a health insurance plan that offers consumers adequate risk protection given their expected health care needs and therefore critical to the successful implementation of the Affordable Care Act. Further, the relationship between these decision-making skills and the quality of coverage choices was consistent across a spectrum of uninsured individuals differing in age, income, and education. Indeed, these findings raise serious concern about consumers' ability to navigate through the exchanges, as well as compare and choose health insurance plans. Recently, Peters, Meilleur, and Tompkins (2013) reported that nearly 30 percent of uninsured adults had a below basic level of numeracy. The findings regarding fewer plan choices are consistent with much of the literature that was reviewed earlier in the article. At the time of writing, the number of choices is not clear and will vary by state, but at a minimum, individuals will have to choose comprehensiveness of coverage (e.g., gold, silver, or bronze plans) as well as particular companies within the tier they select.
Admittedly, in the short run it will be exceedingly difficult to improve the population's numeracy and health insurance comprehension. Nevertheless, other strategies, which focus on enhancing insurance choices outside of educating decision makers, are possible. One example is for the federal and state governments to support a vibrant network of insurance navigators. These experts will fill vital roles by assisting consumers in understanding health insurance and comparing plan options. Second, the marketplaces themselves can be designed to make plan comparisons more salient rather than rely on consumers to be more informed and engaged in their decision making (Nease et al. 2013). For example, to reduce reliance on numeracy in insurance choices, recent work has found using symbols rather than numbers improves plan choices in Medicare Part D (Barnes et al. 2012). Further, some state-run exchanges (e.g., California, Massachusetts) are standardizing coverage options within a metal tier to improve comparability of plan offerings. These purposeful designs to the choice environment will likely assist consumers in their decision making, and other efforts toward choice architecture in exchanges should be explored.
Speaking about the Affordable Care Act, former U.S. President Bill Clinton stated that “the health of our people, the security and stability of our families, and the strength of our economy are all riding on getting health care reform right and doing it well.” He also noted that he was “still amazed at how much misunderstanding there is about the current system of health care” (Goodnough and Chosick 2013). Indeed, awareness of these marketplaces among potential enrollees is low and many who are aware of them fear they will be too complicated (Commonwealth Fund 2013). The health insurance choices made in exchanges in the coming years will have major financial and health ramifications for consumers, for the broader health care system and, ultimately, for the success of the most sweeping health reform since the enactment of Medicare and Medicaid. Whether the policy goals of the Affordable Care Act are achieved will be shaped in no small part by the extent of Americans becoming engaged consumers of health insurance. To do so, our findings suggest they will need a great deal of help understanding and comparing coverage options when making these important decisions.
Acknowledgments
Joint Acknowledgment/Disclosure Statement: The authors thank the reviewers and the editors for their many helpful comments. We also thank Mirna Hernandez, Sarah Kirkman, and Christopher Lee for project support. Funding was provided in part by VCU Massey Cancer Center and the Virginia Tobacco Indemnification and Community Revitalization Commission Grant #2585.
Disclosures: None.
Disclaimers: None.
Excess health plan costs given expected health care needs may arise from over- or underinsurance (i.e., choosing too much coverage if healthy or too little if sick). Both sources of decision error should be affected health insurance comprehension. To test whether this was the case, we first created rough indicators for over- and underinsurance. Recall that the variable “high-utilizer” is defined as having more than one emergency department visit and/or any hospital stay in the past year. Underinsurance was defined being a high-utilizer and choosing a “Bronze” plan. Overinsurance was defined as choosing a “Silver” or “Gold” plan but not being a “high-utilizer.” We then tested for differences in health insurance comprehension across these groups. We found that participants who were over- or underinsured had significantly lower unadjusted insurance comprehension than those who were “adequately” insured. Specifically, those who were adequately insured had comprehension scores of 2.69 versus 2.45 for those who were overinsured (p < .01). Likewise, those who were adequately insured had comprehension scores that were 2.65 versus 1.96 for those who were underinsured (p < .01).
NOTE
Excess health plan costs given expected health care needs may arise from over- or underinsurance (i.e., choosing too much coverage if healthy or too little if sick). Both sources of decision error should be affected health insurance comprehension. To test whether this was the case, we first created rough indicators for over- and underinsurance. Recall that the variable “high-utilizer” is defined as having more than one emergency department visit and/or any hospital stay in the past year. Underinsurance was defined being a high-utilizer and choosing a “Bronze” plan. Overinsurance was defined as choosing a “Silver” or “Gold” plan but not being a “high-utilizer.” We then tested for differences in health insurance comprehension across these groups. We found that participants who were over- or underinsured had significantly lower unadjusted insurance comprehension than those who were “adequately” insured. Specifically, those who were adequately insured had comprehension scores of 2.69 versus 2.45 for those who were overinsured (p < .01). Likewise, those who were adequately insured had comprehension scores that were 2.65 versus 1.96 for those who were underinsured (p < .01).
Supporting Information
Appendix SA1:
Conceptual Model of Coverage Quality.
Appendix SA2: Survey.
Appendix SA3: 2009 MEPS Health Services Utilization and Costs.
Appendix SA4: Empirical Definitions of Control Measures Used in Adjusted Analyses.
Appendix SA5: Sensitivity Tests.
Appendix SA6: Author Matrix.
References
- Abaluck J. Gruber J. Evolving Choice Inconsistencies in Choice of Prescription Drug Insurance. National Bureau of Economic Research; 2013. Working Paper 19163. [accessed on August 7, 2013]. Available at: http://www.nber.org/papers/w19163. [DOI] [PMC free article] [PubMed] [Google Scholar]
- Barnes A, Hanoch Y, Wood S, Liu PJ. Rice T. One Fish, Two Fish, Red Fish, Blue Fish: Effects of Price Frames, Brand Names, and Choice Set Size in Medicare Part D Insurance Plan Decisions. Medical Care Research and Review. 2012;69(4):460–73. doi: 10.1177/1077558711435365. [DOI] [PubMed] [Google Scholar]
- Blais A-R. Weber EU. A Domain-Specific Risk-Taking (DOSPERT) Scale for Adult Populations. Judgment and Decision Making. 2006;1:33–47. [Google Scholar]
- Bollen KA. Stine R. Direct and Indirect Effects: Classical and Bootstrap Estimates of Variability. Sociological Methodology. 1990;20:115–40. [Google Scholar]
- Camerer C. Hogarth R. The Effects of Financial Incentives in Experiments: A Review and Capital-Labor-Production Framework. Journal of Risk and Uncertainty. 1999;19(1–3):7–42. [Google Scholar]
- Commonwealth Fund. 2013. “ Covering Young Adults under the Affordable Care Act: The Importance of Outreach and Medicaid Expansions ” [accessed on August 12, 2013]. Available at http://www.commonwealthfund.org/Publications/Issue-Briefs/2013/Aug/Covering-Young-Adults-Under-the-Affordable-Care-Act.aspx.
- Congressional Budget Office. 2013. “ CBO's February 2013 Estimate of the Effects of the Affordable Care Act on Health Insurance Coverage ” [accessed on August 20, 2013]. Available at http://www.cbo.gov/sites/default/files/cbofiles/attachments/43900_ACAInsuranceCoverageEffects.pdf.
- Consumers Union. 2011. “ Measure Consumers' Health Insurance Literacy ” [accessed on August 3, 2013]. Available at http://consumersunion.org/news/measure-consumers-health-insurance-literacy/
- Finucane ML, Mertz CK, Slovic P. Schmidt ES. Task Complexity and Older Adults' Decision-Making Competence. Psychology and Aging. 2005;20(1):71–84. doi: 10.1037/0882-7974.20.1.71. [DOI] [PubMed] [Google Scholar]
- Goodnough A. Chosick A. 2013. Clinton Urges Americans to Sign Up for Health Care Exchanges ” [accessed on September 5, 2013]. Available at http://www.nytimes.com/2013/09/05/us/politics/clinton-urges-americans-to-sign-up-for-health-care-exchanges.html?hp.
- Greenwald LM, McCormack LA, Uhriq JD. West N. Measures and Predictors of Medicare Knowledge: A Review of the Literature. Health Care Finance and Review. 2006;27(4):1–12. [PMC free article] [PubMed] [Google Scholar]
- Hanoch Y, Rice T, Cummings J. Wood S. How Much Choice Is Too Much?: The Case of the Medicare Prescription Drug Benefit. Health Services Research. 2009;44(4):1157–68. doi: 10.1111/j.1475-6773.2009.00981.x. [DOI] [PMC free article] [PubMed] [Google Scholar]
- Hanoch Y, Wood S, Barnes A, Liu P-J. Rice T. Choosing the Right Medicare Prescription Drug Plan: The Effect of Age, Strategy Selection and Choice Set Size. Health Psychology. 2011;30(6):719–27. doi: 10.1037/a0023951. [DOI] [PMC free article] [PubMed] [Google Scholar]
- Hayes M. Scharkow M. The Relative Trustworthiness of Inferential Tests of the Indirect Effect in Statistical Mediation Analysis: Does Method Really Matter? Psychological Science. 2013 doi: 10.1177/0956797613480187. [accessed on July 20, 2013]. Available at http://pss.sagepub.com/content/early/2013/08/16/0956797613480187. [DOI] [PubMed] [Google Scholar]
- Hibbard JH, Jewett JJ, Engelmann S. Tusler M. Can Medicare Beneficiaries Make Informed Choices? Health Affairs. 1998;17:181–93. doi: 10.1377/hlthaff.17.6.181. doi: 10.1377/hlthaff.17.6.181. [DOI] [PubMed] [Google Scholar]
- Hibbard JH, Slovic P, Peters E, Finucane ML. Tusler M. Is the Informed-Choice Policy Approach Appropriate for Medicare Beneficiaries? Health Affairs. 2001;20:199–203. doi: 10.1377/hlthaff.20.3.199. doi: 10.1377/hlthaff.20.3.199. [DOI] [PubMed] [Google Scholar]
- Hibbard J, Mahoney ER, Stockard J. Tusler M. Development and Testing of a Short Form of the Patient Activation Measure. Health Services Research. 2005;40(6 Part 1):1918–30. doi: 10.1111/j.1475-6773.2005.00438.x. [DOI] [PMC free article] [PubMed] [Google Scholar]
- Hibbard JH, Peters EM, Dixon A. Tusler M. Consumer Competencies and the Use of Comparative Quality Information: It Isn't Just About Literacy. Medical Care Research and Review. 2007;64:379–94. doi: 10.1177/1077558707301630. [DOI] [PubMed] [Google Scholar]
- Kaiser Family Foundation. 2013. Kaiser Health Tracking Poll [accessed on August 31, 2013]. Available at http://kff.org/health-reform/poll-finding/kaiser-health-tracking-poll-April-2013/
- Khwaja A, Silverman D. Sloan FA. Time Preferences, Time Discounting, and Smoking Decisions. Journal of Health Economics. 2007;25(5):927–49. doi: 10.1016/j.jhealeco.2007.02.004. [DOI] [PubMed] [Google Scholar]
- Kim J, Braun B. Williams AD. Understanding Health Insurance Literacy: A Review. Family and Consumer Sciences Research Journal. 2013;42(1):3–13. [Google Scholar]
- Lipkus IM, Samsa G. Rimer BK. General Performance on a Numeracy Scale among Highly Educated Samples. Medical Decision Making. 2001;21(1):37–44. doi: 10.1177/0272989X0102100105. [DOI] [PubMed] [Google Scholar]
- Lockwood CM. MacKinnon DP. Proceedings of the 23rd SAS Users Group International Conference. Cary, NC: SAS Institute; 1998. Bootstrapping the Standard Error of the Mediated Effect; pp. 997–1002. [Google Scholar]
- Loewenstein GL, Friedman JY, McGill B, Ahmad S, Linck S, Sinkula S, Beshears J, Choi JJ, Kolstad J, Laibson D, Madrian BC, List JA. Volpp KG. Consumers' Misunderstanding of Health Insurance. Journal of Health Economics. 2013;32:850–62. doi: 10.1016/j.jhealeco.2013.04.004. [DOI] [PubMed] [Google Scholar]
- Lusardi A. Mitchell OS. 2011. Financial Literacy and Planning: Implications for Retirement Wellbeing.” NBER Working Paper Number 17078. [accessed on August 22, 2013]. Available at: http://www.nber.org/w17078.
- MacKinnon DP. Dwyer JH. Estimating Mediated Effects in Prevention Studies. Evaluation Review. 1993;17:144–58. [Google Scholar]
- Mangan D. 2013. “ Insurance Exchange Deal Signed with Web Insurer Sites.” CNBC. [accessed on July 29, 2013]. Available at http://www.cnbc.com/id/100925732.
- Marquis SM. Consumers' Knowledge about Their Health Insurance Coverage. Health Care Financing Review. 1983;5:65–80. [PMC free article] [PubMed] [Google Scholar]
- McCormack L, Bann C, Uhrig J, Berkman N. Rudd R. Health Insurance Literacy of Older Adults. Journal of Consumer Affairs. 2009;43(2):223–48. [Google Scholar]
- Mechanic D. Consumer Choice among Health Insurance Options. Health Affairs. 1989;8:138–48. doi: 10.1377/hlthaff.8.1.138. [DOI] [PubMed] [Google Scholar]
- MedPAC. 2006. Report to Congress: Increasing the Value of Medicare [accessed on September 4, 2013]. Available at http://medpac.gov/publications%5Ccongressional_reports%5CJun06_Ch08.pdf.
- Nease RF, Frazee SG, Zarin L. Miller SB. Choice Architecture Is a Better Strategy than Engaging Patients to Spur Behavior Change. Health Affairs. 2013;32(2):242–9. doi: 10.1377/hlthaff.2012.1075. [DOI] [PubMed] [Google Scholar]
- O'Neill JE. O'Neill DM. Who are the Uninsured? Washington, DC: Employment Policies Institute; 2009. [accessed on July 14, 2013]. Available at http://www.epionline.org/studies/oneill_06-2009.pdf. [Google Scholar]
- Paolacci G, Chandler C. Ipeirotis PG. Running Experiments on Amazon Mechanical Turk. Judgment and Decision Making. 2010;5(5):411–9. [Google Scholar]
- Peters E, Meilleur L. Tompkins MK. Numeracy and the Affordable Care Act: Opportunities and Challenges. Washington, DC: Institute of Medicine; 2013. [Google Scholar]
- Peters E, Hibbard J, Slovic P. Dieckmann N. Numeracy Skill and the Communication, Comprehension, and Use of Risk-Benefit Information. Health Affairs. 2007;26:741–8. doi: 10.1377/hlthaff.26.3.741. [DOI] [PubMed] [Google Scholar]
- Reyna V, Nelson WL, Han PK. Diekman NF. How Numeracy Influences Risk Comprehension and Medical Decision Making. Psychological Bulletin. 2009;135:943–73. doi: 10.1037/a0017327. [DOI] [PMC free article] [PubMed] [Google Scholar]
- Simon HA. A Behavioral Model of Rational Choice. Quarterly Journal of Economics. 1955;69:99–118. [Google Scholar]
- StataCorp. Stata Statistical Software: Release 12. College Station, TX: StataCorp LP; 2011. [Google Scholar]
- Steinberg L. A Social Neuroscience Perspective on Adolescent Risk Taking. Developmental Review. 2008;28:78–106. doi: 10.1016/j.dr.2007.08.002. [DOI] [PMC free article] [PubMed] [Google Scholar]
- Steinberg L, Graham S, O'Brien L, Woolard J, Cauffman E. Banich M. Age Differences in Future Orientation and Delay Discounting. Child Development. 2009;80:28–44. doi: 10.1111/j.1467-8624.2008.01244.x. [DOI] [PubMed] [Google Scholar]
- Szrek H. Bundorf MK. Age and the Purchase of Prescription Drug Insurance by Older Adults. Psychology and Aging. 2011;26:308–20. doi: 10.1037/a0023169. [DOI] [PMC free article] [PubMed] [Google Scholar]
- Szrek H. Bundorf MK. Enrollment in Prescription Drug Insurance: The Interaction of Numeracy and Choice Set Size. Health Psychology. 2013 doi: 10.1037/a0032738. doi: 10.1037/a0032738. [Epub ahead of print] [DOI] [PMC free article] [PubMed] [Google Scholar]
- U.S. Department of Health and Human Services. 2009. Medical Expenditures Panel Survey. [accessed November 13, 2012]. Available at http://meps.ahrq.gov/mepsweb/data_stats/quick_tables_results.jsp?component=1&subcomponent=0&tableSeries=1&year=-1&SearchMethod=1&Action=Search. [DOI] [PubMed]
- Ware JE, Kosinski M, Bayliss MS, McHorney CA, Rogers WH. Reczek A. Comparison of Methods for the Scoring and Statistical Analysis of SF-36 Health Profile and Summary Measures: Summary of Results from the Medical Outcomes Study. Medical Care. 1995;33(4):264–79. [PubMed] [Google Scholar]
- Wood S, Hanoch Y, Barnes A, Liu PJ, Cummings J, Bhattacharya C. Rice T. Numeracy and Medicare Part D: The Importance of Choice and Literacy for Numbers in Optimizing Decision Making for Medicare's Prescription Drug Program. Psychology and Aging. 2011;26(2):295–307. doi: 10.1037/a0022028. [DOI] [PubMed] [Google Scholar]
- Zhou C. Zhang Y. The Vast Majority of Medicare Part D Beneficiaries Still Don't Choose the Cheapest Plans that Meet Their Medication Needs. Health Affairs. 2012;31:2259–64. doi: 10.1377/hlthaff.2012.0087. [DOI] [PMC free article] [PubMed] [Google Scholar]
Associated Data
This section collects any data citations, data availability statements, or supplementary materials included in this article.
Supplementary Materials
Appendix SA1:
Conceptual Model of Coverage Quality.
Appendix SA2: Survey.
Appendix SA3: 2009 MEPS Health Services Utilization and Costs.
Appendix SA4: Empirical Definitions of Control Measures Used in Adjusted Analyses.
Appendix SA5: Sensitivity Tests.
Appendix SA6: Author Matrix.