

Abstract
Lrig1 is an intestinal stem cell marker important for epithelial homeostasis. However, the position of the Lrig1+ population in the intestinal crypt has been debated, largely due to discrepant staining patterns using two Lrig1 antibodies. Here, we set out to decipher the differences between these Lrig1 antibodies to clarify their use for Lrig1-related studies. We confirmed the commercially available Lrig1-R&D antibody stained the bottom third of the colonic crypt, whereas an independently generated Lrig1-VU antibody recognized a subset of anti-Lrig1-R&D+ cells. Biochemically, we found that anti-Lrig1-VU recognized a non-glycosylated form of Lrig1; in contrast, anti-Lrig1-R&D recognized both glycosylated and non-glycosylated forms of Lrig1. In addition, we generated a reporter mouse (Lrig1-Apple) as an independent readout of Lrig1 transcriptional activity. Flow cytometry of isolated colonic epithelial cells from Lrig1-Apple mice demonstrated anti-Lrig1-R&D recognized mostly RFP-hi cells, while anti-Lrig1-VU recognized cells that were largely RFP-mid. We conclude anti-Lrig1-R&D appears to recognize all Lrig1+ cells, while anti-Lrig1-VU recognizes a subpopulation of Lrig1+ cells.
Keywords: leucine-rich and immunoglobulin-like domains protein 1 (Lrig1), intestinal stem cells, anti-Lrig1 antibody
Introduction
Identification of adult intestinal stem cell markers has accelerated in recent years, following the discovery of the first bona fide marker, Lgr5, by Barker and colleagues in 2007 (Barker et al., 2007). Powell et al. identified leucine-rich repeats and immunoglobulin-like domains protein 1 (Lrig1) as an intestinal stem cell marker in 2012 (Powell et al., 2012). At the same time, Wong et al. demonstrated that Lrig1 was important for intestinal homeostasis (Wong et al., 2012). While both groups demonstrated that Lrig1 marks cells in the intestinal epithelial stem cell zone, discrepant observations of Lrig1 protein distribution in the intestinal crypt were observed.
Wong and colleagues, focusing on the small intestine, demonstrated that Lrig1 transcript and protein are expressed in the progenitor cell zone of the crypt base using in situ hybridization and immunofluorescent analysis. Using flow cytometry, they showed that 30% of intestinal epithelial cells express Lrig1 and these Lrig1+ cells express intestinal stem cell marker transcripts (Wong et al., 2012). Our group—focused on the colon—demonstrated that Lrig1 marks a bona fide intestinal stem cell population that gives rise to all differentiated intestinal epithelial cell types using lineage tracing studies. Additionally, we showed that Lrig1 protein is expressed in select cells in the colonic crypt base, rather than in a broad pattern. Flow cytometry demonstrated only 4.8% of colonic epithelial cells express Lrig1; RNA-Seq analysis of this Lrig1+ population flow-sorted population also revealed enrichment of intestinal stem cell marker transcripts (Powell et al., 2012). The relationship between different stem cell populations and between stem cells and committed progenitors, as well as studies of stem cell behavior, are marker-based. Therefore, it is essential to clarify the Lrig1 expression discrepancy to facilitate Lrig1-related studies.
These two independent studies utilized different anti-Lrig1 antibodies to assess Lrig1 protein expression. Wong et al. used a commercial goat polyclonal anti-Lrig1 antibody from R&D Systems™, raised against nearly the entire ectodomain of mouse Lrig1 (#AF3688; hereafter anti-Lrig1-R&D) (Wong et al., 2012), while in collaboration with Covance (Denver, PA), Powell et al. generated a rabbit polyclonal peptide antibody to a sequence (KILSVDGSQLKSY) in the ectodomain of mouse Lrig1 (hereafter anti-Lrig1-VU) (Powell et al., 2012). Using a new Lrig1 reporter mouse (Lrig1-Apple), we set out to further characterize these antibodies to clarify their use for future Lrig1-related studies. We show anti-Lrig1-R&D appears to recognize all Lrig1+ cells, while anti-Lrig1-VU recognizes a subset of Lrig1+ cells, likely expressing a non-glycosylated form of Lrig1.
Materials and Methods
Mice
The Lrig1-mAppleC1 construct was made by BAC recombineering using the 129 Lrig1 BAC clone from the Sanger Institute (bMQ291-E18). The Apple red fluorescent protein variant excites at 568 nm and emits at 592 nm. The 5′ and 3′ oligonucleotide probes were generated by PCR; the primers used for their generation are listed in Supplemental Table 1. The Transgenic Mouse/ES Cell Shared Resource at Vanderbilt University performed ES cell electroporation and blastocyst injections. ES cell clones were screened by Southern blotting to identify Lrig1-mAppleC1 integration. Chimeras were generated and individuals with germline transmission were identified by PCR genotyping of tail DNA (oligonucleotide primers listed in Supplemental Table 1). Germline-transmitted Lrig1-mAppleC1 chimeras were intercrossed with FlpE mice (B6.SJL strain) to eliminate the FRT-flanked PGK-neo cassette. Genotyping PCR identified wildtype and Lrig1-Apple/+ mice. Loss of the PGK-neo cassette was detected by PCR (oligonucleotide primers listed in Supplemental Table 1). All animal protocols were approved and performed in accordance with the Vanderbilt University Medical Center Animal Care and Use Program. Mice were fed standard rodent chow and water ad libitum and housed under controlled light cycle conditions.
Cloning of Lrig1-EGFP and transfection
Full-length mouse Lrig1 cDNA (#MG50511-M, Sina Biological Inc.) was cloned into the pEGFP-N1 plasmid (# 6085-1, Clonetech), resulting in the Lrig1-EGFP C-terminal fusion protein. Lrig1-pEGFP-N1 (Lrig1-EGFP) and pEGFP-N1 (EGFP) were transiently transfected into human HEK293T cells using Metafectene (Biontex, Germany) according to the manufacturer's instructions.
Isolation of colonic epithelium for western blotting, cell lysis, and immunoprecipitation
Intestinal tissue was freshly dissected and crypts were isolated as previously described (Powell et al., 2012; Whitehead et al., 1987). Isolated crypt epithelium was lysed as previously described (Powell et al., 2012). Protein concentrations were determined using a microBCA assay kit (Pierce, Rockford, IL). Thirty milligrams of lysates were resolved on a 7.5% SDS-PAGE gel and western blotting was performed according to a standard western blotting protocol. Autoradiography visualization was performed with ECL reagents (Perkin Elmer, Waltham, MA). The following primary antibodies were used for western blotting: anti-Lrig1-R&D 1:300 (#AF3688, R&D Systems, Minneapolis, MN); anti-Lrig1-VU 1:300 (made in collaboration with Covance, Denver PA (Powell et al., 2012)); anti-green fluorescent protein (GFP) 1:1000 (#A11122, Invitrogen, Grand Island, NY); and anti-α-tubulin 1:10,000 (#CP06, Calbiochem, San Diego, CA). Species-specific HRP-conjugated secondary antibodies were obtained from Jackson ImmunoResearch (West Grove, PA). Transfected HEK293T cells were lysed with RIPA buffer (50mM Tris pH7.2; 150mM NaCl; 1% NP-40; 0.5% deoxycholic acid; 0.1% SDS) containing protease inhibitors (#P2714, Sigma, St. Louis, MO). Lysates were centrifuged to remove the insoluble pelleted fraction and the supernatant was used for immunoprecipitation. Five hundred micrograms of cell lysates were immunoprecipitated with anti-Lrig1-R&D, anti-Lrig1-VU, or anti-GFP, and recovered using Dynabeads® Protein A (#10001D, Invitrogen) or Dynabeads® Protein G (#10009D, Invitrogen). Immunoprecipitates were resolved with SDS-PAGE and western blotting as above.
Peptide blocking
Wildtype mouse colonic crypt lysates were resolved by SDS-PAGE. Twenty-fold molar excess of anti-Lrig1-VU blocking peptide was added to anti-Lrig1-VU and anti-Lrig1-R&D and incubated at 4°C for four hours. The antibody-blocking peptide solutions were diluted in 5% BSA-TBST as above and western blotting was performed.
Deglycosylation of colonic crypt lysates
Colonic crypt lysates were isolated and prepared as above. For PNGaseF (#P0704S, New England Biolabs, Ipswich, MA) treatment, colonic crypt protein lysates were treated according to the manufacturer's instructions. Glycoprotein Denaturing Buffer (10×) was added to lysates to 1× final concentration and the reaction denatured at 100°C for ten minutes. G7 Reaction Buffer (10×) and 10% NP-40 were added to the reaction to 1× and 1% final concentrations, respectively. Fifty microliters of PNGaseF was added to make up a total final reaction volume of 1 mL and the reaction was incubated at 37°C for one hour.
In situ hybridization
Unfixed fresh mouse tissues were embedded in Tissue-Tek® optimal cutting temperature (OCT) compound in a cold ethanol-dry ice bath and stored at -80°C. Cryosections were cut at 15 μm thickness. ISH was performed as previously described (Li et al., 2004). The Lrig1 partial cDNA used for probe synthesis was obtained by RT-PCR with total RNA from isolated adult mouse colonic crypts. Primers used for RT-PCR are provided in Supplemental Table 1. The synthesis of digoxigenin (DIG)-labeled probes was performed according to manufacturer's protocols (Roche).
Colonic crypt isolation and staining
Colonic epithelial crypts from wildtype and uninduced Lrig1-CreERT2/+ mice were isolated and stained as previously described (Tan et al., 2013). The following primary antibodies were used for staining: anti-Lrig1-R&D 1:100 (#AF3688, R&D Systems, Minneapolis, MN) and anti-Lrig1-VU 1:100. Anti-phalloidin was a generous gift from Jim Goldenring, M.D., Ph.D. Crypts were counterstained with the nuclear marker DAPI.
Tissue preparation and staining
Tissue preparation and staining were performed as previously described (Powell et al., 2011). Freshly dissected intestinal tissues were fixed in 4% paraformaldehyde (PFA) for one hour at room temperature, washed and submerged in 30% sucrose overnight at 4°C. The next day, fixed tissue was embedded for cryosectioning in Tissue-Tek® OCT compound and sectioned (5 μM sections) for staining. Immunostaining on frozen cryosections was performed as previously described (Davies et al., 2009). Direct fluorescence was used to visualize RFP in Lrig1-Apple/+ tissue sections in the Cy3 channel. The following primary antibodies were used for immunofluorescence: anti-Lrig1-R&D 1:100 (#AF3688, R&D Systems, Minneapolis, MN); anti-Lrig1-VU 1:200 (generation described in (Powell et al., 2012); anti-Muc2 conjugated to Cy5 1.5:100 (#sc-15334, Santa Cruz, Dallas, TX); and anti-CD117 1:250 (c-Kit; #CBL1360, Millipore, Billerica, MA). All sections were counterstained with DAPI. Slides were visualized with an Olympus FV-1000 and Zeiss Imager M2.
FACS
Tissue for FACS was prepared as previously described (Powell et al., 2012). Briefly, freshly dissected mouse intestine was prepared and isolated crypts from Lrig1-Apple/+ mice were collected by slow centrifugation (400 rpm, five minutes). Crypts were resuspended in 3% pancreatin solution for ninety minutes (Whitehead et al., 1987), pipetted to single cells, and then resuspended in Hams F12 media with 1% FCS. DAPI (1:10,000; Sigma, St. Louis, MO) was used as a viability marker. RFP-hi, RFP-mid, and RFP-neg populations were isolated with a Becton Dickson FACS Aria II using a 100 μm nozzle and placed on ice. Each cell fraction was subsequently stained with either anti-Lrig1-VU conjugated to Alexa-647 fluorophore (1:250) or anti-Lrig1-R&D conjugated to Alexa-488 fluorophore (1:250; #FAB3688G, R&D Systems) for thirty minutes on ice. Cells were then washed and subsequently analyzed on a Becton Dickson FACSAria II, using DAPI (1:10,000) as a viability marker. Cell doublets were eliminated on the basis of pulse width.
qRT-PCR analysis
Total RNA was isolated from FACS-isolated colonic epithelial cells using a RNeasy Micro Kit (#14004, Qiagen, Germantown, MD) and cDNA was made by reverse transcription using SuperScriptII (Invitrogen, Grand Island, NY). Triplicate qPCR was done using the StepOnePlus Real-Time PCR system (Applied Biosystems, Grand Island, NY). qPCR reaction components were as follows: 0.1 μM primers, 4 mM MgCl2, and EXPRESS SYBR GreenER Supermix with premixed ROX (A10315, Invitrogen, Grand Island, NY) in a 20 μL reaction. The reaction conditions were as follows: 50°C for two minutes, 95°C for two minutes; 95°C for fifteen seconds, 58°C for forty-five seconds (45 cycles), followed by a melting curve. Data were analyzed using the ΔΔCT method. The primer sequences for genes assayed are shown in Supplemental Table 1. All qRT-PCR assays were performed three times in triplicate.
Identification of Lrig1 glycosylation sites
We utilized the Glycoprotein database (GPDB) to identify predicted and confirmed Lrig1 N-glycosylation sites, found at http://jcggdb.jp/rcmg/gpdb/index (Kaji et al., 2012). This group confirmed N-glycosylation sites using liquid chromatography-mass spectrometry (LC-MS) from mouse tissues (Kaji et al., 2003; Kaji et al., 2006). One confirmed Lrig1 N-glycosylation site was identified from murine brain tissue at N76; predicted Lrig1 N-glycosylation sites included: N152, N248, N294, N320, N385, and N686.
Results
Anti-Lrig1-VU recognizes a subset of anti-Lrig1-R&D+ cells
We first compared the reactivity of each anti-Lrig1 antibody on isolated mouse colonic crypts by immunofluorescence. Consistent with previously published results, anti-Lrig1-R&D recognized nearly every epithelial cell in the bottom third of the crypt base (Figure 1A, A′) (Wong et al., 2012). In contrast, anti-Lrig1-VU stained a subset of cells in the crypt base (Figure 1B, B′), as previously described (Powell et al., 2012). Co-immunofluorescence using both anti-Lrig1 antibodies revealed that anti-Lrig1-VU immunoreactivity (Figure 1C′ 1C″, 1C‴), red) was restricted to a subset of anti-Lrig1-R&D+ cells (Figure 1C; 1C″, 1C‴), green). Lrig1 is a type I transmembrane protein and is expected to be located on the plasma membrane (Nilsson et al., 2001). We observed that the immunoreactive patterns of both antibodies were largely restricted to the basolateral membrane of epithelial cells within the crypt base, although cytoplasmic staining was previously observed with anti-Lrig1-VU in mouse colonic tissue sections (Powell et al., 2012); we observed no nuclear immunoreactivity with either antibody. To facilitate our analysis, we generated a Lrig1 reporter mouse, Lrig1-Apple, which produces Apple fluorescent protein, a red fluorescent protein (RFP) variant, under control of the Lrig1 promoter (Supplemental Figure 1). Hereafter, we refer to this reporter mouse as Lrig1-Apple and Apple fluorescence as RFP. While RFP expression may not directly correlate with Lrig1 transcript expression, it serves as a surrogate marker for Lrig1 promoter activity. We detected RFP expression in the base of every crypt along the length of both the small and large intestine (Supplemental Figure 2; Figure 1D) and observed consistent immunoreactive patterns with both Lrig1 antibodies in Lrig1-Apple/+ small intestinal and colonic tissue sections (Supplemental Figure 3). In particular, RFP was expressed in the colonic crypt base of Lrig1-Apple/+ mice in a pattern that closely resembled the anti-Lrig1-R&D immunoreactive zone (Figure 1D), consistent with Lrig1 in situ hybridization in mouse colon (Figure 1E). These observations suggest that the anti-Lrig1-R&D immunoreactive pattern more faithfully mirrors the Lrig1 transcriptional readout than anti-Lrig1-VU, which recognizes a subset of cells with Lrig1 promoter activity and anti-Lrig1-R&D immunoreactivity.
Figure 1.
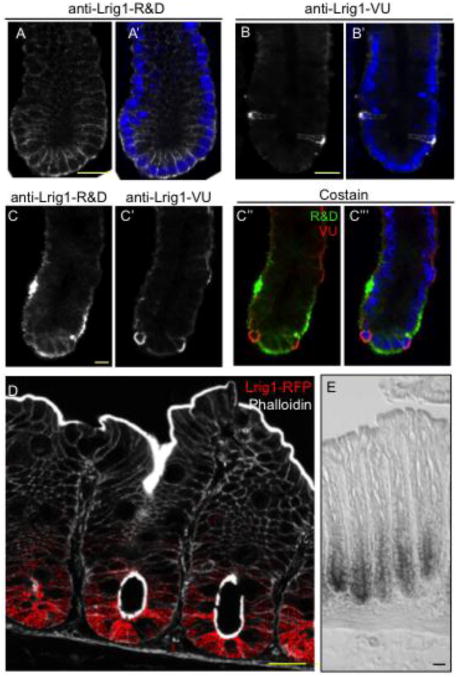
Anti-Lrig1-VU recognizes a subset of anti-Lrig1-R&D+ cells. A-B′. Immunofluorescent analysis of isolated mouse colonic crypts with anti-Lrig1-R&D (A; A′, white) and anti-Lrig1-VU (B; B′, white) counterstained with DAPI (A′, B′, blue). C-C‴. Single and co-immunofluorescence of isolated mouse colonic crypts with anti-Lrig1-R&D (C; C″, C‴, green) and anti-Lrig1-VU (C′; C″, C‴, red). D. Visualization of red fluorescent protein (RFP, red) in colonic tissue sections from Lrig1-Apple/+ mice, counterstained with phalloidin (white) to mark epithelial cells. E. Lrig1 in situ hybridization in mouse colonic tissue sections. All scale bars represent 25 μM.
Lrig1-R&D and Lrig1-VU antibodies react specifically with Lrig1 protein
To determine the basis for the discrepancy in tissue staining patterns, we took a biochemical approach to directly compare anti-Lrig1-R&D and anti-Lrig1-VU. We previously validated anti-Lrig1-VU on Lrig1-/- colonic tissue sections and on intestinal epithelial cell lysates from Lrig1-CreERT2/CreERT2 mice, which lack Lrig1 protein (Powell et al., 2012). To further test the specificity of the two anti-Lrig1 antibodies, we performed western blot analysis using colonic epithelial cell lysates from Lrig1-Apple/Apple (Lrig1-Ap/Ap) mice. The Lrig1-Apple allele was designed such that the mAppleC1 coding sequence replaces that of endogenous Lrig1 at the translational initiation site; Lrig1-Apple/Apple mice are therefore null for Lrig1 (Supplemental Figure 1; Figure 2A). Neither Lrig1 antibody detected Lrig1 protein in Lrig1-Apple/Apple tissue lysates compared to lysates from wildtype mice. Addition of an anti-Lrig1-VU blocking peptide to anti-Lrig1-VU and anti-Lrig1-R&D partially blocked Lrig1 detection by western blot analysis (Figure 2B), validating the specificity of anti-Lrig1-VU and confirming the anti-Lrig1-VU epitope lies within that of anti-Lrig1-R&D.
Figure 2.
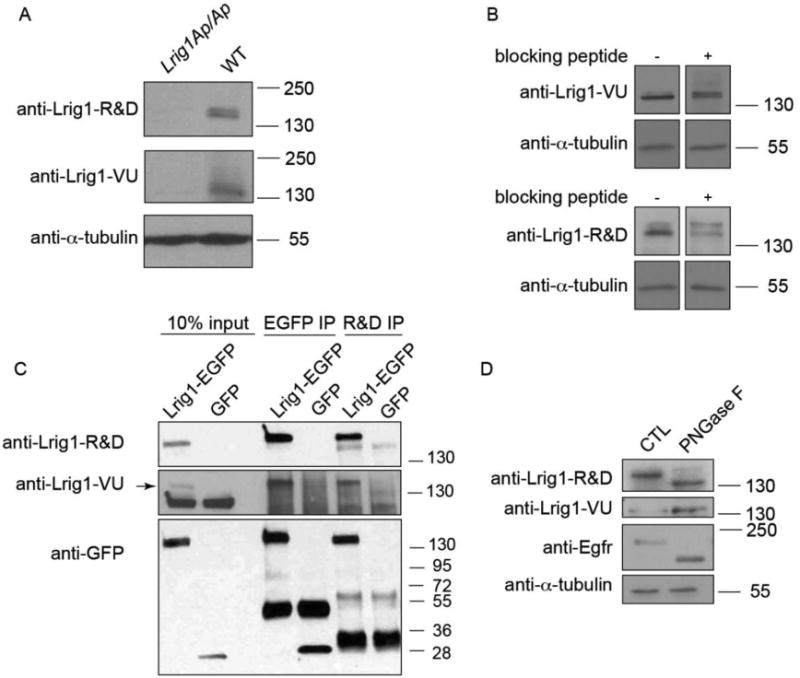
Anti-Lrig1-R&D and anti-Lrig1-VU react specifically with Lrig1 protein. A. Western blot analysis of Lrig1-Apple/Apple (Lrig1-Ap/Ap) or wildtype (WT) mouse colonic epithelial cell lysates for Lrig1 using anti-Lrig1-R&D or anti-Lrig1-VU. α-tubulin serves as a loading control. B. Western blot analysis of wildtype mouse colonic crypt lysate probed with anti-Lrig1-R&D and anti-Lrig1-VU with or without an anti-Lrig1-VU blocking peptide. C. GFP (lanes 3-4) or anti-Lrig1-R&D (lanes 5-6) immunoprecipitation from human HEK293T cell lysates, followed by western blot analysis for Lrig1 using anti-Lrig1-R&D, anti-Lrig1-VU, or anti-GFP. Lrig1-EGFP is predicted to be 146 kDa. Arrow indicates the Lrig1-specific band. D. Western blot analysis of wildtype mouse colonic crypt lysate after treatment with the N-glycosidase, PNGaseF, using anti-Lrig1-R&D and anti-Lrig1-VU. Egfr serves as a positive control to demonstrate effective PNGaseF activity. CTL, control, untreated sample.
To further examine specificity, we generated a construct encoding EGFP-tagged mouse Lrig1 (Lrig1-EGFP), transiently expressed it in human HEK293T cells, and performed reciprocal immunoprecipitation and western blot analysis (Figure 2C). Both Lrig1 antibodies detected Lrig1-EGFP following GFP immunoprecipitation, indicating specificity for Lrig1 protein. In addition, anti-Lrig1-VU detected Lrig1-EGFP following immunoprecipitation with anti-Lrig1-R&D. We observed numerous non-specific bands that may reflect non-specific binding of anti-Lrig1-VU and GFP cleavage or degradation products. These results suggest that anti-Lrig1-R&D and anti-Lrig1-VU recognize the same protein in vitro.
The main difference between these two antibodies is their respective epitopes. Anti-Lrig1-R&D was raised against nearly the entire Lrig1 ectodomain (Ala37-Thr794). In contrast, anti-Lrig1-VU was raised against a short peptide sequence in the Lrig1 ectodomain (KILSVDGSQLKSY), corresponding to Lys128-Tyr140. The anti-Lrig1-R&D antigen is much larger, which may allow greater epitope accessibility and be more permissive of post-translational modifications, such as glycosylation. In 2012, Kaji et al. published a global LC-MS glycoprotein analysis using various mouse tissue lysates (Kaji et al., 2012). Using the GlycoProtein Database (GlycoProtDB) constructed by this group, we found seven predicted N-glycosylation sites within the Lrig1 protein (Kaji et al., 2012). Without taking the three-dimensional folded structure into account, there is one predicted N-glycosylation site near the linear anti-Lrig1-VU antigenic peptide sequence: Asp152 (GlycoProtDB). To test this, we treated wildtype mouse colonic crypt lysates with the N-glycosidase, PNGaseF, and observed that the form of Lrig1 recognized by anti-Lrig1-R&D underwent a shift to a faster migrating form, consistent with deglycosylation (Figure 2D). In addition, we observed increased intensity of the band recognized by anti-Lrig1-VU, suggesting deglycosylation generated a larger pool of the Lrig1 form recognized by anti-Lrig1-VU (Figure 2D). These data suggest that both anti-Lrig1 antibodies are specific for the mouse Lrig1 protein, but Lrig1 glycosylation may affect the ability of anti-Lrig1-VU to recognize Lrig1.
FACS sorting reveals differences between anti-Lrig1-R&D+ and anti-Lrig1-VU+ cell populations
To characterize the cell populations recognized by these two Lrig1 antibodies, we performed fluorescence-activated cell sorting (FACS) analysis on colonic epithelial cells from Lrig1-Apple/+ mice. Cells were isolated on the basis of RFP expression into RFP-hi, -mid, and -neg cells (Figure 3A; Supplemental Figure 4). We performed qRT-PCR to validate FACS-isolated cells expressed proportional Lrig1 transcript levels (Figure 3B). RFP-neg cells did not express Lrig1, supporting the use of RFP as a Lrig1 readout in this in vivo system. To determine whether there were differences between the RFP-hi and -mid populations other than Lrig1, we performed qRT-PCR for additional intestinal transcripts of interest. There were no appreciable difference in expression of Villin1, Car1, and Muc2 (Supplemental Figure 5A, B, C). Muc2 protein expression was distributed evenly throughout colonic crypts (Supplemental Figure 5D). C-Kit transcript expression was not detectable by qRT-PCR (Supplemental Figure 5E), which potentially reflects the small number of RFP+ cells that express c-Kit protein (Supplemental Figure 5F). Of note, we observed the RFP-hi population contained Lgr5 expression, while RFP-mid and -neg populations did not (Figure 3C). This supports our previous data where we showed there is a population of Lrig1-expressing cells distinct from the Lgr5 stem cell population (Powell et al., 2012).
Figure 3.
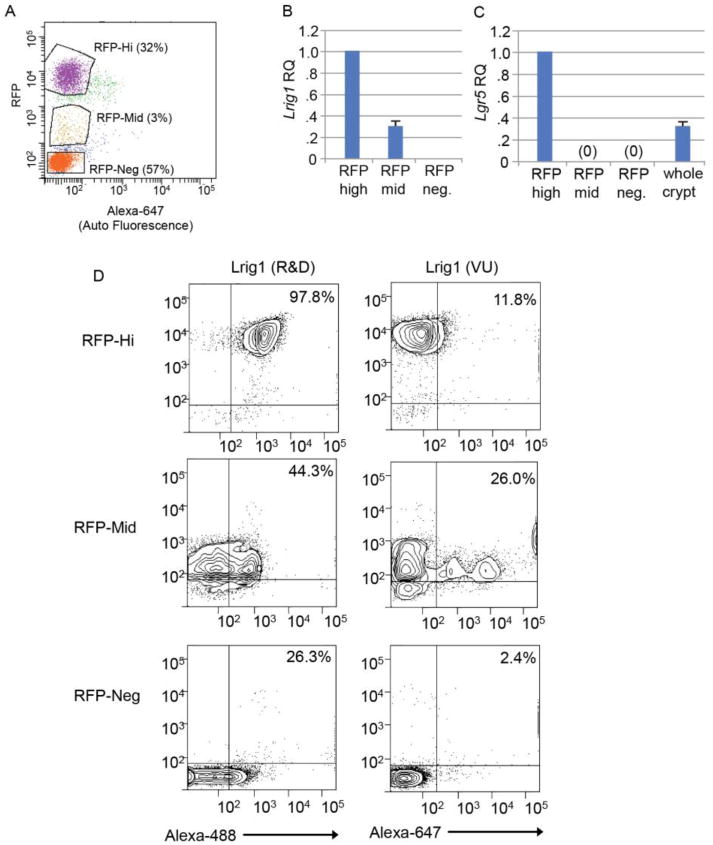
FACS sorting reveals differences between anti-Lrig1-R&D+ and anti-Lrig1-VU+ cell populations. A. Fluorescence-activated cell sorting (FACS) analysis of isolated Lrig1-Apple/+ colonic epithelial cells into RFP-hi, -mid, and -neg populations. B, C. Relative Lrig1 (B) and Lgr5 (C) expression from FACS-isolated RFP-hi, -mid, and -neg Lrig1-Apple/+ colonic epithelial cells (expression levels from whole colon crypts are shown for Lgr5 as a control). RQ, relative quantity. D. FACS analysis of RFP-hi, -mid, and -neg Lrig1-Apple/+ colonic epithelial cells co-sorted with anti-Lrig1-R&D (conjugated to Alexa-488) or anti-Lrig1-VU (conjugated to Alexa-647). Percentages indicate the number of cells present above 102 cells in each isolated population.
To determine which RFP subpopulation was preferentially recognized by each antibody, we individually stained live RFP-hi, -mid, and -neg cells with each anti-Lrig1 antibody, and immediately re-analyzed them by flow cytometry. Anti-Lrig1-R&D (conjugated to Alexa-488) recognized 98% of RFP-hi cells, while anti-Lrig1-VU (conjugated to Alexa-647) recognized only 12%. Anti-Lrig1-VU recognized mostly RFP-mid cells (44%) and displayed three apparent populations of reactivity (Figure 3D), similar to what was observed when we applied this antibody to total colonic epithelium (Powell et al., 2012). Interestingly, anti-Lrig1-R&D recognized 26% of RFP-neg cells, which may complicate its use for cell sorting. While both anti-Lrig1 antibodies are specific to Lrig1 protein by biochemical analysis (Figure 2A), these results indicate biological differences in the Lrig1-expressing cell populations recognized by each antibody.
Discussion
Lrig1 marks an intestinal stem cell population, but due to reagent differences, the position of Lrig1 in the intestinal epithelium is unclear. We set out to characterize the differences between two Lrig1 antibodies: one available commercially, anti-Lrig1-R&D, and one generated independently, anti-Lrig1-VU. In addition, we generated a new tool to study Lrig1: a Lrig1 reporter mouse, Lrig1-Apple that reflects Lrig1 transcriptional activity. From our studies here, we conclude: (1) both Lrig1 antibodies are specific to Lrig1; (2) anti-Lrig1-R&D immunoreactivity closely mirrors Lrig1 transcriptional activity, as determined by high RFP reporter expression and Lrig1 in situ hybridization; and (3) anti-Lrig1-VU recognizes a subset of Lrig1+ cells, likely cells expressing a non-glycosylated form of Lrig1. While it is clear that anti-Lrig1-VU marks a stem cell population (characterized in Powell et al., 2012), this population appears to be a subpopulation of the total Lrig1+ population. Therefore, we conclude that anti-Lrig1-R&D recognizes all Lrig1+ cells and anti-Lrig1-VU recognizes a discrete subpopulation of Lrig1+ cells that have a gene expression profile consistent with that of a stem cell and different from the Lgr5 stem cell (Powell et al., 2012).
The most obvious explanation for the observed discrepancy between these two antibodies is their respective antigenic differences: anti-Lrig1-R&D is raised against nearly the entire Lrig1 ectodomain (Ala37-Thr794), while anti-Lrig1-VU is raised against twelve amino acids (Lys128-Tyr140) of the ectodomain. When an anti-Lrig1-VU-specific blocking peptide was added, anti-Lrig1-R&D immunoreactivity was partially blocked (Figure 2B), suggesting that while the anti-Lrig1-VU epitope lies within that of anti-Lrig1-R&D, anti-Lrig1-R&D recognizes additional regions within the Lrig1 ectodomain. While there is little structural information on Lrig1, the anti-Lrig1-VU peptide lies within the leucine-rich repeat domains of the ectodomain, which alone are not required for Egfr association (Gur et al., 2004).
As the anti-Lrig1-VU epitope lies within that of anti-Lrig1-R&D, it follows that anti-Lrig1-VU recognizes a subset of anti-Lrig1-R&D+ cells. Interestingly, we have demonstrated this subset is likely marked by a form of Lrig1 that is not glycosylated. As anti-Lrig1-VU recognizes the RFP-mid population, we expect this population would express mostly non-glycosylated Lrig1, while the RFP-hi population would express mostly glycosylated Lrig1. Glycosylation is involved in multiple cell functions, including protein-protein interactions, cell-cell adhesion, protein trafficking, cell surface receptor activation, and endocytosis (Ohtsubo and Marth, 2006). Glycosylation marks are dynamic and often change as the differentiation status of a cell changes, as in the immune system (Daniels et al., 2002), and abnormal glycosylation states are often associated with cancer (Hakomori, 2002). It will be important to determine whether the differential glycosylation status of Lrig1 between the total anti-Lrig1-R&D+ population and the anti-Lrig1-R&D/anti-Lrig1-VU+ subpopulation has consequences relating to Lrig1 function and the behavior of that stem cell population.
To begin to investigate how the total Lrig1+ population differs from the anti-Lrig1-VU subset, we compared gene expression of various intestinal genes between RFP-hi, -mid, and -neg cell populations from Lrig1-Apple/+ colonic epithelial cells. Of interest, we found Lgr5 was expressed at the highest level in RFP-hi cells, which are mostly recognized by anti-Lrig1-R&D. In contrast, there was no Lgr5 expression in RFP-mid (largely recognized by anti-Lrig1-VU) or RFP-neg cells. Since cells marked by the Lgr5-EGFP reporter are highly proliferative, this observation indicates that the proliferative status of RFP-hi and RFP-mid may differ. We previously showed that 25% of anti-Lrig1-VU+ cells were also Ki67+, while Lgr5-EGFP+ cells are more highly proliferative (Powell et al., 2012). We also demonstrated that anti-Lrig1-VU+ cells are distinct from Lgr5-EGFP+ cells (Powell et al., 2012). Here, we demonstrate that most Lrig1+ cells do express Lgr5, but there is a distinct subset (RFP-mid) that does not, and anti-Lrig1-VU mostly recognizes this subset.
Technically, these two antibodies have their limitations. Both are better suited for immunofluorescent analysis in frozen tissue sections than in formalin-fixed paraffin-embedded tissues. In addition, anti-Lrig1-VU did not work for immunoprecipitation under our experimental conditions. FACS analysis is feasible using both antibodies, but the gating strategy used to separate Lrig1+ cells from background with the Lrig1-R&D antibody is not ideal. Finally, the two antibodies are not conducive to biochemical experiments when used simultaneously. We were unable to perform FACS analysis by sequential co-staining with both antibodies, suggesting that they may compete for Lrig1 binding in vitro. It should be noted that we observe non-specific staining in the upper crypt with anti-Lrig1-VU. This effect is enhanced upon simultaneous staining with anti-Lrig1-R&D, which also displays similar non-specific staining under these conditions (Figure 1C-C‴)).
This study describes a useful new tool for the study of Lrig1: the Lrig1-Apple reporter mouse. Other intestinal stem cell reporter mice, such as Lgr5 (Barker et al., 2007; Breault et al., 2008) and mTert (Breault et al., 2008) express green fluorescent protein (GFP). The Lrig1-Apple RFP reporter is therefore perfectly compatible with such GFP reporters to compare multiple stem cell populations in the same tissue. As Lrig1 is broadly expressed in many tissues (Nilsson et al., 2003), the Lrig1-Apple mouse will be a useful tool to examine the role of Lrig1 outside the intestine. It is important to note, however, in this model, RFP serves as a readout of Lrig1 transcriptional activity only and may not accurately reflect the true, regulated Lrig1 transcriptional unit or protein status in real time.
Although profiling of the entire Lrig1+ population is still lacking (but feasible using anti-Lrig1-R&D), RNA-Seq analysis demonstrated that the anti-Lrig1-VU+ cell profile is characteristic of a stem cell population (Powell et al., 2012). Immunofluorescent analysis using anti-Lrig1-VU demonstrates that the position of this subpopulation in the colonic crypt varies; it should be emphasized that the anti-Lrig1-VU+ cell position is not restricted to the crypt base columnar cell zone or the +4 position, but varies, most often occupying positions 2-5 (quantified in Powell et al., 2012).
In summary, we believe this study will be of interest to the intestinal stem cell field. There has been a reluctance to accept Lrig1 as an intestinal stem cell marker because of the discrepancies between the two Lrig1 studies published in 2012 (Powell et al., 2012; Wong et al., 2012). Here, we hope to have clarified differences between two Lrig1 antibodies and the respective Lrig1+ populations they recognize. We suggest the following usage for study of mouse Lrig1: to study all Lrig1+ and Lrig1+ cells in the intestinal crypt, we recommend using anti-Lrig1-R&D; when studying a Lrig1+ stem cell-enriched subpopulation, we recommend using anti-Lrig1-VU. In addition, real time comparison of Lrig1+ cells with other stem cell populations expressing GFP reporters is now possible with the use of Lrig1-Apple reporter mice in conjunction with anti-Lrig1-VU.
Supplementary Material
Supplemental Figure 1. Lrig1-Apple/+ mice express Apple, a red fluorescent protein (RFP), driven by the endogenous Lrig1 promoter. A. Schematic representation of the Lrig1-Apple allele. The coding sequence for mApple was targeted into the translational initiation site of the endogenous Lrig1 locus by BAC recombineering. B. Southern blot analysis with the 3′ probe after Kpn1 digestion of ES cell genomic DNA, demonstrating integration of the Lrig1-Apple allele into embryonic stem cells. C. Genotyping by PCR from Lrig1-Apple/+ and wildtype (WT) mice. The Lrig1-Apple allele size is 650 bp and the wildtype Lrig1 allele is 450 bp.
Supplemental Figure 2. RFP fluorescence is uniformly detected in the base of small intestinal and colonic crypts. Direct RFP fluorescence detection in Lrig1-Apple/+ tissue sections from duodenum (A), jejunum (B), Ileum (C), proximal colon (D), and distal colon (E). All sections were co-stained with DAPI. All scale bars represent 25 μM.
Supplemental Figure 3. Anti-Lrig1-R&D and anti-Lrig1-VU immunoreactive patterns in small intestine and colon of Lrig1-Apple/+ mice. Lrig1-Apple/+ small intestine and colon (red) stained with anti-Lrig1-R&D (green in A and B, and white in A′ and B′) and anti-Lrig1-VU (green in C and D, and white in C′ and D′). All scale bars represent 25 μM.
Supplemental Figure 4. Gating strategy to generate Figure 3A. A. Live cells were isolated by exclusion of the nuclear dye DAPI. B. Live cells from A were displayed using forward and side scatter areas to draw a gate which included objects that were the size of cells. C-D. To avoid the inclusion of doublets, cells within the gate of B were first pulse-processed using side scatter pulse width versus forward scatter area, followed by forward scatter pulse width versus side scatter area. E. Single, live colonic cells from wildtype mice were measured for RFP fluorescence, which determined the thresholds for negativity and positivity on the Y axis (autofluorescence is shown on the X-axis). F. Single, live colon cells from Lrig1-Apple mice were measured for red fluorescence and additional gates were drawn to include the positive cells on the Y axis (autofluorescence is shown on the X-axis).
Supplemental Figure 5. qRT-PCR and immunofluorescent analysis of RFP-hi, -mid, and -neg populations from Lrig1-Apple/+ mice. Relative expression of Villin1 (A), Car1 (B) and Muc2 (C). D. Immunofluorescent staining of Muc2 (red) on wildtype colon. E. c-Kit was undetectable by qRT-PCR. F. c-Kit immunofluorescence (green) on Lrig1-Apple/+ colon tissue (red). All measurements are shown as relative quantity (RQ) compared to the RFP-hi expression set to 1. All scale bars represent 50 μM.
Supplemental Table 1. Primer and probe sequences.
Highlights.
We characterized differences between two anti-Lrig1 antibodies
We generated a RFP-expressing Lrig1 reporter mouse, Lrig1-Apple
Anti-Lrig1 from R&D Systems™ appears to recognize all Lrig1+ cells
Anti-Lrig1-VU recognizes a subset of anti-Lrig1-R&D+ cells
Acknowledgments
The authors thank the Vanderbilt University Mouse/Embryonic Stem Cell, Cell Imaging, and Flow Cytometry Shared Resources for aid in generating the Lrig1-Apple mouse, imaging, and flow cytometry resources, respectively. The authors also thank Jim Higginbotham, Ph.D. for flow cytometry expertise. This work was supported by NCI R01CA151566, R01CA46413, and P50CA095103 to RJC, T32CA119925 to AEP, and T32GM008554 to E.J.P. Core Services performed through Vanderbilt University Medical Center's Digestive Disease Research Center supported by NIH Grant P30DK058404 Core Scholarship. This includes the flow sorting core. The authors thank Ardeth and Ron Obenauf for their generous support.
Abbreviations
- Lrig1
leucine-rich and immunoglobulin-like domains protein 1
- RFP
red fluorescent protein
- FACS
fluorescence-activated cell sorting
- PCR
polymerase chain reaction
- qRT-PCR
quantitative real-time PCR
Footnotes
Conflict of interest: The authors have no conflicts to disclose.
Publisher's Disclaimer: This is a PDF file of an unedited manuscript that has been accepted for publication. As a service to our customers we are providing this early version of the manuscript. The manuscript will undergo copyediting, typesetting, and review of the resulting proof before it is published in its final citable form. Please note that during the production process errors may be discovered which could affect the content, and all legal disclaimers that apply to the journal pertain.
References
- Barker N, van Es JH, Kuipers J, Kujala P, van den Born M, Cozijnsen M, Haegebarth A, Korving J, Begthel H, Peters PJ, et al. Identification of stem cells in small intestine and colon by marker gene Lgr5. Nature. 2007;449:1003–1007. doi: 10.1038/nature06196. [DOI] [PubMed] [Google Scholar]
- Breault DT, Min IM, Carlone DL, Farilla LG, Ambruzs DM, Henderson DE, Algra S, Montgomery RK, Wagers AJ, Hole N. Generation of mTert-GFP mice as a model to identify and study tissue progenitor cells. Proceedings of the National Academy of Sciences of the United States of America. 2008;105:10420–10425. doi: 10.1073/pnas.0804800105. [DOI] [PMC free article] [PubMed] [Google Scholar]
- Daniels MA, Hogquist KA, Jameson SC. Sweet ‘n’ sour: the impact of differential glycosylation on T cell responses. Nature immunology. 2002;3:903–910. doi: 10.1038/ni1002-903. [DOI] [PubMed] [Google Scholar]
- Davies PS, Powell AE, Swain JR, Wong MH. Inflammation and proliferation act together to mediate intestinal cell fusion. PloS one. 2009;4:e6530. doi: 10.1371/journal.pone.0006530. [DOI] [PMC free article] [PubMed] [Google Scholar]
- Gur G, Rubin C, Katz M, Amit I, Citri A, Nilsson J, Amariglio N, Henriksson R, Rechavi G, Hedman H, et al. LRIG1 restricts growth factor signaling by enhancing receptor ubiquitylation and degradation. The EMBO journal. 2004;23:3270–3281. doi: 10.1038/sj.emboj.7600342. [DOI] [PMC free article] [PubMed] [Google Scholar]
- Hakomori S. Glycosylation defining cancer malignancy: new wine in an old bottle. Proceedings of the National Academy of Sciences of the United States of America. 2002;99:10231–10233. doi: 10.1073/pnas.172380699. [DOI] [PMC free article] [PubMed] [Google Scholar]
- Kaji H, Saito H, Yamauchi Y, Shinkawa T, Taoka M, Hirabayashi J, Kasai K, Takahashi N, Isobe T. Lectin affinity capture, isotope-coded tagging and mass spectrometry to identify N-linked glycoproteins. Nature biotechnology. 2003;21:667–672. doi: 10.1038/nbt829. [DOI] [PubMed] [Google Scholar]
- Kaji H, Shikanai T, Sasaki-Sawa A, Wen H, Fujita M, Suzuki Y, Sugahara D, Sawaki H, Yamauchi Y, Shinkawa T, et al. Large-scale identification of N-glycosylated proteins of mouse tissues and construction of a glycoprotein database, GlycoProtDB. Journal of proteome research. 2012;11:4553–4566. doi: 10.1021/pr300346c. [DOI] [PubMed] [Google Scholar]
- Kaji H, Yamauchi Y, Takahashi N, Isobe T. Mass spectrometric identification of N-linked glycopeptides using lectin-mediated affinity capture and glycosylation site-specific stable isotope tagging. Nature protocols. 2006;1:3019–3027. doi: 10.1038/nprot.2006.444. [DOI] [PubMed] [Google Scholar]
- Li Y, Zhang H, Choi SC, Litingtung Y, Chiang C. Sonic hedgehog signaling regulates Gli3 processing, mesenchymal proliferation, and differentiation during mouse lung organogenesis. Developmental biology. 2004;270:214–231. doi: 10.1016/j.ydbio.2004.03.009. [DOI] [PubMed] [Google Scholar]
- Nilsson J, Starefeldt A, Henriksson R, Hedman H. LRIG1 protein in human cells and tissues. Cell and tissue research. 2003;312:65–71. doi: 10.1007/s00441-003-0697-1. [DOI] [PubMed] [Google Scholar]
- Nilsson J, Vallbo C, Guo D, Golovleva I, Hallberg B, Henriksson R, Hedman H. Cloning, characterization, and expression of human LIG1. Biochemical and biophysical research communications. 2001;284:1155–1161. doi: 10.1006/bbrc.2001.5092. [DOI] [PubMed] [Google Scholar]
- Ohtsubo K, Marth JD. Glycosylation in cellular mechanisms of health and disease. Cell. 2006;126:855–867. doi: 10.1016/j.cell.2006.08.019. [DOI] [PubMed] [Google Scholar]
- Powell AE, Anderson EC, Davies PS, Silk AD, Pelz C, Impey S, Wong MH. Fusion between Intestinal epithelial cells and macrophages in a cancer context results in nuclear reprogramming. Cancer research. 2011;71:1497–1505. doi: 10.1158/0008-5472.CAN-10-3223. [DOI] [PMC free article] [PubMed] [Google Scholar]
- Powell AE, Wang Y, Li Y, Poulin EJ, Means AL, Washington MK, Higginbotham JN, Juchheim A, Prasad N, Levy SE, et al. The pan-ErbB negative regulator Lrig1 is an intestinal stem cell marker that functions as a tumor suppressor. Cell. 2012;149:146–158. doi: 10.1016/j.cell.2012.02.042. [DOI] [PMC free article] [PubMed] [Google Scholar]
- Tan CW, Hirokawa Y, Gardiner BS, Smith DW, Burgess AW. Colon cryptogenesis: asymmetric budding. PloS one. 2013;8:e78519. doi: 10.1371/journal.pone.0078519. [DOI] [PMC free article] [PubMed] [Google Scholar]
- Whitehead RH, Brown A, Bhathal PS. A method for the isolation and culture of human colonic crypts in collagen gels. In vitro cellular & developmental biology : journal of the Tissue Culture Association. 1987;23:436–442. doi: 10.1007/BF02623860. [DOI] [PubMed] [Google Scholar]
- Wong VW, Stange DE, Page ME, Buczacki S, Wabik A, Itami S, van de Wetering M, Poulsom R, Wright NA, Trotter MW, et al. Lrig1 controls intestinal stem-cell homeostasis by negative regulation of ErbB signalling. Nature cell biology. 2012;14:401–408. doi: 10.1038/ncb2464. [DOI] [PMC free article] [PubMed] [Google Scholar]
Associated Data
This section collects any data citations, data availability statements, or supplementary materials included in this article.
Supplementary Materials
Supplemental Figure 1. Lrig1-Apple/+ mice express Apple, a red fluorescent protein (RFP), driven by the endogenous Lrig1 promoter. A. Schematic representation of the Lrig1-Apple allele. The coding sequence for mApple was targeted into the translational initiation site of the endogenous Lrig1 locus by BAC recombineering. B. Southern blot analysis with the 3′ probe after Kpn1 digestion of ES cell genomic DNA, demonstrating integration of the Lrig1-Apple allele into embryonic stem cells. C. Genotyping by PCR from Lrig1-Apple/+ and wildtype (WT) mice. The Lrig1-Apple allele size is 650 bp and the wildtype Lrig1 allele is 450 bp.
Supplemental Figure 2. RFP fluorescence is uniformly detected in the base of small intestinal and colonic crypts. Direct RFP fluorescence detection in Lrig1-Apple/+ tissue sections from duodenum (A), jejunum (B), Ileum (C), proximal colon (D), and distal colon (E). All sections were co-stained with DAPI. All scale bars represent 25 μM.
Supplemental Figure 3. Anti-Lrig1-R&D and anti-Lrig1-VU immunoreactive patterns in small intestine and colon of Lrig1-Apple/+ mice. Lrig1-Apple/+ small intestine and colon (red) stained with anti-Lrig1-R&D (green in A and B, and white in A′ and B′) and anti-Lrig1-VU (green in C and D, and white in C′ and D′). All scale bars represent 25 μM.
Supplemental Figure 4. Gating strategy to generate Figure 3A. A. Live cells were isolated by exclusion of the nuclear dye DAPI. B. Live cells from A were displayed using forward and side scatter areas to draw a gate which included objects that were the size of cells. C-D. To avoid the inclusion of doublets, cells within the gate of B were first pulse-processed using side scatter pulse width versus forward scatter area, followed by forward scatter pulse width versus side scatter area. E. Single, live colonic cells from wildtype mice were measured for RFP fluorescence, which determined the thresholds for negativity and positivity on the Y axis (autofluorescence is shown on the X-axis). F. Single, live colon cells from Lrig1-Apple mice were measured for red fluorescence and additional gates were drawn to include the positive cells on the Y axis (autofluorescence is shown on the X-axis).
Supplemental Figure 5. qRT-PCR and immunofluorescent analysis of RFP-hi, -mid, and -neg populations from Lrig1-Apple/+ mice. Relative expression of Villin1 (A), Car1 (B) and Muc2 (C). D. Immunofluorescent staining of Muc2 (red) on wildtype colon. E. c-Kit was undetectable by qRT-PCR. F. c-Kit immunofluorescence (green) on Lrig1-Apple/+ colon tissue (red). All measurements are shown as relative quantity (RQ) compared to the RFP-hi expression set to 1. All scale bars represent 50 μM.
Supplemental Table 1. Primer and probe sequences.