Figure 2.

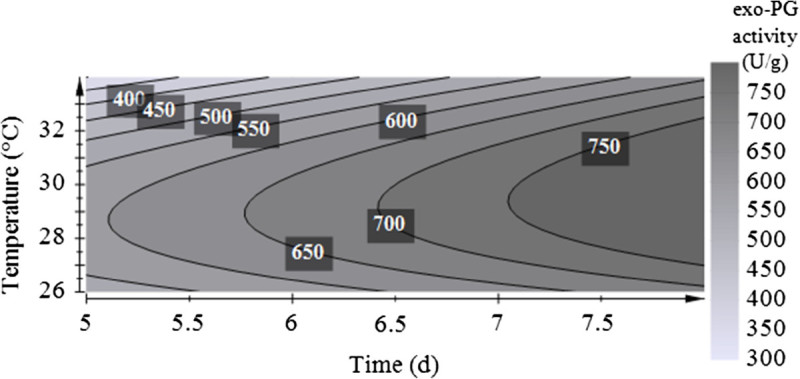
Response surface plot for PG activity as a function of temperature and time obtained by A. sojae ATCC 20235 (process optimization with D-optimal design).

Response surface plot for PG activity as a function of temperature and time obtained by A. sojae ATCC 20235 (process optimization with D-optimal design).